

Base Year Value ()
x.x %
x.x %
CAGR ()
x.x %
x.x %
Forecast Year Value ()
x.x %
x.x %
Historical Data Period
Largest Region
Forecast Period
Industrial Ethernet Market By Offering (Hardware, Software, Services), Protocol (PROFINET, EtherNet/ IP, EtherCAT, Others), End-Use (Automotive & Transportation, Electrical & Electronics, Aerospace & Defense, Others) And Region, Global Trends And Forecast From 2022 To 2029.
Instant access to hundreds of data points and trends
- Market estimates from 2014-2029
- Competitive analysis, industry segmentation, financial benchmarks
- Incorporates SWOT, Porter's Five Forces and risk management frameworks
- PDF report or online database with Word, Excel and PowerPoint export options
- 100% money back guarantee
Industrial Ethernet Market Overview
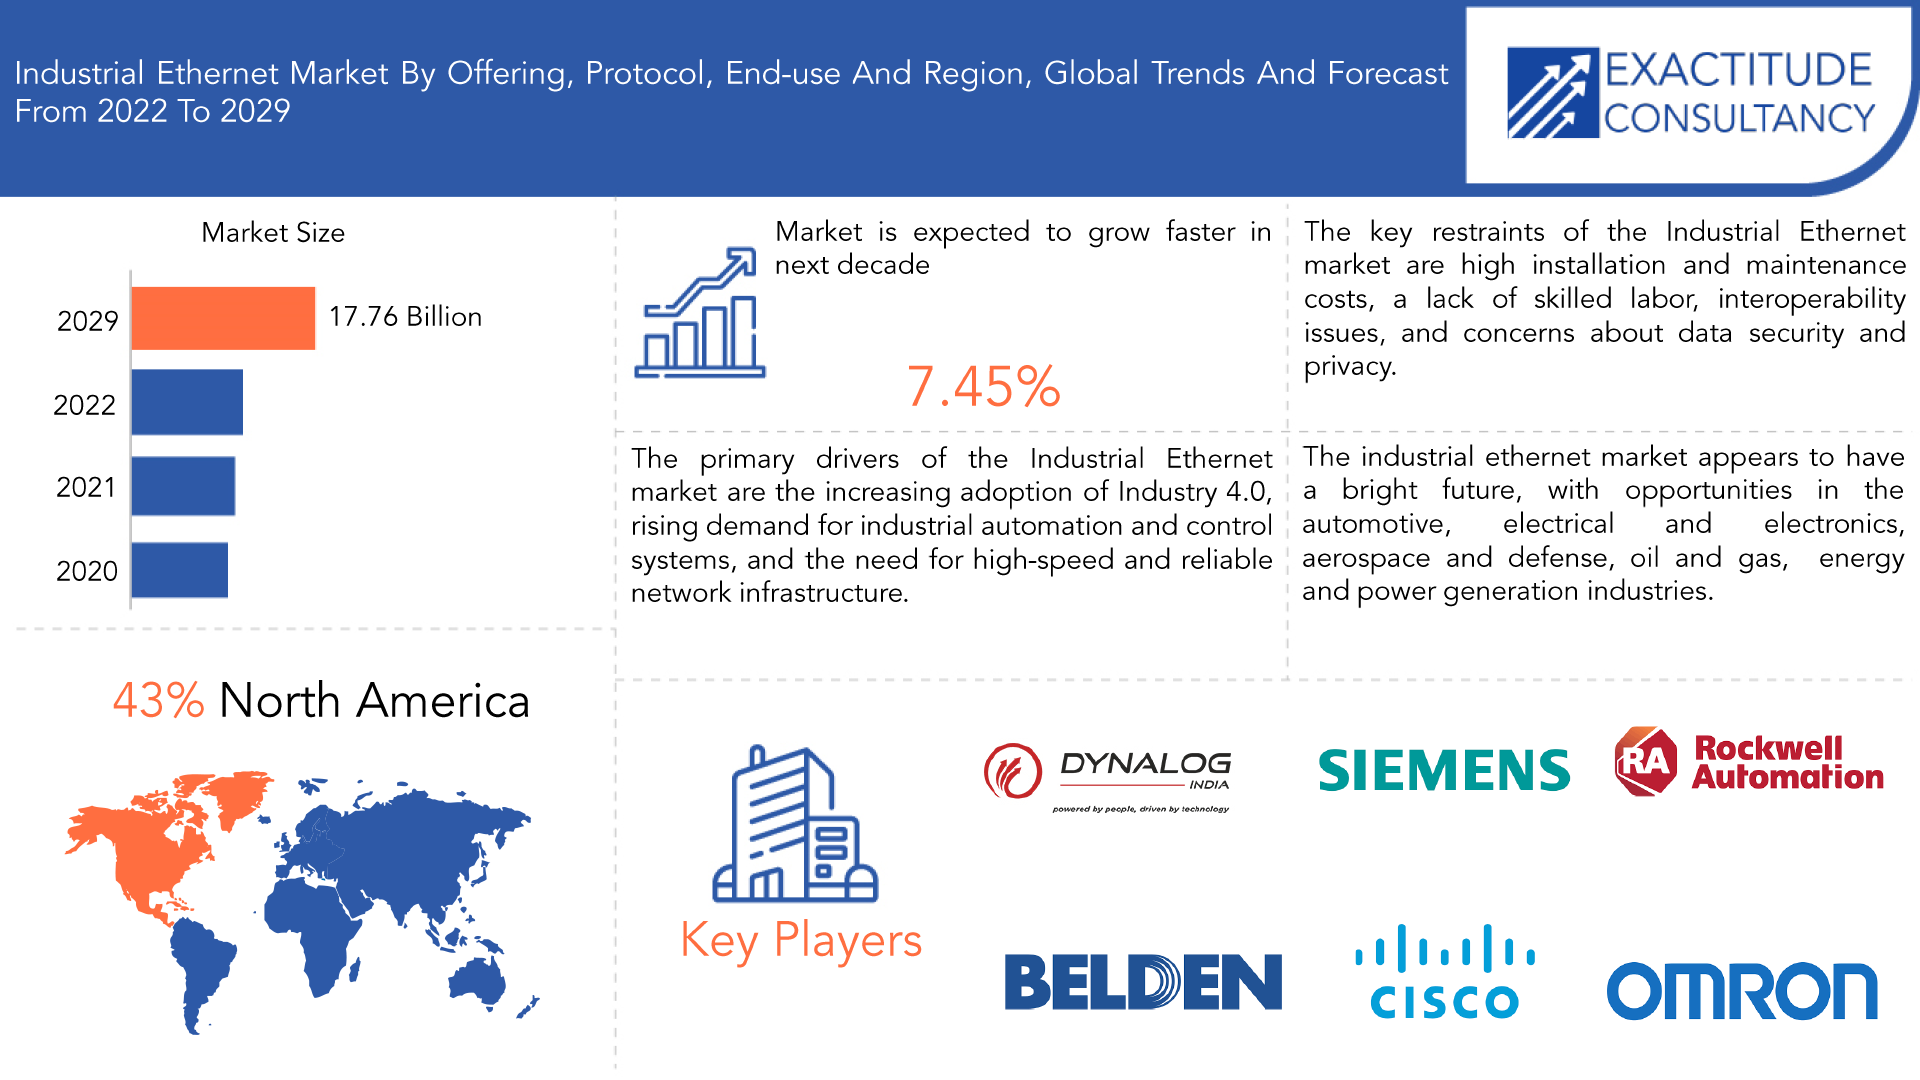
The industrial ethernet market is expected to grow at 7.45 % CAGR from 2022 to 2029. It is expected to reach above USD 17.76 Billion by 2029 from USD 10 Billion in 2021.
Ethernet is a LAN technology that connects network devices (such as computers and printers) via Ethernet switches and routers. Industrial Ethernet is an advanced version of Ethernet that is slightly more complicated. This technology applies Ethernet capabilities to industrial automation and control systems. It has recently surpassed traditional Fieldbus architectures to become the most widely used connection protocol in factories worldwide. In comparison to traditional Ethernet, industrial Ethernet typically employs advanced protocols such as EtherNet/IP, PROFINET, and Modbus TCP, which provide faster speeds, greater reliability, and enhanced security. Industrial Ethernet enables real-time communication between industrial equipment and systems, allowing for more efficient and flexible industrial process operation.
Industrial Ethernet has several advantages over other types of industrial networks, including increased data speed of up to 1 Gbit/s with Gigabit Ethernet, the ability to use standard networking hardware for wired and wireless communication, improved interoperability, and the option to use optical fibre for increased distance, among other benefits. Industrial Ethernet may also refer to the use of standard Ethernet protocols in an industrial setting, such as long-lasting connectors and thermal switches, for automated processes or control systems. Using fiber-optic Ethernet alternatives reduces electrical noise concerns and provides electrical isolation.
| ATTRIBUTE | DETAILS |
| Study period | 2020-2029 |
| Base year | 2021 |
| Estimated year | 2022 |
| Forecasted year | 2022-2029 |
| Historical period | 2018-2020 |
| Unit | Value (USD Billion), Value (Thousand units) |
| Segmentation | By offering, By protocol, By end-use, By Region |
| By offering |
|
| By protocol |
|
| By end-use |
|
| By Region |
|
Market services are recognized as critical when it comes to achieving complete transparency while working within the confines of an industrial plant. These also aid in the introduction and maintenance of efficiency within the plant, as well as the enterprise networks. The core of the Industry 4.0 concept is a dependable platform for communication networks, as the market is heavily reliant on real-time operational needs. As a result, there should be a system that is well-equipped and contains all of the features that aid in the better handling of information in a redundant manner. Furthermore, the networks should be scalable and belong to a piece of wide equipment and operational range for multiple standards with various types of interfaces.
High initial setup costs, implementation complexities, and interoperability issues are major factors limiting overall market revenue growth. Industrial ethernet networks necessitate a significant upfront investment in infrastructure and equipment, which may deter some small and medium-sized businesses from deploying them. Furthermore, the implementation of industrial ethernet networks can be complex and require specialized knowledge and expertise, which can be difficult for businesses lacking the necessary resources.
The Industrial Ethernet Market offers numerous opportunities, including increased demand for advanced communication technology in industrial applications, increased adoption of Industry 4.0, and the requirement for reliable and secure communication in harsh environments. Other possibilities include expanding industrial automation in emerging economies and developing new Industrial Ethernet protocols and solutions.
During the COVID-19 pandemic, ethernet was rapidly implemented in the industrial sector. The virus's appearance accelerated market dynamics and increased industrial IoT penetration. Similarly, in the post-pandemic era, manufacturing technology has shifted due to the introduction of improved technologies that allow for remote operations. Market acceptance has also grown as a result of the growing popularity of industry 4.0 technologies, which has aided market growth.
[caption id="attachment_21729" align="aligncenter" width="1920"]
Frequently Asked Questions
• What is the projected market size & growth rate of the industrial ethernet market?
Industrial ethernet market was valued at USD 10.74 Billion in 2022 and is projected to reach USD 17.76 Billion by 2029, growing at a CAGR of 7.45% from 2022 to 2029.
• What are the key driving factors for the growth of the industrial ethernet market?
The growing adoption of the Industrial Internet of Things (IIoT) in the manufacturing and process verticals is one of the major factors accountable for the global industrial Ethernet market growth.
• What are the top players operating in the industrial ethernet market?
The major players are Siemens, Rockwell Automation, Cisco Systems Inc., Omron Corporation, Dynalog India Ltd., Belden Inc., Huawei Technologies Co., Ltd., Schneider Electric, ABB, Honeywell International Inc.
• What segments are covered in the industrial ethernet market Report?
The global industrial ethernet market is segmented on the basis of offering, protocol, end-use, and geography.
• Which region held the largest share of industrial ethernet market in 2021?
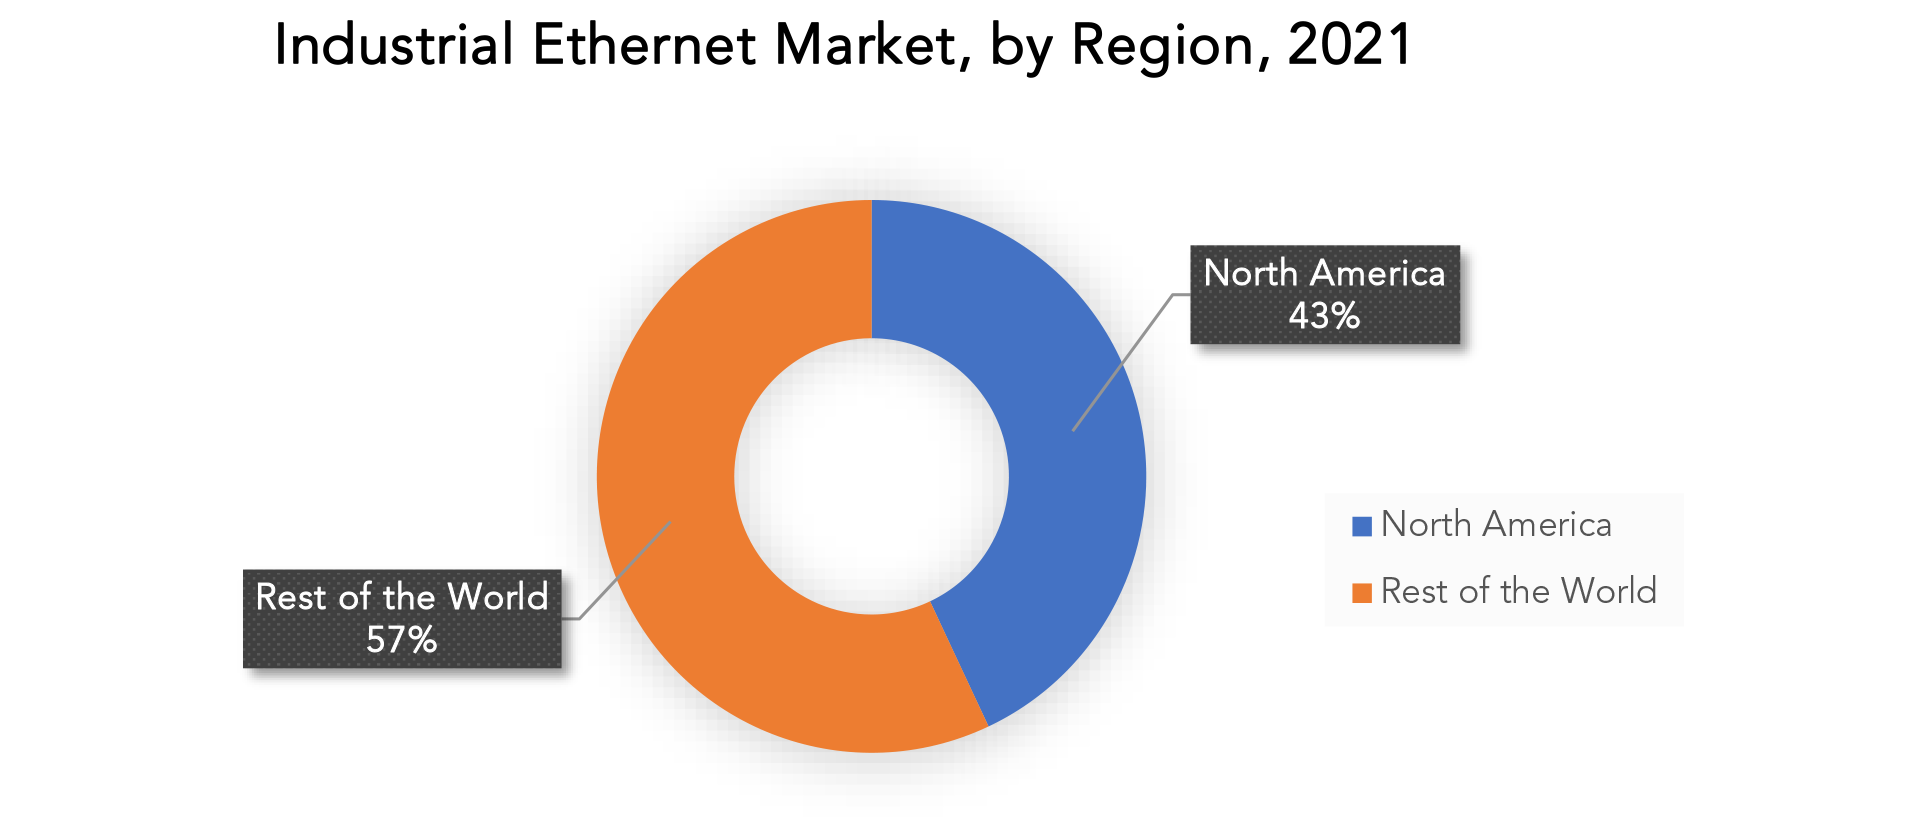
North America held the largest share of industrial ethernet market in 2021.
Industrial Ethernet Market Segment Analysis
The industrial ethernet market is segmented based on offering, protocol, end-use and region. By offering market is segmented into hardware, software, and services; by protocol market is segmented into PROFINET, EtherNet/ IP, EtherCAT, others; by end-use market is segmented into automotive & transportation, electrical & electronics, aerospace & defense, others. In 2021, the hardware segment accounted for a significant revenue share. Rapid innovation in hardware products such as industrial switches, routers, and gateways, among others, is a key factor driving this segment's revenue growth. Increasing demand for industrial ethernet components that provide improved performance in extreme temperatures, excessive humidity, robust vibrations, high dust levels, and other common factory floor conditions is also a major factor driving revenue growth in the segment. With a revenue share of 26.5% over the forecast period, the EtherNet/IP segment dominates the market. It is one of the most important industrial protocols in the world, and it is widely used in a variety of industries, including factory, hybrid, and process. EtherNet/IP is an industrial network protocol that is based on Ethernet and extends the Common Industrial Protocol (CIP). Between 2020 and 2029, the automotive and transportation applications will grow rapidly. The use of industrial ethernet for effective control and operation of various mechanical parts in automobiles is becoming more popular as the automotive industry advances. Ethernet solutions are widely used in gearbox sensors, oil tanker sensors, temperature sensors, and anti-brake systems for various cables in sensors that are applicable in a variety of environments and situations, driving up demand for ethernet technology. [caption id="attachment_21731" align="aligncenter" width="1920"]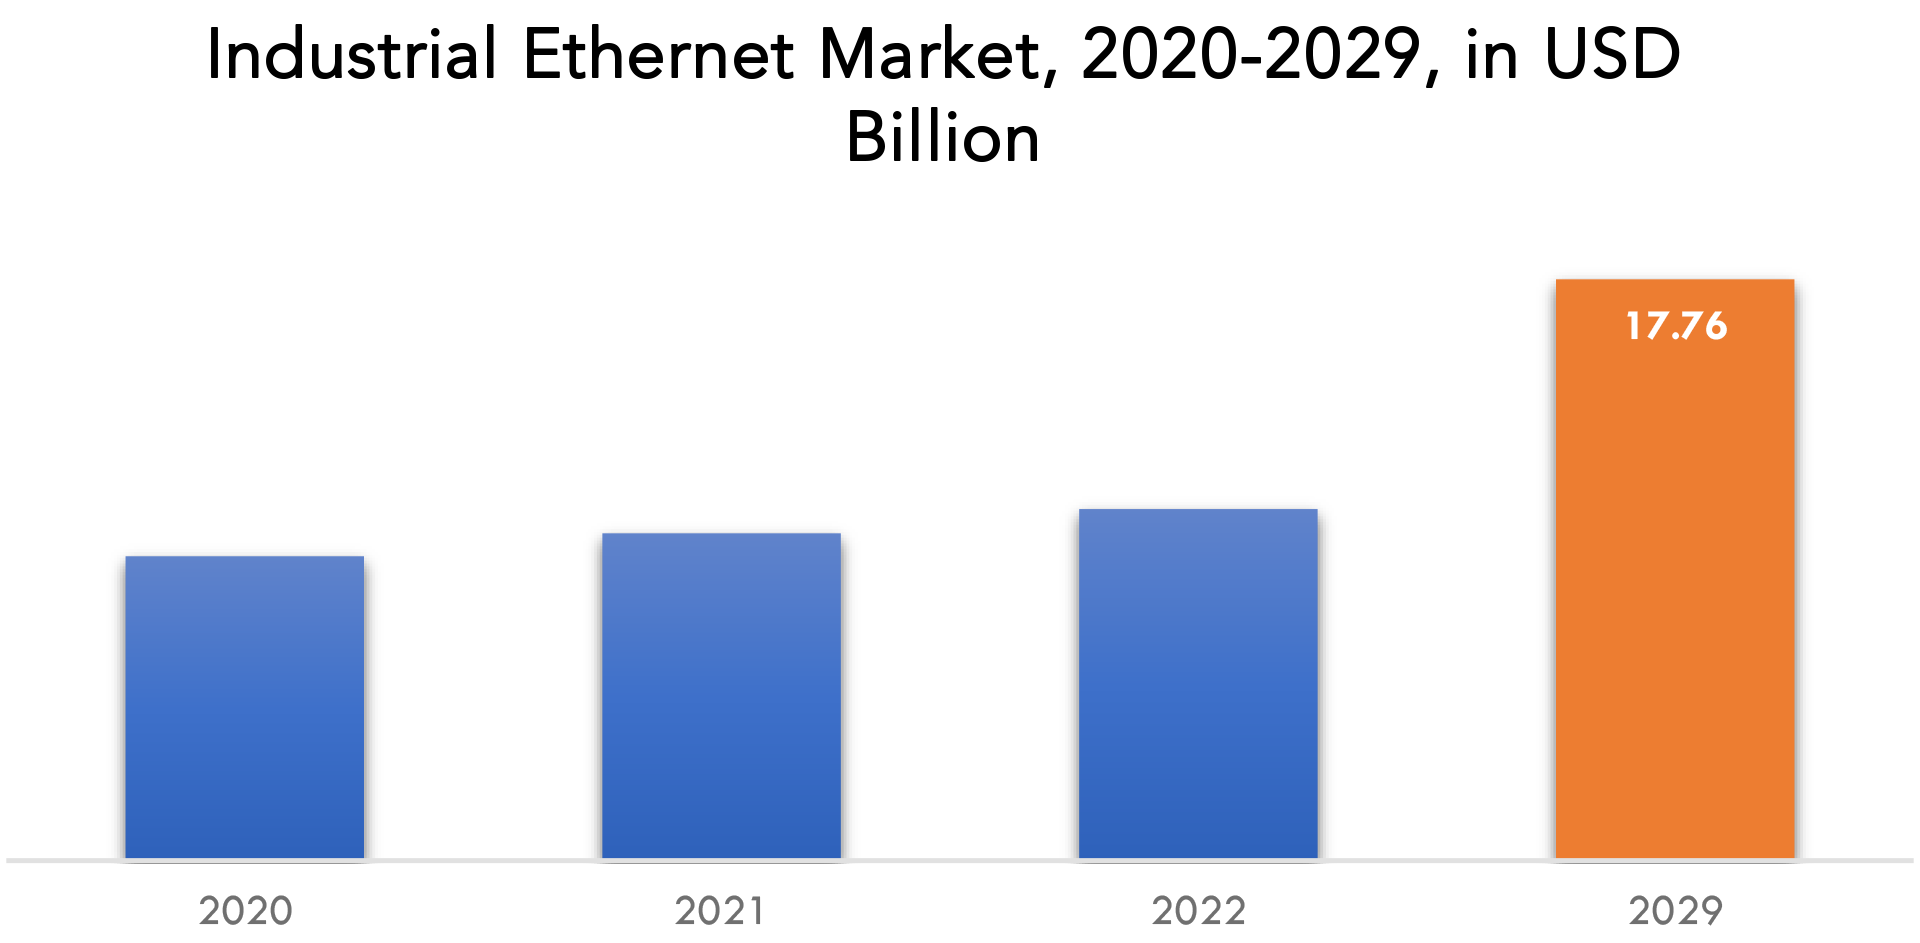
Industrial Ethernet Market Players
The industrial ethernet market key players include Siemens, Rockwell Automation, Cisco Systems Inc., Omron Corporation, Dynalog India Ltd., Belden Inc., Huawei Technologies Co., Ltd., Schneider Electric, ABB, Honeywell International Inc., and Others. Recent Developments:- 08 March 2023: Rockwell Automation, Inc., the world’s largest company dedicated to industrial automation and digital transformation, announced a strategic investment in READY Robotics, a pioneering company in software-defined automation and a Rockwell Technology Partner.
- 01 March 2023: Rockwell Automation, Inc. (NYSE: ROK), the world’s largest company dedicated to industrial automation and digital transformation, announced that it acquired Knowledge Lens.
Who Should Buy? Or Key stakeholders
- Manufacturers
- Electricals & Electronics
- Traders and distributors
- End-users companies
- Government organizations
- Research organizations
- Investment research firms
- Others
Industrial Ethernet Market Regional Analysis
The industrial ethernet market by region includes North America, Asia-Pacific (APAC), Europe, South America, and Middle East & Africa (MEA).- North America: includes the US, Canada, Mexico, Rest of North America
- Asia Pacific: includes China, Japan, South Korea, India, Australia, and Rest of APAC
- Europe: includes UK, Germany, France, Italy, Russia, Spain, and Rest of Europe
- South America: includes Brazil, Argentina, Colombia and Rest of South America
- Middle East & Africa: includes UAE, Saudi Arabia, South Africa, and Rest of MEA
Key Market Segments: Industrial Ethernet Market
Industrial Ethernet Market by Offering, 2020-2029, (USD Billion, Thousand Units)- Hardware
- Software
- Services
- PROFINET
- Ethernet/ IP
- EtherCAT
- Others
- Automotive & Transportation
- Electrical & Electronics
- Aerospace & Defense
- Others
- North America
- Asia Pacific
- Europe
- South America
- Middle East and Africa
Exactitude Consultancy Services Key Objectives:
- Increasing sales and market share
- Developing new technology
- Improving profitability
- Entering new markets
- Enhancing brand reputation
Key Question Answered
- What is the expected growth rate of the industrial ethernet market over the next 7 years?
- What are the end-user industries driving demand for market and what is their outlook?
- What are the opportunities for growth in emerging markets such as Asia-pacific, Middle East, and Africa?
- How is the economic environment affecting the industrial ethernet market, including factors such as interest rates, inflation, and exchange rates?
- What is the expected impact of government policies and regulations on the industrial ethernet market?
- What is the current and forecasted size and growth rate of the global industrial ethernet market?
- What are the key drivers of growth in the industrial ethernet market?
- Who are the major players in the market and what is their market share?
- What are the distribution channels and supply chain dynamics in the industrial ethernet market?
- What are the technological advancements and innovations in the industrial ethernet market and their impact on product development and growth?
- What are the regulatory considerations and their impact on the market?
- What are the challenges faced by players in the industrial ethernet market and how are they addressing these challenges?
- What are the opportunities for growth and expansion in the industrial ethernet market?
- What are the service offerings and specifications of leading players in the market?
- What is the pricing trend of industrial ethernet in the market and what is the impact of raw material prices on the price trend?
- INTRODUCTION
- MARKET DEFINITION
- MARKET SEGMENTATION
- RESEARCH TIMELINES
- ASSUMPTIONS AND LIMITATIONS
- RESEARCH METHODOLOGY
- DATA MINING
- SECONDARY RESEARCH
- PRIMARY RESEARCH
- SUBJECT-MATTER EXPERTS’ ADVICE
- QUALITY CHECKS
- FINAL REVIEW
- DATA TRIANGULATION
- BOTTOM-UP APPROACH
- TOP-DOWN APPROACH
- RESEARCH FLOW
- DATA SOURCES
- DATA MINING
- EXECUTIVE SUMMARY
- MARKET OVERVIEW
- GLOBAL INDUSTRIAL ETHERNET MARKET OUTLOOK
- MARKET DRIVERS
- MARKET RESTRAINTS
- MARKET OPPORTUNITIES
- IMPACT OF COVID-19 ON INDUSTRIAL ETHERNET MARKET
- PORTER’S FIVE FORCES MODEL
- THREAT FROM NEW ENTRANTS
- THREAT FROM SUBSTITUTES
- BARGAINING POWER OF SUPPLIERS
- BARGAINING POWER OF CUSTOMERS
- DEGREE OF COMPETITION
- INDUSTRY VALUE CHAIN ANALYSIS
- GLOBAL INDUSTRIAL ETHERNET MARKET OUTLOOK
- GLOBAL INDUSTRIAL ETHERNET MARKET BY OFFERING(USD BILLION, THOUSAND UNITS), 2020-2029
- HARDWARE
- SOFTWARE
- SERVICES
- GLOBAL INDUSTRIAL ETHERNET MARKET BY PROTOCOL (USD BILLION, THOUSAND UNITS),2020-2029
- PROFINET
- ETHERNET/ IP
- ETHERCAT
- OTHERS
- GLOBAL INDUSTRIAL ETHERNET MARKET BY END-USE (USD BILLION, THOUSAND UNITS),2020-2029
- AUTOMOTIVE & TRANSPORTATION
- ELECTRICAL & ELECTRONICS
- AEROSPACE & DEFENSE
- OTHERS
- GLOBAL INDUSTRIAL ETHERNET MARKET BY REGION (USD BILLION, THOUSAND UNITS),2020-2029
- NORTH AMERICA
- US
- CANADA
- MEXICO
- REST OF NORTH AMERICA
- SOUTH AMERICA
- BRAZIL
- ARGENTINA
- COLOMBIA
- REST OF SOUTH AMERICA
- EUROPE
- GERMANY
- UK
- FRANCE
- ITALY
- SPAIN
- RUSSIA
- REST OF EUROPE
- ASIA PACIFIC
- INDIA
- CHINA
- JAPAN
- SOUTH KOREA
- AUSTRALIA
- REST OF ASIA PACIFIC
- MIDDLE EAST AND AFRICA
- UAE
- SAUDI ARABIA
- SOUTH AFRICA
- REST OF MIDDLE EAST AND AFRICA
- NORTH AMERICA
- COMPANY PROFILES*
(BUSINESS OVERVIEW, COMPANY SNAPSHOT, PRODUCTS OFFERED, RECENT DEVELOPMENTS)
- SIEMENS
- ROCKWELL AUTOMATION
- CISCO SYSTEMS, INC.
- OMRON CORPORATION
- DYNALOG INDIA LTD.
- BELDEN INC.
- HUAWEI TECHNOLOGIES CO., LTD.
- SCHNEIDER ELECTRIC
- ABB
- HONEYWELL INTERNATIONAL INC.
*THE COMPANY LIST IS INDICATIVE
LIST OF TABLES
TABLE 1 GLOBAL INDUSTRIAL ETHERNET MARKET BY OFFERING (USD BILLION), 2020-2029
TABLE 2 GLOBAL INDUSTRIAL ETHERNET MARKET BY OFFERING (THOUSAND UNITS), 2020-2029
TABLE 3 GLOBAL INDUSTRIAL ETHERNET MARKET BY PROTOCOL (USD BILLION), 2020-2029
TABLE 4 GLOBAL INDUSTRIAL ETHERNET MARKET BY PROTOCOL (THOUSAND UNITS), 2020-2029
TABLE 5 GLOBAL INDUSTRIAL ETHERNET MARKET BY APPLICATION (USD BILLION), 2020-2029
TABLE 6 GLOBAL INDUSTRIAL ETHERNET MARKET BY APPLICATION (THOUSAND UNITS), 2020-2029
TABLE 7 GLOBAL INDUSTRIAL ETHERNET MARKET BY REGION (USD BILLION), 2020-2029
TABLE 8 GLOBAL INDUSTRIAL ETHERNET MARKET BY REGION (THOUSAND UNITS), 2020-2029
TABLE 9 NORTH AMERICA INDUSTRIAL ETHERNET MARKET BY OFFERING (USD BILLION), 2020-2029
TABLE 10 NORTH AMERICA INDUSTRIAL ETHERNET MARKET BY OFFERING (THOUSAND UNITS), 2020-2029
TABLE 11 NORTH AMERICA INDUSTRIAL ETHERNET MARKET BY PROTOCOL (USD BILLION), 2020-2029
TABLE 12 NORTH AMERICA INDUSTRIAL ETHERNET MARKET BY PROTOCOL (THOUSAND UNITS), 2020-2029
TABLE 13 NORTH AMERICA INDUSTRIAL ETHERNET MARKET BY APPLICATION (USD BILLION), 2020-2029
TABLE 14 NORTH AMERICA INDUSTRIAL ETHERNET MARKET BY APPLICATION (THOUSAND UNITS), 2020-2029
TABLE 15 NORTH AMERICA INDUSTRIAL ETHERNET MARKET BY COUNTRY (USD BILLION), 2020-2029
TABLE 16 NORTH AMERICA INDUSTRIAL ETHERNET MARKET BY COUNTRY (USD BILLION), 2020-2029
TABLE 17 US INDUSTRIAL ETHERNET MARKET BY OFFERING (USD BILLION), 2020-2029
TABLE 18 US INDUSTRIAL ETHERNET MARKET BY OFFERING (THOUSAND UNITS), 2020-2029
TABLE 19 US INDUSTRIAL ETHERNET MARKET BY PROTOCOL (USD BILLION), 2020-2029
TABLE 20 US INDUSTRIAL ETHERNET MARKET BY PROTOCOL (THOUSAND UNITS), 2020-2029
TABLE 21 US INDUSTRIAL ETHERNET MARKET BY APPLICATION (USD BILLION), 2020-2029
TABLE 22 US INDUSTRIAL ETHERNET MARKET BY APPLICATION (THOUSAND UNITS), 2020-2029
TABLE 23 CANADA INDUSTRIAL ETHERNET MARKET BY OFFERING (BILLION), 2020-2029
TABLE 24 CANADA INDUSTRIAL ETHERNET MARKET BY OFFERING (THOUSAND UNITS), 2020-2029
TABLE 25 CANADA INDUSTRIAL ETHERNET MARKET BY PROTOCOL (USD BILLION), 2020-2029
TABLE 26 CANADA INDUSTRIAL ETHERNET MARKET BY PROTOCOL (THOUSAND UNITS), 2020-2029
TABLE 27 CANADA INDUSTRIAL ETHERNET MARKET BY APPLICATION (USD BILLION), 2020-2029
TABLE 28 CANADA INDUSTRIAL ETHERNET MARKET BY APPLICATION (THOUSAND UNITS), 2020-2029
TABLE 29 MEXICO INDUSTRIAL ETHERNET MARKET BY OFFERING (USD BILLION), 2020-2029
TABLE 30 MEXICO INDUSTRIAL ETHERNET MARKET BY OFFERING (THOUSAND UNITS), 2020-2029
TABLE 31 MEXICO INDUSTRIAL ETHERNET MARKET BY PROTOCOL (USD BILLION), 2020-2029
TABLE 32 MEXICO INDUSTRIAL ETHERNET MARKET BY PROTOCOL (THOUSAND UNITS), 2020-2029
TABLE 33 MEXICO INDUSTRIAL ETHERNET MARKET BY APPLICATION (USD BILLION), 2020-2029
TABLE 34 MEXICO INDUSTRIAL ETHERNET MARKET BY APPLICATION (THOUSAND UNITS), 2020-2029
TABLE 35 REST OF NORTH AMERICA INDUSTRIAL ETHERNET MARKET BY OFFERING (USD BILLION), 2020-2029
TABLE 36 REST OF NORTH AMERICA INDUSTRIAL ETHERNET MARKET BY OFFERING (THOUSAND UNITS), 2020-2029
TABLE 37 REST OF NORTH AMERICA INDUSTRIAL ETHERNET MARKET BY PROTOCOL (USD BILLION), 2020-2029
TABLE 38 REST OF NORTH AMERICA INDUSTRIAL ETHERNET MARKET BY PROTOCOL (THOUSAND UNITS), 2020-2029
TABLE 39 REST OF NORTH AMERICA INDUSTRIAL ETHERNET MARKET BY APPLICATIONN (USD BILLION), 2020-2029
TABLE 40 REST OF NORTH AMERICA INDUSTRIAL ETHERNET MARKET BY APPLICATIONN (THOUSAND UNITS), 2020-2029
TABLE 41 SOUTH AMERICA INDUSTRIAL ETHERNET MARKET BY OFFERING (USD BILLION), 2020-2029
TABLE 42 SOUTH AMERICA INDUSTRIAL ETHERNET MARKET BY OFFERING (THOUSAND UNITS), 2020-2029
TABLE 43 SOUTH AMERICA INDUSTRIAL ETHERNET MARKET BY PROTOCOL (USD BILLION), 2020-2029
TABLE 44 SOUTH AMERICA INDUSTRIAL ETHERNET MARKET BY PROTOCOL (THOUSAND UNITS), 2020-2029
TABLE 45 SOUTH AMERICA INDUSTRIAL ETHERNET MARKET BY APPLICATION (USD BILLION), 2020-2029
TABLE 46 SOUTH AMERICA INDUSTRIAL ETHERNET MARKET BY APPLICATION (THOUSAND UNITS), 2020-2029
TABLE 47 SOUTH AMERICA INDUSTRIAL ETHERNET MARKET BY COUNTRY (USD BILLION), 2020-2029
TABLE 48 SOUTH AMERICA INDUSTRIAL ETHERNET MARKET BY COUNTRY (USD BILLION), 2020-2029
TABLE 49 BRAZIL INDUSTRIAL ETHERNET MARKET BY OFFERING (USD BILLION), 2020-2029
TABLE 50 BRAZIL INDUSTRIAL ETHERNET MARKET BY OFFERING (THOUSAND UNITS), 2020-2029
TABLE 51 BRAZIL INDUSTRIAL ETHERNET MARKET BY PROTOCOL (USD BILLION), 2020-2029
TABLE 52 BRAZIL INDUSTRIAL ETHERNET MARKET BY PROTOCOL (THOUSAND UNITS), 2020-2029
TABLE 53 BRAZIL INDUSTRIAL ETHERNET MARKET BY APPLICATION (USD BILLION), 2020-2029
TABLE 54 BRAZIL INDUSTRIAL ETHERNET MARKET BY APPLICATION (THOUSAND UNITS), 2020-2029
TABLE 55 ARGENTINA INDUSTRIAL ETHERNET MARKET BY OFFERING (USD BILLION), 2020-2029
TABLE 56 ARGENTINA INDUSTRIAL ETHERNET MARKET BY OFFERING (THOUSAND UNITS), 2020-2029
TABLE 57 ARGENTINA INDUSTRIAL ETHERNET MARKET BY PROTOCOL (USD BILLION), 2020-2029
TABLE 58 ARGENTINA INDUSTRIAL ETHERNET MARKET BY PROTOCOL (THOUSAND UNITS), 2020-2029
TABLE 59 ARGENTINA INDUSTRIAL ETHERNET MARKET BY APPLICATION (USD BILLION), 2020-2029
TABLE 60 ARGENTINA INDUSTRIAL ETHERNET MARKET BY APPLICATION (THOUSAND UNITS), 2020-2029
TABLE 61 COLOMBIA INDUSTRIAL ETHERNET MARKET BY OFFERING (USD BILLION), 2020-2029
TABLE 62 COLOMBIA INDUSTRIAL ETHERNET MARKET BY OFFERING (THOUSAND UNITS), 2020-2029
TABLE 63 COLOMBIA INDUSTRIAL ETHERNET MARKET BY PROTOCOL (USD BILLION), 2020-2029
TABLE 64 COLOMBIA INDUSTRIAL ETHERNET MARKET BY PROTOCOL (THOUSAND UNITS), 2020-2029
TABLE 65 COLOMBIA INDUSTRIAL ETHERNET MARKET BY APPLICATION (USD BILLION), 2020-2029
TABLE 66 COLOMBIA INDUSTRIAL ETHERNET MARKET BY APPLICATION (THOUSAND UNITS), 2020-2029
TABLE 67 REST OF SOUTH AMERICA INDUSTRIAL ETHERNET MARKET BY OFFERING (USD BILLION), 2020-2029
TABLE 68 REST OF SOUTH AMERICA INDUSTRIAL ETHERNET MARKET BY OFFERING (THOUSAND UNITS), 2020-2029
TABLE 69 REST OF SOUTH AMERICA INDUSTRIAL ETHERNET MARKET BY PROTOCOL (USD BILLION), 2020-2029
TABLE 70 REST OF SOUTH AMERICA INDUSTRIAL ETHERNET MARKET BY PROTOCOL (THOUSAND UNITS), 2020-2029
TABLE 71 REST OF SOUTH AMERICA INDUSTRIAL ETHERNET MARKET BY APPLICATIONN (USD BILLION), 2020-2029
TABLE 72 REST OF SOUTH AMERICA INDUSTRIAL ETHERNET MARKET BY APPLICATIONN (THOUSAND UNITS), 2020-2029
TABLE 73 ASIA -PACIFIC INDUSTRIAL ETHERNET MARKET BY OFFERING (USD BILLION), 2020-2029
TABLE 74 ASIA -PACIFIC INDUSTRIAL ETHERNET MARKET BY OFFERING (THOUSAND UNITS), 2020-2029
TABLE 75 ASIA -PACIFIC INDUSTRIAL ETHERNET MARKET BY PROTOCOL (USD BILLION), 2020-2029
TABLE 76 ASIA -PACIFIC INDUSTRIAL ETHERNET MARKET BY PROTOCOL (THOUSAND UNITS), 2020-2029
TABLE 77 ASIA -PACIFIC INDUSTRIAL ETHERNET MARKET BY APPLICATION (USD BILLION), 2020-2029
TABLE 78 ASIA -PACIFIC INDUSTRIAL ETHERNET MARKET BY APPLICATION (THOUSAND UNITS), 2020-2029
TABLE 79 ASIA -PACIFIC INDUSTRIAL ETHERNET MARKET BY COUNTRY (USD BILLION), 2020-2029
TABLE 80 ASIA -PACIFIC INDUSTRIAL ETHERNET MARKET BY COUNTRY (THOUSAND UNITS), 2020-2029
TABLE 81 INDIA INDUSTRIAL ETHERNET MARKET BY OFFERING (USD BILLION), 2020-2029
TABLE 82 INDIA INDUSTRIAL ETHERNET MARKET BY OFFERING (THOUSAND UNITS), 2020-2029
TABLE 83 INDIA INDUSTRIAL ETHERNET MARKET BY PROTOCOL (USD BILLION), 2020-2029
TABLE 84 INDIA INDUSTRIAL ETHERNET MARKET BY PROTOCOL (THOUSAND UNITS), 2020-2029
TABLE 85 INDIA INDUSTRIAL ETHERNET MARKET BY APPLICATION (USD BILLION), 2020-2029
TABLE 86 INDIA INDUSTRIAL ETHERNET MARKET BY APPLICATION (THOUSAND UNITS), 2020-2029
TABLE 87 CHINA INDUSTRIAL ETHERNET MARKET BY OFFERING (USD BILLION), 2020-2029
TABLE 88 CHINA INDUSTRIAL ETHERNET MARKET BY OFFERING (THOUSAND UNITS), 2020-2029
TABLE 89 CHINA INDUSTRIAL ETHERNET MARKET BY PROTOCOL (USD BILLION), 2020-2029
TABLE 90 CHINA INDUSTRIAL ETHERNET MARKET BY PROTOCOL (THOUSAND UNITS), 2020-2029
TABLE 91 CHINA INDUSTRIAL ETHERNET MARKET BY APPLICATION (USD BILLION), 2020-2029
TABLE 92 CHINA INDUSTRIAL ETHERNET MARKET BY APPLICATION (THOUSAND UNITS), 2020-2029
TABLE 93 JAPAN INDUSTRIAL ETHERNET MARKET BY OFFERING (USD BILLION), 2020-2029
TABLE 94 JAPAN INDUSTRIAL ETHERNET MARKET BY OFFERING (THOUSAND UNITS), 2020-2029
TABLE 95 JAPAN INDUSTRIAL ETHERNET MARKET BY PROTOCOL (USD BILLION), 2020-2029
TABLE 96 JAPAN INDUSTRIAL ETHERNET MARKET BY PROTOCOL (THOUSAND UNITS), 2020-2029
TABLE 97 JAPAN INDUSTRIAL ETHERNET MARKET BY APPLICATION (USD BILLION), 2020-2029
TABLE 98 JAPAN INDUSTRIAL ETHERNET MARKET BY APPLICATION (THOUSAND UNITS), 2020-2029
TABLE 99 SOUTH KOREA INDUSTRIAL ETHERNET MARKET BY OFFERING (USD BILLION), 2020-2029
TABLE 100 SOUTH KOREA INDUSTRIAL ETHERNET MARKET BY OFFERING (THOUSAND UNITS), 2020-2029
TABLE 101 SOUTH KOREA INDUSTRIAL ETHERNET MARKET BY PROTOCOL (USD BILLION), 2020-2029
TABLE 102 SOUTH KOREA INDUSTRIAL ETHERNET MARKET BY PROTOCOL (THOUSAND UNITS), 2020-2029
TABLE 103 SOUTH KOREA INDUSTRIAL ETHERNET MARKET BY APPLICATION (USD BILLION), 2020-2029
TABLE 104 SOUTH KOREA INDUSTRIAL ETHERNET MARKET BY APPLICATION (THOUSAND UNITS), 2020-2029
TABLE 105 AUSTRALIA INDUSTRIAL ETHERNET MARKET BY OFFERING (USD BILLION), 2020-2029
TABLE 106 AUSTRALIA INDUSTRIAL ETHERNET MARKET BY PROTOCOLBY OFFERING (THOUSAND UNITS), 2020-2029
TABLE 107 AUSTRALIA INDUSTRIAL ETHERNET MARKET BY PROTOCOL (USD BILLION), 2020-2029
TABLE 108 AUSTRALIA INDUSTRIAL ETHERNET MARKET BY PROTOCOL (THOUSAND UNITS), 2020-2029
TABLE 109 AUSTRALIA INDUSTRIAL ETHERNET MARKET BY APPLICATION (USD BILLION), 2020-2029
TABLE 110 AUSTRALIA INDUSTRIAL ETHERNET MARKET BY APPLICATION (THOUSAND UNITS), 2020-2029
TABLE 111 REST OF ASIA PACIFIC INDUSTRIAL ETHERNET MARKET BY OFFERING (USD BILLION), 2020-2029
TABLE 112 REST OF ASIA PACIFIC INDUSTRIAL ETHERNET MARKET BY PROTOCOLBY OFFERING (THOUSAND UNITS), 2020-2029
TABLE 113 REST OF ASIA PACIFIC INDUSTRIAL ETHERNET MARKET BY PROTOCOL (USD BILLION), 2020-2029
TABLE 114 REST OF ASIA PACIFIC INDUSTRIAL ETHERNET MARKET BY PROTOCOL (THOUSAND UNITS), 2020-2029
TABLE 115 REST OF ASIA PACIFIC INDUSTRIAL ETHERNET MARKET BY APPLICATION (USD BILLION), 2020-2029
TABLE 116 REST OF ASIA PACIFIC INDUSTRIAL ETHERNET MARKET BY APPLICATION (THOUSAND UNITS), 2020-2029
TABLE 117 EUROPE INDUSTRIAL ETHERNET MARKET BY OFFERING (USD BILLION), 2020-2029
TABLE 118 EUROPE INDUSTRIAL ETHERNET MARKET BY OFFERING (THOUSAND UNITS), 2020-2029
TABLE 119 EUROPE INDUSTRIAL ETHERNET MARKET BY PROTOCOL (USD BILLION), 2020-2029
TABLE 120 EUROPE INDUSTRIAL ETHERNET MARKET BY PROTOCOL (THOUSAND UNITS), 2020-2029
TABLE 121 EUROPE INDUSTRIAL ETHERNET MARKET BY APPLICATION (USD BILLION), 2020-2029
TABLE 122 EUROPE INDUSTRIAL ETHERNET MARKET BY APPLICATION (THOUSAND UNITS), 2020-2029
TABLE 123 EUROPE INDUSTRIAL ETHERNET MARKET BY COUNTRY (USD BILLION), 2020-2029
TABLE 124 EUROPE INDUSTRIAL ETHERNET MARKET BY COUNTRY (THOUSAND UNITS), 2020-2029
TABLE 125 GERMANY INDUSTRIAL ETHERNET MARKET BY OFFERING (USD BILLION), 2020-2029
TABLE 126 GERMANY INDUSTRIAL ETHERNET MARKET BY OFFERING (THOUSAND UNITS), 2020-2029
TABLE 127 GERMANY INDUSTRIAL ETHERNET MARKET BY PROTOCOL (USD BILLION), 2020-2029
TABLE 128 GERMANY INDUSTRIAL ETHERNET MARKET BY PROTOCOL (THOUSAND UNITS), 2020-2029
TABLE 129 GERMANY INDUSTRIAL ETHERNET MARKET BY APPLICATION (USD BILLION), 2020-2029
TABLE 130 GERMANY INDUSTRIAL ETHERNET MARKET BY APPLICATION (THOUSAND UNITS), 2020-2029
TABLE 131 UK INDUSTRIAL ETHERNET MARKET BY OFFERING (USD BILLION), 2020-2029
TABLE 132 UK INDUSTRIAL ETHERNET MARKET BY OFFERING (THOUSAND UNITS), 2020-2029
TABLE 133 UK INDUSTRIAL ETHERNET MARKET BY PROTOCOL (USD BILLION), 2020-2029
TABLE 134 UK INDUSTRIAL ETHERNET MARKET BY PROTOCOL (THOUSAND UNITS), 2020-2029
TABLE 135 UK INDUSTRIAL ETHERNET MARKET BY APPLICATION (USD BILLION), 2020-2029
TABLE 136 UK INDUSTRIAL ETHERNET MARKET BY APPLICATION (USD BILLION), 2020-2029
TABLE 137 FRANCE INDUSTRIAL ETHERNET MARKET BY OFFERING (USD BILLION), 2020-2029
TABLE 138 FRANCE INDUSTRIAL ETHERNET MARKET BY OFFERING (THOUSAND UNITS), 2020-2029
TABLE 139 FRANCE INDUSTRIAL ETHERNET MARKET BY PROTOCOL (USD BILLION), 2020-2029
TABLE 140 FRANCE INDUSTRIAL ETHERNET MARKET BY PROTOCOL (THOUSAND UNITS), 2020-2029
TABLE 141 FRANCE INDUSTRIAL ETHERNET MARKET BY APPLICATION (USD BILLION), 2020-2029
TABLE 142 FRANCE INDUSTRIAL ETHERNET MARKET BY APPLICATION (THOUSAND UNITS), 2020-2029
TABLE 143 ITALY INDUSTRIAL ETHERNET MARKET BY OFFERING (USD BILLION), 2020-2029
TABLE 144 ITALY INDUSTRIAL ETHERNET MARKET BY OFFERING (THOUSAND UNITS), 2020-2029
TABLE 145 ITALY INDUSTRIAL ETHERNET MARKET BY PROTOCOL (USD BILLION), 2020-2029
TABLE 146 ITALY INDUSTRIAL ETHERNET MARKET BY PROTOCOL (THOUSAND UNITS), 2020-2029
TABLE 147 ITALY INDUSTRIAL ETHERNET MARKET BY APPLICATION (USD BILLION), 2020-2029
TABLE 148 ITALY INDUSTRIAL ETHERNET MARKET BY APPLICATION (THOUSAND UNITS), 2020-2029
TABLE 149 SPAIN INDUSTRIAL ETHERNET MARKET BY OFFERING (USD BILLION), 2020-2029
TABLE 150 SPAIN INDUSTRIAL ETHERNET MARKET BY OFFERING (THOUSAND UNITS), 2020-2029
TABLE 151 SPAIN INDUSTRIAL ETHERNET MARKET BY PROTOCOL (USD BILLION), 2020-2029
TABLE 152 SPAIN INDUSTRIAL ETHERNET MARKET BY PROTOCOL (THOUSAND UNITS), 2020-2029
TABLE 153 SPAIN INDUSTRIAL ETHERNET MARKET BY APPLICATION (USD BILLION), 2020-2029
TABLE 154 SPAIN INDUSTRIAL ETHERNET MARKET BY APPLICATION (THOUSAND UNITS), 2020-2029
TABLE 155 RUSSIA INDUSTRIAL ETHERNET MARKET BY OFFERING (USD BILLION), 2020-2029
TABLE 156 RUSSIA INDUSTRIAL ETHERNET MARKET BY OFFERING (THOUSAND UNITS), 2020-2029
TABLE 157 RUSSIA INDUSTRIAL ETHERNET MARKET BY PROTOCOL (USD BILLION), 2020-2029
TABLE 158 RUSSIA INDUSTRIAL ETHERNET MARKET BY PROTOCOL (THOUSAND UNITS), 2020-2029
TABLE 159 RUSSIA INDUSTRIAL ETHERNET MARKET BY APPLICATION (USD BILLION), 2020-2029
TABLE 160 RUSSIA INDUSTRIAL ETHERNET MARKET BY APPLICATION (THOUSAND UNITS), 2020-2029
TABLE 161 REST OF EUROPE INDUSTRIAL ETHERNET MARKET BY OFFERING (USD BILLION), 2020-2029
TABLE 162 REST OF EUROPE INDUSTRIAL ETHERNET MARKET BY OFFERING (THOUSAND UNITS), 2020-2029
TABLE 163 REST OF EUROPE INDUSTRIAL ETHERNET MARKET BY PROTOCOL (USD BILLION), 2020-2029
TABLE 164 REST OF EUROPE INDUSTRIAL ETHERNET MARKET BY PROTOCOL (THOUSAND UNITS), 2020-2029
TABLE 165 REST OF EUROPE INDUSTRIAL ETHERNET MARKET BY APPLICATIONN (USD BILLION), 2020-2029
TABLE 166 REST OF EUROPE INDUSTRIAL ETHERNET MARKET BY APPLICATIONN (THOUSAND UNITS), 2020-2029
TABLE 167 MIDDLE EAST AND AFRICA INDUSTRIAL ETHERNET MARKET BY OFFERING (USD BILLION), 2020-2029
TABLE 168 MIDDLE EAST AND AFRICA INDUSTRIAL ETHERNET MARKET BY OFFERING (THOUSAND UNITS), 2020-2029
TABLE 169 MIDDLE EAST AND AFRICA INDUSTRIAL ETHERNET MARKET BY PROTOCOL (USD BILLION), 2020-2029
TABLE 170 MIDDLE EAST AND AFRICA INDUSTRIAL ETHERNET MARKET BY PROTOCOL (THOUSAND UNITS), 2020-2029
TABLE 171 MIDDLE EAST AND AFRICA INDUSTRIAL ETHERNET MARKET BY APPLICATION (USD BILLION), 2020-2029
TABLE 172 MIDDLE EAST AND AFRICA INDUSTRIAL ETHERNET MARKET BY APPLICATION (THOUSAND UNITS), 2020-2029
TABLE 173 MIDDLE EAST ABD AFRICA INDUSTRIAL ETHERNET MARKET BY COUNTRY (USD BILLION), 2020-2029
TABLE 174 MIDDLE EAST ABD AFRICA INDUSTRIAL ETHERNET MARKET BY COUNTRY (THOUSAND UNITS), 2020-2029
TABLE 175 UAE INDUSTRIAL ETHERNET MARKET BY OFFERING (USD BILLION), 2020-2029
TABLE 176 UAE INDUSTRIAL ETHERNET MARKET BY OFFERING (THOUSAND UNITS), 2020-2029
TABLE 177 UAE INDUSTRIAL ETHERNET MARKET BY PROTOCOL (USD BILLION), 2020-2029
TABLE 178 UAE INDUSTRIAL ETHERNET MARKET BY PROTOCOL (THOUSAND UNITS), 2020-2029
TABLE 179 UAE INDUSTRIAL ETHERNET MARKET BY APPLICATION (USD BILLION), 2020-2029
TABLE 180 UAE INDUSTRIAL ETHERNET MARKET BY APPLICATION (THOUSAND UNITS), 2020-2029
TABLE 181 SAUDI ARABIA INDUSTRIAL ETHERNET MARKET BY OFFERING (USD BILLION), 2020-2029
TABLE 182 SAUDI ARABIA INDUSTRIAL ETHERNET MARKET BY OFFERING (THOUSAND UNITS), 2020-2029
TABLE 183 SAUDI ARABIA INDUSTRIAL ETHERNET MARKET BY PROTOCOL (USD BILLION), 2020-2029
TABLE 184 SAUDI ARABIA INDUSTRIAL ETHERNET MARKET BY PROTOCOL (THOUSAND UNITS), 2020-2029
TABLE 185 SAUDI ARABIA INDUSTRIAL ETHERNET MARKET BY APPLICATION (USD BILLION), 2020-2029
TABLE 186 SAUDI ARABIA INDUSTRIAL ETHERNET MARKET BY APPLICATION (THOUSAND UNITS), 2020-2029
TABLE 187 SOUTH AFRICA INDUSTRIAL ETHERNET MARKET BY OFFERING (USD BILLION), 2020-2029
TABLE 188 SOUTH AFRICA INDUSTRIAL ETHERNET MARKET BY OFFERING (THOUSAND UNITS), 2020-2029
TABLE 189 SOUTH AFRICA INDUSTRIAL ETHERNET MARKET BY PROTOCOL (USD BILLION), 2020-2029
TABLE 190 SOUTH AFRICA INDUSTRIAL ETHERNET MARKET BY PROTOCOL (THOUSAND UNITS), 2020-2029
TABLE 191 SOUTH AFRICA INDUSTRIAL ETHERNET MARKET BY APPLICATION (USD BILLION), 2020-2029
TABLE 192 SOUTH AFRICA INDUSTRIAL ETHERNET MARKET BY APPLICATION (THOUSAND UNITS), 2020-2029
TABLE 193 REST OF MIDDLE EAST AND AFRICA INDUSTRIAL ETHERNET MARKET BY OFFERING (USD BILLION), 2020-2029
TABLE 194 REST OF MIDDLE EAST AND AFRICA INDUSTRIAL ETHERNET MARKET BY OFFERING (THOUSAND UNITS), 2020-2029
TABLE 195 REST OF MIDDLE EAST AND AFRICA INDUSTRIAL ETHERNET MARKET BY PROTOCOL (USD BILLION), 2020-2029
TABLE 196 REST OF MIDDLE EAST AND AFRICA INDUSTRIAL ETHERNET MARKET BY PROTOCOL (THOUSAND UNITS), 2020-2029
TABLE 197 REST OF MIDDLE EAST AND AFRICA INDUSTRIAL ETHERNET MARKET BY APPLICATION (USD BILLION), 2020-2029
TABLE 198 REST OF MIDDLE EAST AND AFRICA INDUSTRIAL ETHERNET MARKET BY APPLICATION (THOUSAND UNITS), 2020-2029
LIST OF FIGURES
FIGURE 1 MARKET DYNAMICS
FIGURE 2 MARKET SEGMENTATION
FIGURE 3 REPORT TIMELINES: YEARS CONSIDERED
FIGURE 4 DATA TRIANGULATION
FIGURE 5 BOTTOM-UP APPROACH
FIGURE 6 TOP-DOWN APPROACH
FIGURE 7 RESEARCH FLOW
FIGURE 8 GLOBAL INDUSTRIAL ETHERNET MARKET BY OFFERING, USD BILLION, THOUSAND UNITS, 2020-2029
FIGURE 9 GLOBAL INDUSTRIAL ETHERNET MARKET BY FUNCTION, USD BILLION, THOUSAND UNITS, 2020-2029
FIGURE 10 GLOBAL INDUSTRIAL ETHERNET MARKET BY APPLICATION, USD BILLION, THOUSAND UNITS, 2020-2029
FIGURE 11 GLOBAL INDUSTRIAL ETHERNET MARKET BY REGION, USD BILLION, THOUSAND UNITS, 2020-2029
FIGURE 12 PORTER’S FIVE FORCES MODEL
FIGURE 13 GLOBAL INDUSTRIAL ETHERNET MARKET BY OFFERING, USD BILLION, 2021
FIGURE 14 GLOBAL INDUSTRIAL ETHERNET MARKET BY FUNCTION, USD BILLION, 2021
FIGURE 15 GLOBAL INDUSTRIAL ETHERNET MARKET BY APPLICATION, USD BILLION, 2021
FIGURE 16 GLOBAL INDUSTRIAL ETHERNET MARKET BY REGION 2021
FIGURE 17 MARKET SHARE ANALYSIS
FIGURE 18 SIEMENS: COMPANY SNAPSHOT
FIGURE 19 ROCKWELL AUTOMATION: COMPANY SNAPSHOT
FIGURE 20 CISCO SYSTEMS, INC.: COMPANY SNAPSHOT
FIGURE 21 OMRON CORPORATION: COMPANY SNAPSHOT
FIGURE 22 DYNALOG INDIA LTD.: COMPANY SNAPSHOT
FIGURE 23 BELDEN INC.: COMPANY SNAPSHOT
FIGURE 24 HUAWEI TECHNOLOGIES CO., LTD.: COMPANY SNAPSHOT
FIGURE 25 SCHNEIDER ELECTRIC: COMPANY SNAPSHOT
FIGURE 26 ABB: COMPANY SNAPSHOT
FIGURE 27 HONEYWELL INTERNATIONAL INC.: COMPANY SNAPSHOT
DOWNLOAD FREE SAMPLE REPORT
License Type
SPEAK WITH OUR ANALYST
Want to know more about the report or any specific requirement?
WANT TO CUSTOMIZE THE REPORT?
Our Clients Speak
We asked them to research ‘ Equipment market’ all over the world, and their whole arrangement was helpful to us. thehealthanalytics.com insightful analysis and reports contributed to our current analysis and in creating a future strategy. Besides, the te
Yosuke Mitsui
Senior Associate Construction Equipment Sales & Marketing
We asked them to research ‘Equipment market’ all over the world, and their whole arrangement was helpful to us. thehealthanalytics.com insightful analysis and reports contributed to our current analysis and in creating a future strategy. Besides, the te


