

Base Year Value ()
x.x %
x.x %
CAGR ()
x.x %
x.x %
Forecast Year Value ()
x.x %
x.x %
Historical Data Period
Largest Region
Forecast Period
Hyperloop Technology Market by Transportation Type (Tube, Propulsion, Capsule) Carriage (Passenger, Cargo/Freight) Speed (More than 700 kmph, Less than 700 kmph) by Region Global Trends and Forecast from 2022 to 2029
Instant access to hundreds of data points and trends
- Market estimates from 2014-2029
- Competitive analysis, industry segmentation, financial benchmarks
- Incorporates SWOT, Porter's Five Forces and risk management frameworks
- PDF report or online database with Word, Excel and PowerPoint export options
- 100% money back guarantee
Hyperloop Technology Market Overview
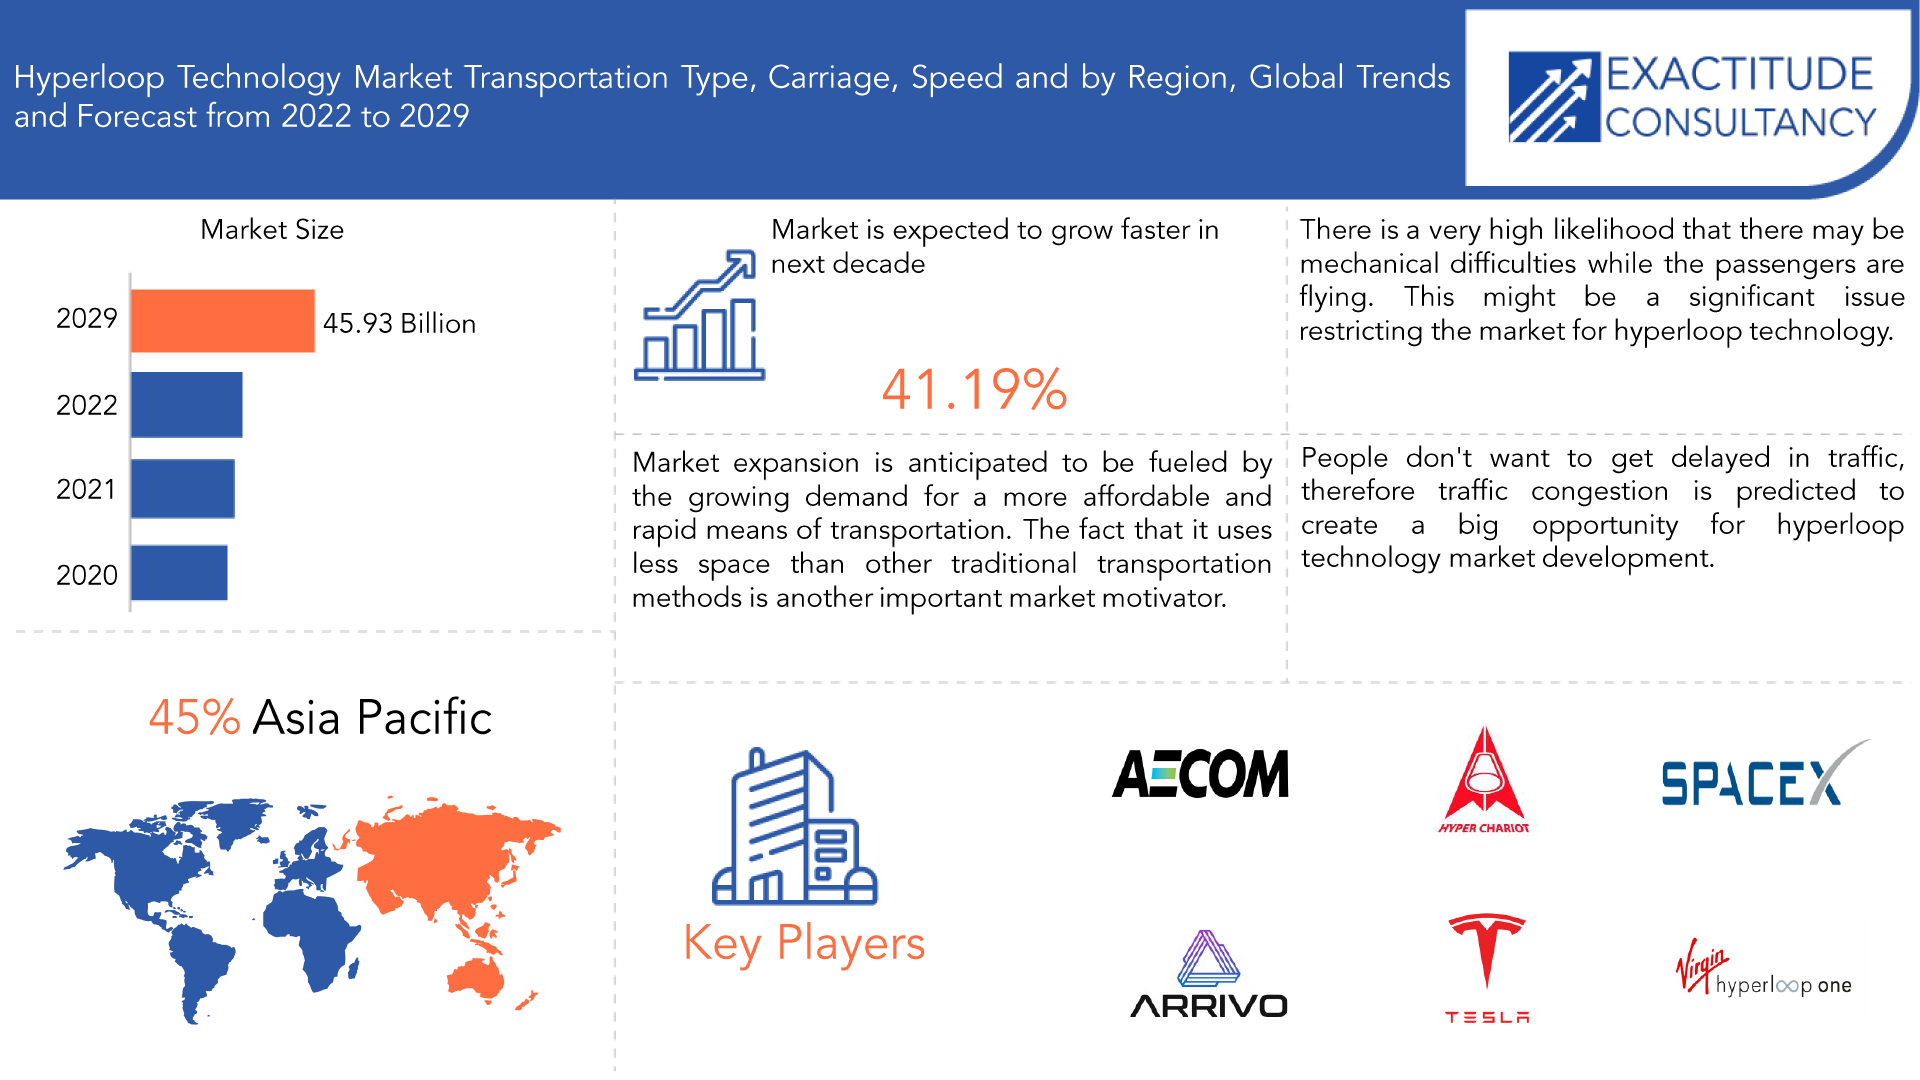
The global hyperloop technology market size was valued at USD 2.06 billion in 2020 and is projected to reach USD 45.93 billion by 2029, with a CAGR of 16.18% from 2022 to 2029.
The hyperloop is a potential future mode of transportation for both people and goods. It consists of a network of tubes or pods that allow airless movement of people and objects, cutting down on the time that people must spend moving overall. Electromagnets let these pods move farther as they float above the railway line within the tubes. It is possible to travel at speeds of up to thousands of miles per hour by using the concept of a vacuum train to minimize external forces that magnetically pull the transportation system out of emptied or partially evacuated tubes. When the pod reaches a glide distance of 100 km, it will begin to run independently.
Quick transportation, improved security and safety, and more effective infrastructure are all advantages of hyperloop technology. The Hyperloop One prototype claims that due to inbuilt environmental controls and localization capabilities, pods will be able to connect with the system controller more successfully. These pods will be able to detect blockages thanks to a network of sensors, enhancing passenger safety. Communication between the motor and the tubes will be aided by real-time data and an auto-braking sensor, resulting in increased system uptime for operations and maintenance. Systems and controls will be equally important to a fully new mode of transportation that is faster and has a more robust network structure as physical improvement in tubes and pods.
| ATTRIBUTE | DETAILS |
| Study period | 2020-2029 |
| Base year | 2021 |
| Estimated year | 2022 |
| Forecasted year | 2022-2029 |
| Historical period | 2018-2020 |
| Unit | Value (USD Billion) |
| Segmentation | By Transportation Type, By Carriage, By Speed, By Region. |
| By Transportation Type |
|
| By Carriage |
|
| By Speed |
|
| By Region |
|
Although hyperloop trains travel at speeds comparable to those of aero planes and bullet trains, they are similarly very inexpensive, which might enhance consumer interest. Hyperloop trains may become one of the most popular transit options for future generations owing to its low cost and lightning-fast speeds, which might change the way that the transportation sector looks. Additionally, the hyperloop technology requires less space than conventional means of transportation and decreases noise and traffic congestion. It is also resistant to earthquakes and other natural calamities since it is constructed on pylons and features high passenger pod tubes.
The security and safety of the passengers is one of the primary concerns for the commercial growth of the hyperloop train. The revolutionary hyperloop train technology enables elevated travel within a tube with little air pressure at rates of up to 650 miles per hour. Contrary to aero planes and bullets, which have historical precedents in the form of regular trains or commercial jets, hyperloop trains have no resemblance to any of the conventional forms of transportation. The hyperloop trains' existence is still in question. The government and many financial investors will have more trust in the technology once the first hyperloop train is operational. Organizations like Virgin Hyperloop One and HTT are now undertaking trials to hasten the development.
The ever-increasing human population is a major factor in the world's traffic jams. Every country in the world struggles with traffic congestion on the roads. Major cities throughout the world, including those in China, Japan, India, the United States, the Netherlands, the United Kingdom, and France, are experiencing severe traffic jams as a result of the daily increase in the number of cars on the road. Relying only on air or ocean transportation is impractical, not to mention unreasonably expensive and time-consuming. As a result, all of these problems might be solved using the hyperloop.
One of the biggest difficulties the hyperloop technology faces is the potential for passenger emergencies in the event of a power loss. The hyperloop must be able to transport users to the closest station in the event of an emergency, such as a human control malfunction or a sudden weather strike, to assure their safety. Windows, doors, and other emergency exits must be included in hyperloop pods and tubes' design. Every capsule should have direct radio communication with the station's operators, enabling users to report issues, ask for assistance, and get on-board support as needed.
Frequently Asked Questions
What is the worth of hyperloop technology market?
The hyperloop technology market is expected to reach USD 5.80 billion by the end of 2023.
What are the upcoming trends of hyperloop technology market globally?
Need for faster and more efficient transportation is the ongoing trend observed.
What is the CAGR of hyperloop technology market?
The global hyperloop technology market size was valued at USD 2.06 billion in 2020, and projected to reach USD 45.93 billion by 2029, with a CAGR of 16.18% from 2022 to 2029.
Which are the top companies to hold the market share in hyperloop technology market?
The global market is fragmented in nature with the presence of various key players such Capgemini Service SAS, Carrier Global Corp., Cisco Systems Inc., Emerson Electric Co., General Electric Co., Honeywell International Inc., Intel Corp., Johnson Controls International Plc., Lennox International Inc., Panasonic Holdings Corp., Robert Bosch GmbH, Schneider Electric SE, Siemens AG
Which is the largest regional market for hyperloop technology market?
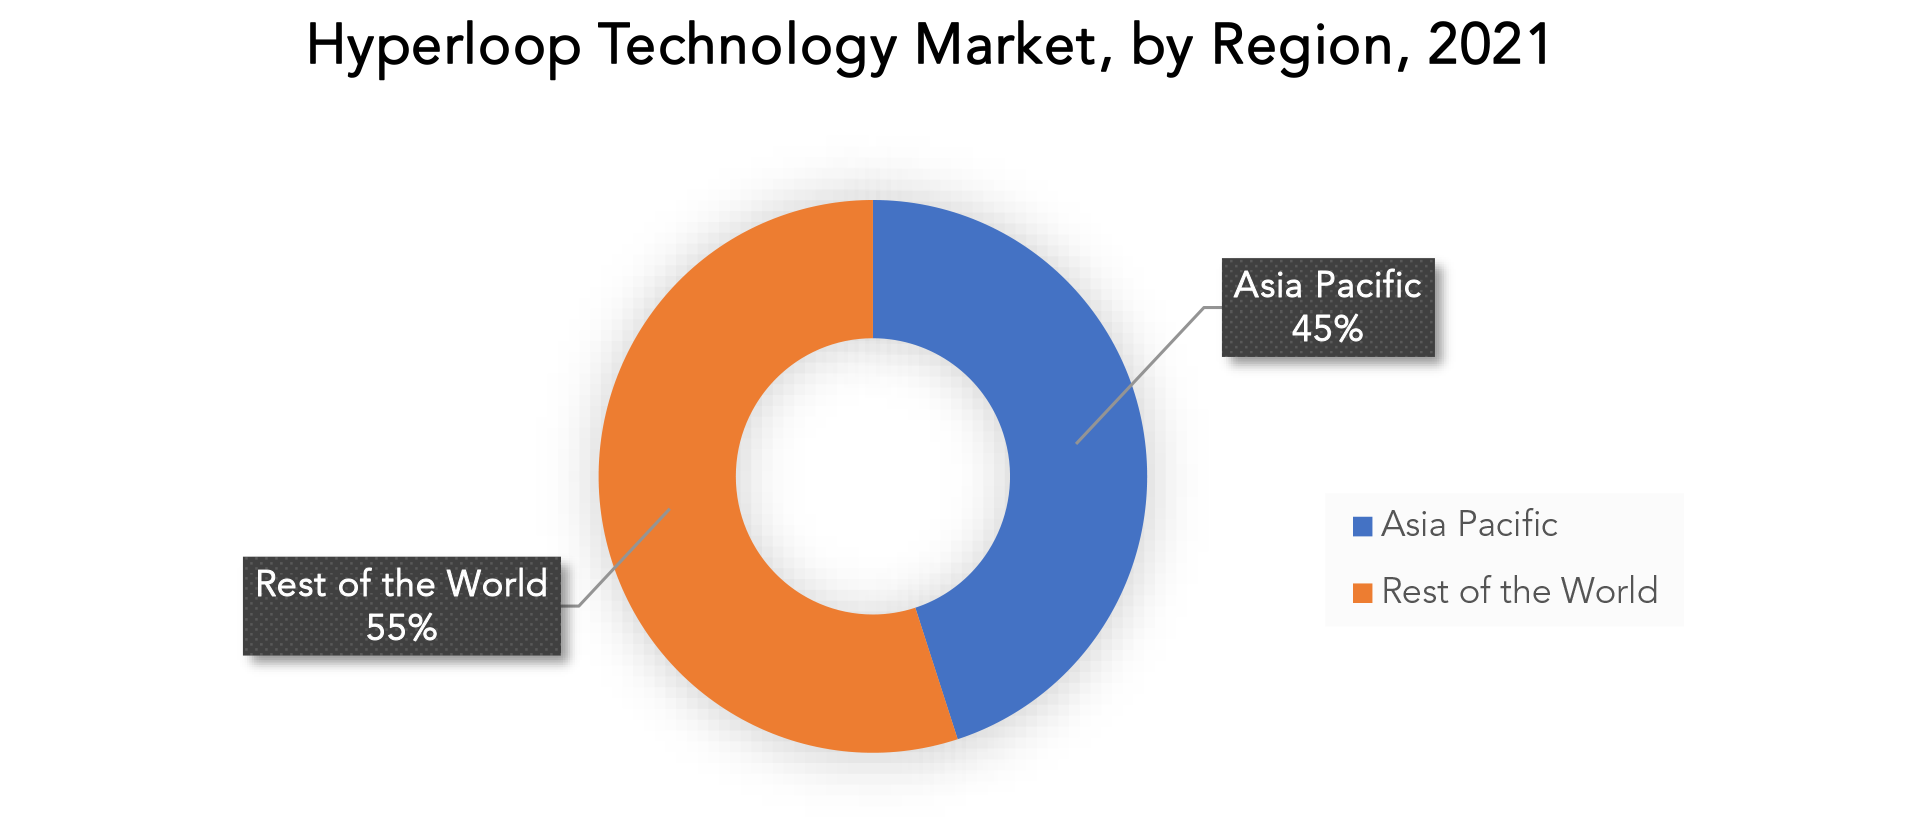
The Asia Pacific dominated the global industry in 2021 and accounted for the maximum share of more than 45% of the overall revenue.
Hyperloop Technology Market Segment Analysis
The market's largest contributor, tubes, are anticipated to expand throughout the projection period. The tube business is expected to grow quickly as solar panels may be mounted on top of tubes to save money and additionally, they offer some earthquake and weather protection when placed on pillars above ground. The market's largest contributor, the passenger sector, is anticipated to expand throughout the projected period. In comparison to the present choices, such as aircraft, trains, and other vehicles, the hyperloop is anticipated to be the fastest and least costly means of transportation. When just people need to be carried, a passenger carriage pod is the best option. According to the plan or prototype, each capsule or pod could travel at up to 1,220 kmph and hold about 40 passengers at once. The worldwide market for hyperloop technology is divided into two categories based on speed: greater than 700 kmph and less than 700 kmph. Given that these systems' average travel speed is anticipated to be 1200 kmph, the more than 700 kmph sector is anticipated to have the fastest revenue increase over the course of the projected year. [caption id="attachment_21821" align="aligncenter" width="1920"]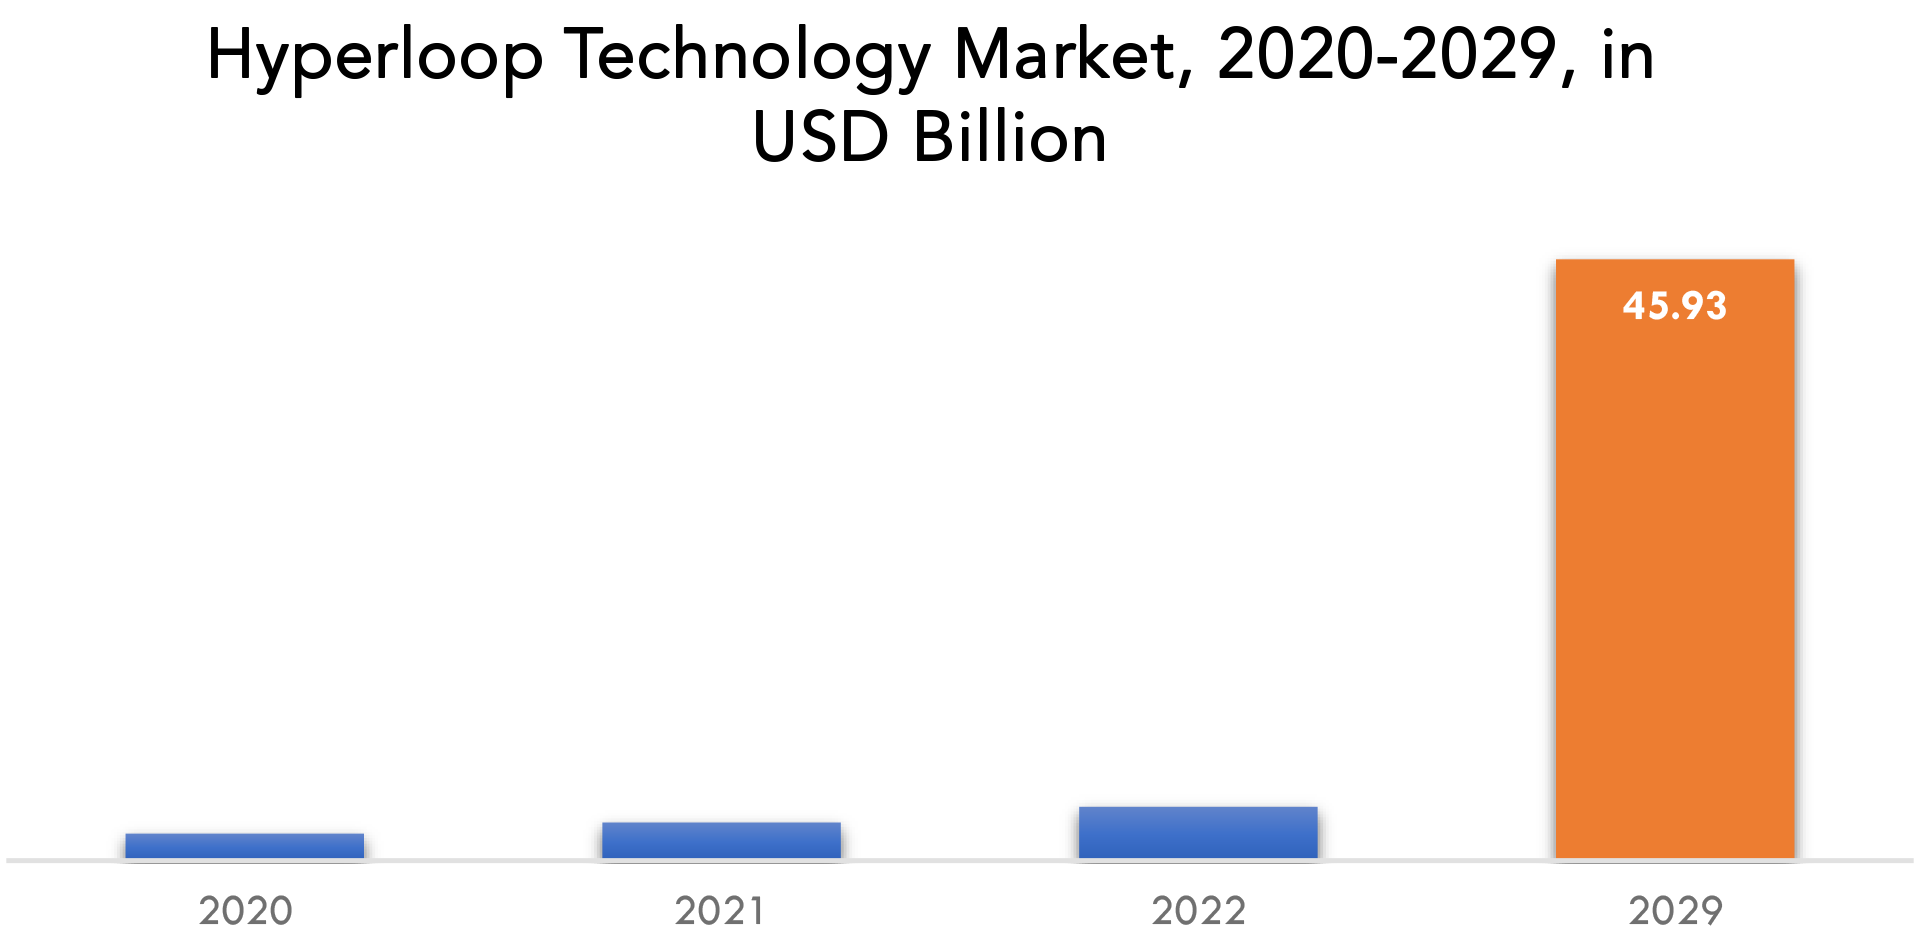
Hyperloop Technology Market Players
The global market is fragmented in nature with the presence of various key players such as Aecom, Dinclix GroundWorks, Hyperloop Transportation Technologies, Space Exploration Technologies Corp., Tesla Inc., Transpord Inc., Uwashington Hyperloop, Vichyper, Virgin Hyperloop One, Hyper Chariot, Arrivo, Hardt Global Mobility, Zeleros Global along with medium and small-scale regional players operating in different parts of the world. Major companies in the market compete in terms of application development capability, product launches, and development of new technologies for product formulation. Industry Developments: April 5, 2023 – A Memorandum of Understanding (MoU) between Hardt Hyperloop and TuTr Hyperloop has already been signed, announcing their strategic alliance. Through this partnership, Europe and India would be able to use compatible hyperloop technology. February 27, 2023 - At the Mobile World Congress in Barcelona, HyperloopTT had debuted its second full-scale capsule fuselage, allowing delegates to get a close-up look at the revolutionary materials, structure, and inside of the capsule.Who Should Buy? Or Key stakeholders
- Hyperloop technology developers
- Governments and regulatory bodies
- Engineering companies
- Research institutions
- Automotive and transportation industries
- Non-governmental organizations
- Manufacturers of hyperloop system
Hyperloop Technology Market Regional Analysis
Geographically, the hyperloop technology market is segmented into North America, South America, Europe, APAC and MEA.- North America: includes the US, Canada, Mexico
- Europe: includes UK, Germany, France, Italy, Spain, Russia, and Rest of Europe
- Asia Pacific: includes China, Japan, South Korea, India, Australia, ASEAN and Rest of APAC
- South America: includes Brazil, Argentina and Rest of South America
- Middle East & Africa: includes Turkey, UAE, Saudi Arabia, South Africa, and Rest of MEA
Key Market Segments: Hyperloop Technology Market
Hyperloop Technology Market by Transportation Type, 2020-2029, (USD Billion)- Tube
- Propulsion
- Capsule
- Passenger
- Cargo/Freight
- More Than 700 Kmph
- Less Than 700 Kmph
- North America
- Europe
- Asia Pacific
- South America
- Middle East and Africa
Key Question Answered
- What is the expected growth rate of the hyperloop technology market over the next 7 years?
- Who are the major players in the hyperloop technology market and what is their market share?
- What are the end-user industries driving demand for market and what is their outlook?
- What are the opportunities for growth in emerging markets such as Asia-Pacific, Middle East, and Africa?
- How is the economic environment affecting the hyperloop technology market, including factors such as interest rates, inflation, and exchange rates?
- What is the expected impact of government policies and regulations on hyperloop technology market?
- What is the current and forecasted size and growth rate of the global hyperloop technology market?
- What are the key drivers of growth in the hyperloop technology market?
- Who are the major players in the market and what is their market share?
- What are the distribution channels and supply chain dynamics in the hyperloop technology market?
- What are the technological advancements and innovations in the hyperloop technology market and their impact on product development and growth?
- What are the regulatory considerations and their impact on the market?
- What are the challenges faced by players in the hyperloop technology market and how are they addressing these challenges?
- What are the opportunities for growth and expansion in the hyperloop technology market?
- What are the service offerings and specifications of leading players in the market?
Exactitude Consultancy Services Key Objectives:
- Increasing sales and market share
- Developing new technology
- Improving profitability
- Entering new markets
- Enhancing brand reputation
- INTRODUCTION
- MARKET DEFINITION
- MARKET SEGMENTATION
- RESEARCH TIMELINES
- ASSUMPTIONS AND LIMITATIONS
- RESEARCH METHODOLOGY
- DATA MINING
- SECONDARY RESEARCH
- PRIMARY RESEARCH
- SUBJECT-MATTER EXPERTS’ ADVICE
- QUALITY CHECKS
- FINAL REVIEW
- DATA TRIANGULATION
- BOTTOM-UP APPROACH
- TOP-DOWN APPROACH
- RESEARCH FLOW
- DATA SOURCES
- DATA MINING
- EXECUTIVE SUMMARY
- MARKET OVERVIEW
- HYPERLOOP TECHNOLOGY MARKET OUTLOOK
- MARKET DRIVERS
- MARKET RESTRAINTS
- MARKET OPPORTUNITIES
- IMPACT OF COVID-19 ON HYPERLOOP TECHNOLOGY MARKET
- PORTER’S FIVE FORCES MODEL
- THREAT FROM NEW ENTRANTS
- THREAT FROM SUBSTITUTES
- BARGAINING POWER OF SUPPLIERS
- BARGAINING POWER OF CUSTOMERS
- DEGREE OF COMPETITION
- INDUSTRY VALUE CHAIN ANALYSIS
- HYPERLOOP TECHNOLOGY MARKET OUTLOOK
- GLOBAL HYPERLOOP TECHNOLOGY MARKET BY TRANSPORTATION TYPE, 2020-2029, (USD BILLION)
- TUBE
- PROPULSION
- CAPSULE
- GLOBAL HYPERLOOP TECHNOLOGY MARKET BY CARRIAGE, 2020-2029, (USD BILLION)
- PASSENGER
- CARGO/FREIGHT
- GLOBAL HYPERLOOP TECHNOLOGY MARKET BY SPEED, 2020-2029, (USD BILLION)
- MORE THAN 700 KMPH
- LESS THAN 700 KMPH
- GLOBAL HYPERLOOP TECHNOLOGY MARKET BY REGION, 2020-2029, (USD BILLION)
- NORTH AMERICA
- US
- CANADA
- MEXICO
- SOUTH AMERICA
- BRAZIL
- ARGENTINA
- COLOMBIA
- REST OF SOUTH AMERICA
- EUROPE
- GERMANY
- UK
- FRANCE
- ITALY
- SPAIN
- RUSSIA
- REST OF EUROPE
- ASIA PACIFIC
- INDIA
- CHINA
- JAPAN
- SOUTH KOREA
- AUSTRALIA
- SOUTH-EAST ASIA
- REST OF ASIA PACIFIC
- MIDDLE EAST AND AFRICA
- UAE
- SAUDI ARABIA
- SOUTH AFRICA
- REST OF MIDDLE EAST AND AFRICA
- NORTH AMERICA
- COMPANY PROFILES* (BUSINESS OVERVIEW, COMPANY SNAPSHOT, PRODUCTS OFFERED, RECENT DEVELOPMENTS)
9.1 CAPGEMINI SERVICE SAS
9.2 CARRIER GLOBAL CORP.
9.3 CISCO SYSTEMS INC.
9.4 EMERSON ELECTRIC CO.
9.5 GENERAL ELECTRIC CO.
9.6 HONEYWELL INTERNATIONAL INC.
9.7 INTEL CORP.
9.8 JOHNSON CONTROLS INTERNATIONAL PLC.
9.9 LENNOX INTERNATIONAL INC.
9.10 PANASONIC HOLDINGS CORP.
9.11 ROBERT BOSCH GMBH
9.12 SCHNEIDER ELECTRIC SE
9.13 SIEMENS AG*THE COMPANY LIST IS INDICATIVE
LIST OF TABLES
TABLE 1 GLOBAL HYPERLOOP CARRIAGE MARKET BY TRANSPORTATION TYPE (USD BILLION) 2020-2029
TABLE 2 GLOBAL HYPERLOOP CARRIAGE MARKET BY CARRIAGE (USD BILLION) 2020-2029
TABLE 3 GLOBAL HYPERLOOP CARRIAGE MARKET BY SPEED (USD BILLION) 2020-2029
TABLE 4 GLOBAL HYPERLOOP CARRIAGE MARKET BY REGIONS (USD BILLION) 2020-2029
TABLE 5 NORTH AMERICA HYPERLOOP CARRIAGE MARKET BY TRANSPORTATION TYPE (USD BILLION) 2020-2029
TABLE 6 NORTH AMERICA HYPERLOOP CARRIAGE MARKET BY CARRIAGE (USD BILLION) 2020-2029
TABLE 7 NORTH AMERICA HYPERLOOP CARRIAGE MARKET BY SPEED (USD BILLION) 2020-2029
TABLE 8 NORTH AMERICA HYPERLOOP CARRIAGE MARKET BY COUNTRY (USD BILLION) 2020-2029
TABLE 9 US HYPERLOOP CARRIAGE MARKET BY TRANSPORTATION TYPE (USD BILLION) 2020-2029
TABLE 10 US HYPERLOOP CARRIAGE MARKET BY CARRIAGE (USD BILLION) 2020-2029
TABLE 11 US HYPERLOOP CARRIAGE MARKET BY SPEED (USD BILLION) 2020-2029
TABLE 12 US HYPERLOOP CARRIAGE MARKET BY REGIONS (USD BILLION) 2020-2029
TABLE 13 CANADA HYPERLOOP CARRIAGE MARKET BY TRANSPORTATION TYPE (USD BILLION) 2020-2029
TABLE 14 CANADA HYPERLOOP CARRIAGE MARKET BY CARRIAGE (USD BILLION) 2020-2029
TABLE 15 CANADA HYPERLOOP CARRIAGE MARKET BY SPEED (USD BILLION) 2020-2029
TABLE 16 CANADA HYPERLOOP CARRIAGE MARKET BY REGIONS (USD BILLION) 2020-2029
TABLE 17 MEXICO HYPERLOOP CARRIAGE MARKET BY TRANSPORTATION TYPE (USD BILLION) 2020-2029
TABLE 18 MEXICO HYPERLOOP CARRIAGE MARKET BY CARRIAGE (USD BILLION) 2020-2029
TABLE 19 MEXICO HYPERLOOP CARRIAGE MARKET BY SPEED (USD BILLION) 2020-2029
TABLE 20 MEXICO HYPERLOOP CARRIAGE MARKET BY REGIONS (USD BILLION) 2020-2029
TABLE 21 SOUTH AMERICA HYPERLOOP CARRIAGE MARKET BY TRANSPORTATION TYPE (USD BILLION) 2020-2029
TABLE 22 SOUTH AMERICA HYPERLOOP CARRIAGE MARKET BY CARRIAGE (USD BILLION) 2020-2029
TABLE 23 SOUTH AMERICA HYPERLOOP CARRIAGE MARKET BY SPEED (USD BILLION) 2020-2029
TABLE 24 SOUTH AMERICA HYPERLOOP CARRIAGE MARKET BY COUNTRY (USD BILLION) 2020-2029
TABLE 25 BRAZIL HYPERLOOP CARRIAGE MARKET BY TRANSPORTATION TYPE (USD BILLION) 2020-2029
TABLE 26 BRAZIL HYPERLOOP CARRIAGE MARKET BY CARRIAGE (USD BILLION) 2020-2029
TABLE 27 BRAZIL HYPERLOOP CARRIAGE MARKET BY SPEED (USD BILLION) 2020-2029
TABLE 28 BRAZIL HYPERLOOP CARRIAGE MARKET BY REGIONS (USD BILLION) 2020-2029
TABLE 29 ARGENTINA HYPERLOOP CARRIAGE MARKET BY TRANSPORTATION TYPE (USD BILLION) 2020-2029
TABLE 30 ARGENTINA HYPERLOOP CARRIAGE MARKET BY CARRIAGE (USD BILLION) 2020-2029
TABLE 31 ARGENTINA HYPERLOOP CARRIAGE MARKET BY SPEED (USD BILLION) 2020-2029
TABLE 32 ARGENTINA HYPERLOOP CARRIAGE MARKET BY REGIONS (USD BILLION) 2020-2029
TABLE 33 COLOMBIA HYPERLOOP CARRIAGE MARKET BY TRANSPORTATION TYPE (USD BILLION) 2020-2029
TABLE 34 COLOMBIA HYPERLOOP CARRIAGE MARKET BY CARRIAGE (USD BILLION) 2020-2029
TABLE 35 COLOMBIA HYPERLOOP CARRIAGE MARKET BY SPEED (USD BILLION) 2020-2029
TABLE 36 COLOMBIA HYPERLOOP CARRIAGE MARKET BY REGIONS (USD BILLION) 2020-2029
TABLE 37 REST OF SOUTH AMERICA HYPERLOOP CARRIAGE MARKET BY TRANSPORTATION TYPE (USD BILLION) 2020-2029
TABLE 38 REST OF SOUTH AMERICA HYPERLOOP CARRIAGE MARKET BY CARRIAGE (USD BILLION) 2020-2029
TABLE 39 REST OF SOUTH AMERICA HYPERLOOP CARRIAGE MARKET BY SPEED (USD BILLION) 2020-2029
TABLE 40 REST OF SOUTH AMERICA HYPERLOOP CARRIAGE MARKET BY REGIONS (USD BILLION) 2020-2029
TABLE 41 ASIA-PACIFIC HYPERLOOP CARRIAGE MARKET BY TRANSPORTATION TYPE (USD BILLION) 2020-2029
TABLE 42 ASIA-PACIFIC HYPERLOOP CARRIAGE MARKET BY CARRIAGE (USD BILLION) 2020-2029
TABLE 43 ASIA-PACIFIC HYPERLOOP CARRIAGE MARKET BY SPEED (USD BILLION) 2020-2029
TABLE 44 ASIA-PACIFIC HYPERLOOP CARRIAGE MARKET BY COUNTRY (USD BILLION) 2020-2029
TABLE 45 INDIA HYPERLOOP CARRIAGE MARKET BY TRANSPORTATION TYPE (USD BILLION) 2020-2029
TABLE 46 INDIA HYPERLOOP CARRIAGE MARKET BY CARRIAGE (USD BILLION) 2020-2029
TABLE 47 INDIA HYPERLOOP CARRIAGE MARKET BY SPEED (USD BILLION) 2020-2029
TABLE 48 INDIA HYPERLOOP CARRIAGE MARKET BY REGIONS (USD BILLION) 2020-2029
TABLE 49 CHINA HYPERLOOP CARRIAGE MARKET BY TRANSPORTATION TYPE (USD BILLION) 2020-2029
TABLE 50 CHINA HYPERLOOP CARRIAGE MARKET BY CARRIAGE (USD BILLION) 2020-2029
TABLE 51 CHINA HYPERLOOP CARRIAGE MARKET BY SPEED (USD BILLION) 2020-2029
TABLE 52 CHINA HYPERLOOP CARRIAGE MARKET BY REGIONS (USD BILLION) 2020-2029
TABLE 53 JAPAN HYPERLOOP CARRIAGE MARKET BY TRANSPORTATION TYPE (USD BILLION) 2020-2029
TABLE 54 JAPAN HYPERLOOP CARRIAGE MARKET BY CARRIAGE (USD BILLION) 2020-2029
TABLE 55 JAPAN HYPERLOOP CARRIAGE MARKET BY SPEED (USD BILLION) 2020-2029
TABLE 56 JAPAN HYPERLOOP CARRIAGE MARKET BY REGIONS (USD BILLION) 2020-2029
TABLE 57 SOUTH KOREA HYPERLOOP CARRIAGE MARKET BY TRANSPORTATION TYPE (USD BILLION) 2020-2029
TABLE 58 SOUTH KOREA HYPERLOOP CARRIAGE MARKET BY CARRIAGE (USD BILLION) 2020-2029
TABLE 59 SOUTH KOREA HYPERLOOP CARRIAGE MARKET BY SPEED (USD BILLION) 2020-2029
TABLE 60 SOUTH KOREA HYPERLOOP CARRIAGE MARKET BY REGIONS (USD BILLION) 2020-2029
TABLE 61 AUSTRALIA HYPERLOOP CARRIAGE MARKET BY TRANSPORTATION TYPE (USD BILLION) 2020-2029
TABLE 62 AUSTRALIA HYPERLOOP CARRIAGE MARKET BY CARRIAGE (USD BILLION) 2020-2029
TABLE 63 AUSTRALIA HYPERLOOP CARRIAGE MARKET BY SPEED (USD BILLION) 2020-2029
TABLE 64 AUSTRALIA HYPERLOOP CARRIAGE MARKET BY REGIONS (USD BILLION) 2020-2029
TABLE 65 SOUTH-EAST ASIA HYPERLOOP CARRIAGE MARKET BY TRANSPORTATION TYPE (USD BILLION) 2020-2029
TABLE 66 SOUTH-EAST ASIA HYPERLOOP CARRIAGE MARKET BY CARRIAGE (USD BILLION) 2020-2029
TABLE 67 SOUTH-EAST ASIA HYPERLOOP CARRIAGE MARKET BY SPEED (USD BILLION) 2020-2029
TABLE 68 SOUTH-EAST ASIA HYPERLOOP CARRIAGE MARKET BY REGIONS (USD BILLION) 2020-2029
TABLE 69 REST OF ASIA PACIFIC HYPERLOOP CARRIAGE MARKET BY TRANSPORTATION TYPE (USD BILLION) 2020-2029
TABLE 70 REST OF ASIA PACIFIC HYPERLOOP CARRIAGE MARKET BY CARRIAGE (USD BILLION) 2020-2029
TABLE 71 REST OF ASIA PACIFIC HYPERLOOP CARRIAGE MARKET BY SPEED (USD BILLION) 2020-2029
TABLE 72 REST OF ASIA PACIFIC HYPERLOOP CARRIAGE MARKET BY REGIONS (USD BILLION) 2020-2029
TABLE 73 EUROPE HYPERLOOP CARRIAGE MARKET BY TRANSPORTATION TYPE (USD BILLION) 2020-2029
TABLE 74 EUROPE HYPERLOOP CARRIAGE MARKET BY CARRIAGE (USD BILLION) 2020-2029
TABLE 75 EUROPE HYPERLOOP CARRIAGE MARKET BY SPEED (USD BILLION) 2020-2029
TABLE 76 EUROPE HYPERLOOP CARRIAGE MARKET BY COUNTRY (USD BILLION) 2020-2029
TABLE 77 GERMANY HYPERLOOP CARRIAGE MARKET BY TRANSPORTATION TYPE (USD BILLION) 2020-2029
TABLE 78 GERMANY HYPERLOOP CARRIAGE MARKET BY CARRIAGE (USD BILLION) 2020-2029
TABLE 79 GERMANY HYPERLOOP CARRIAGE MARKET BY SPEED (USD BILLION) 2020-2029
TABLE 80 GERMANY HYPERLOOP CARRIAGE MARKET BY REGIONS (USD BILLION) 2020-2029
TABLE 81 UK HYPERLOOP CARRIAGE MARKET BY TRANSPORTATION TYPE (USD BILLION) 2020-2029
TABLE 82 UK HYPERLOOP CARRIAGE MARKET BY CARRIAGE (USD BILLION) 2020-2029
TABLE 83 UK HYPERLOOP CARRIAGE MARKET BY SPEED (USD BILLION) 2020-2029
TABLE 84 UK HYPERLOOP CARRIAGE MARKET BY REGIONS (USD BILLION) 2020-2029
TABLE 85 FRANCE HYPERLOOP CARRIAGE MARKET BY TRANSPORTATION TYPE (USD BILLION) 2020-2029
TABLE 86 FRANCE HYPERLOOP CARRIAGE MARKET BY CARRIAGE (USD BILLION) 2020-2029
TABLE 87 FRANCE HYPERLOOP CARRIAGE MARKET BY SPEED (USD BILLION) 2020-2029
TABLE 88 FRANCE HYPERLOOP CARRIAGE MARKET BY REGIONS (USD BILLION) 2020-2029
TABLE 89 ITALY HYPERLOOP CARRIAGE MARKET BY TRANSPORTATION TYPE (USD BILLION) 2020-2029
TABLE 90 ITALY HYPERLOOP CARRIAGE MARKET BY CARRIAGE (USD BILLION) 2020-2029
TABLE 91 ITALY HYPERLOOP CARRIAGE MARKET BY SPEED (USD BILLION) 2020-2029
TABLE 92 ITALY HYPERLOOP CARRIAGE MARKET BY REGIONS (USD BILLION) 2020-2029
TABLE 93 SPAIN HYPERLOOP CARRIAGE MARKET BY TRANSPORTATION TYPE (USD BILLION) 2020-2029
TABLE 94 SPAIN HYPERLOOP CARRIAGE MARKET BY CARRIAGE (USD BILLION) 2020-2029
TABLE 95 SPAIN HYPERLOOP CARRIAGE MARKET BY SPEED (USD BILLION) 2020-2029
TABLE 96 SPAIN HYPERLOOP CARRIAGE MARKET BY REGIONS (USD BILLION) 2020-2029
TABLE 97 RUSSIA HYPERLOOP CARRIAGE MARKET BY TRANSPORTATION TYPE (USD BILLION) 2020-2029
TABLE 98 RUSSIA HYPERLOOP CARRIAGE MARKET BY CARRIAGE (USD BILLION) 2020-2029
TABLE 99 RUSSIA HYPERLOOP CARRIAGE MARKET BY SPEED (USD BILLION) 2020-2029
TABLE 100 RUSSIA HYPERLOOP CARRIAGE MARKET BY REGIONS (USD BILLION) 2020-2029
TABLE 101 REST OF EUROPE HYPERLOOP CARRIAGE MARKET BY TRANSPORTATION TYPE (USD BILLION) 2020-2029
TABLE 102 REST OF EUROPE HYPERLOOP CARRIAGE MARKET BY CARRIAGE (USD BILLION) 2020-2029
TABLE 103 REST OF EUROPE HYPERLOOP CARRIAGE MARKET BY SPEED (USD BILLION) 2020-2029
TABLE 104 REST OF EUROPE HYPERLOOP CARRIAGE MARKET BY REGIONS (USD BILLION) 2020-2029
TABLE 105 MIDDLE EAST AND AFRICA HYPERLOOP CARRIAGE MARKET BY TRANSPORTATION TYPE (USD BILLION) 2020-2029
TABLE 106 MIDDLE EAST AND AFRICA HYPERLOOP CARRIAGE MARKET BY CARRIAGE (USD BILLION) 2020-2029
TABLE 107 MIDDLE EAST AND AFRICA HYPERLOOP CARRIAGE MARKET BY SPEED (USD BILLION) 2020-2029
TABLE 108 MIDDLE EAST AND AFRICA HYPERLOOP CARRIAGE MARKET BY COUNTRY (USD BILLION) 2020-2029
TABLE 109 UAE HYPERLOOP CARRIAGE MARKET BY TRANSPORTATION TYPE (USD BILLION) 2020-2029
TABLE 110 UAE HYPERLOOP CARRIAGE MARKET BY CARRIAGE (USD BILLION) 2020-2029
TABLE 111 UAE HYPERLOOP CARRIAGE MARKET BY SPEED (USD BILLION) 2020-2029
TABLE 112 UAE HYPERLOOP CARRIAGE MARKET BY REGIONS (USD BILLION) 2020-2029
TABLE 113 SAUDI ARABIA HYPERLOOP CARRIAGE MARKET BY TRANSPORTATION TYPE (USD BILLION) 2020-2029
TABLE 114 SAUDI ARABIA HYPERLOOP CARRIAGE MARKET BY CARRIAGE (USD BILLION) 2020-2029
TABLE 115 SAUDI ARABIA HYPERLOOP CARRIAGE MARKET BY SPEED (USD BILLION) 2020-2029
TABLE 116 SAUDI ARABIA HYPERLOOP CARRIAGE MARKET BY REGIONS (USD BILLION) 2020-2029
TABLE 117 SOUTH AFRICA HYPERLOOP CARRIAGE MARKET BY TRANSPORTATION TYPE (USD BILLION) 2020-2029
TABLE 118 SOUTH AFRICA HYPERLOOP CARRIAGE MARKET BY CARRIAGE (USD BILLION) 2020-2029
TABLE 119 SOUTH AFRICA HYPERLOOP CARRIAGE MARKET BY SPEED (USD BILLION) 2020-2029
TABLE 120 SOUTH AFRICA HYPERLOOP CARRIAGE MARKET BY REGIONS (USD BILLION) 2020-2029
TABLE 121 REST OF MIDDLE EAST AND AFRICA HYPERLOOP CARRIAGE MARKET BY TRANSPORTATION TYPE (USD BILLION) 2020-2029
TABLE 122 REST OF MIDDLE EAST AND AFRICA HYPERLOOP CARRIAGE MARKET BY CARRIAGE (USD BILLION) 2020-2029
TABLE 123 REST OF MIDDLE EAST AND AFRICA HYPERLOOP CARRIAGE MARKET BY SPEED (USD BILLION) 2020-2029
TABLE 124 REST OF MIDDLE EAST AND AFRICA HYPERLOOP CARRIAGE MARKET BY REGIONS (USD BILLION) 2020-2029
LIST OF FIGURES
FIGURE 1 MARKET DYNAMICS
FIGURE 2 MARKET SEGMENTATION
FIGURE 3 REPORT TIMELINES: YEARS CONSIDERED
FIGURE 4 DATA TRIANGULATION
FIGURE 5 BOTTOM-UP APPROACH
FIGURE 6 TOP-DOWN APPROACH
FIGURE 7 RESEARCH FLOW
FIGURE 8 GLOBAL HYPERLOOP TECHNOLOGY MARKET BY TRANSPORTATION TYPE (USD BILLION) 2020-2029
FIGURE 9 GLOBAL HYPERLOOP TECHNOLOGY MARKET BY CARRIAGE (USD BILLION) 2020-2029
FIGURE 10 GLOBAL HYPERLOOP TECHNOLOGY MARKET BY SPEED (USD BILLION) 2020-2029
FIGURE 12 GLOBAL HYPERLOOP TECHNOLOGY MARKET BY REGION (USD BILLION) 2020-2029
FIGURE 13 PORTER’S FIVE FORCES MODEL
FIGURE 14 GLOBAL HYPERLOOP TECHNOLOGY MARKET BY TRANSPORTATION TYPE (USD BILLION) 2021
FIGURE 15 GLOBAL HYPERLOOP TECHNOLOGY MARKET BY CARRIAGE (USD BILLION) 2021
FIGURE 16 GLOBAL HYPERLOOP TECHNOLOGY MARKET BY SPEED (USD BILLION) 2021
FIGURE 18 GLOBAL HYPERLOOP TECHNOLOGY MARKET BY REGION (USD BILLION) 2021
FIGURE 19 NORTH AMERICA HYPERLOOP TECHNOLOGY MARKET SNAPSHOT
FIGURE 20 EUROPE HYPERLOOP TECHNOLOGY MARKET SNAPSHOT
FIGURE 21 SOUTH AMERICA HYPERLOOP TECHNOLOGY MARKET SNAPSHOT
FIGURE 22 ASIA PACIFIC HYPERLOOP TECHNOLOGY MARKET SNAPSHOT
FIGURE 23 MIDDLE EAST ASIA AND AFRICA HYPERLOOP TECHNOLOGY MARKET SNAPSHOT
FIGURE 24 MARKET SHARE ANALYSIS
FIGURE 25 AECOM: COMPANY SNAPSHOT
FIGURE 26 DINCLIX GROUNDWORKS: COMPANY SNAPSHOT
FIGURE 27 HYPERLOOP TRANSPORTATION TECHNOLOGIES: COMPANY SNAPSHOT
FIGURE 28 SPACE EXPLORATION TECHNOLOGIES CORP.: COMPANY SNAPSHOT
FIGURE 29 TESLA INC.: COMPANY SNAPSHOT
FIGURE 30 TRANSPORD INC.: COMPANY SNAPSHOT
FIGURE 31 UWASHINGTON HYPERLOOP: COMPANY SNAPSHOT
FIGURE 32 VICHYPER: COMPANY SNAPSHOT
FIGURE 33 VIRGIN HYPERLOOP ONE: COMPANY SNAPSHOT
FIGURE 34 HYPER CHARIOT: COMPANY SNAPSHOT
FIGURE 35 ARRIVO: COMPANY SNAPSHOT
FIGURE 36 HARDT GLOBAL MOBILITY: COMPANY SNAPSHOT
FIGURE 37 ZELEROS GLOBAL: COMPANY SNAPSHOT
DOWNLOAD FREE SAMPLE REPORT
License Type
SPEAK WITH OUR ANALYST
Want to know more about the report or any specific requirement?
WANT TO CUSTOMIZE THE REPORT?
Our Clients Speak
We asked them to research ‘ Equipment market’ all over the world, and their whole arrangement was helpful to us. thehealthanalytics.com insightful analysis and reports contributed to our current analysis and in creating a future strategy. Besides, the te
Yosuke Mitsui
Senior Associate Construction Equipment Sales & Marketing
We asked them to research ‘Equipment market’ all over the world, and their whole arrangement was helpful to us. thehealthanalytics.com insightful analysis and reports contributed to our current analysis and in creating a future strategy. Besides, the te


