

Base Year Value ()
x.x %
x.x %
CAGR ()
x.x %
x.x %
Forecast Year Value ()
x.x %
x.x %
Historical Data Period
Largest Region
Forecast Period
Edge AI Software Market by Component (Solution, Services), Data Source (Video And Image Recognition, Speech Recognition, Bio-Metric Data, Sensor Data, Mobile Data), Industry Vertical (Automotive, Manufacturing, Healthcare, Energy And Utility, Consumer Goods, IT, and Telecom, Others), Application (Autonomous Vehicles, Access Management, Video Surveillance, Remote Monitoring And Predictive Maintenance, Energy Management, Others) And Region, Global Trends And Forecast From 2022 To 2029
Instant access to hundreds of data points and trends
- Market estimates from 2014-2029
- Competitive analysis, industry segmentation, financial benchmarks
- Incorporates SWOT, Porter's Five Forces and risk management frameworks
- PDF report or online database with Word, Excel and PowerPoint export options
- 100% money back guarantee
Edge AI Software Market Overview
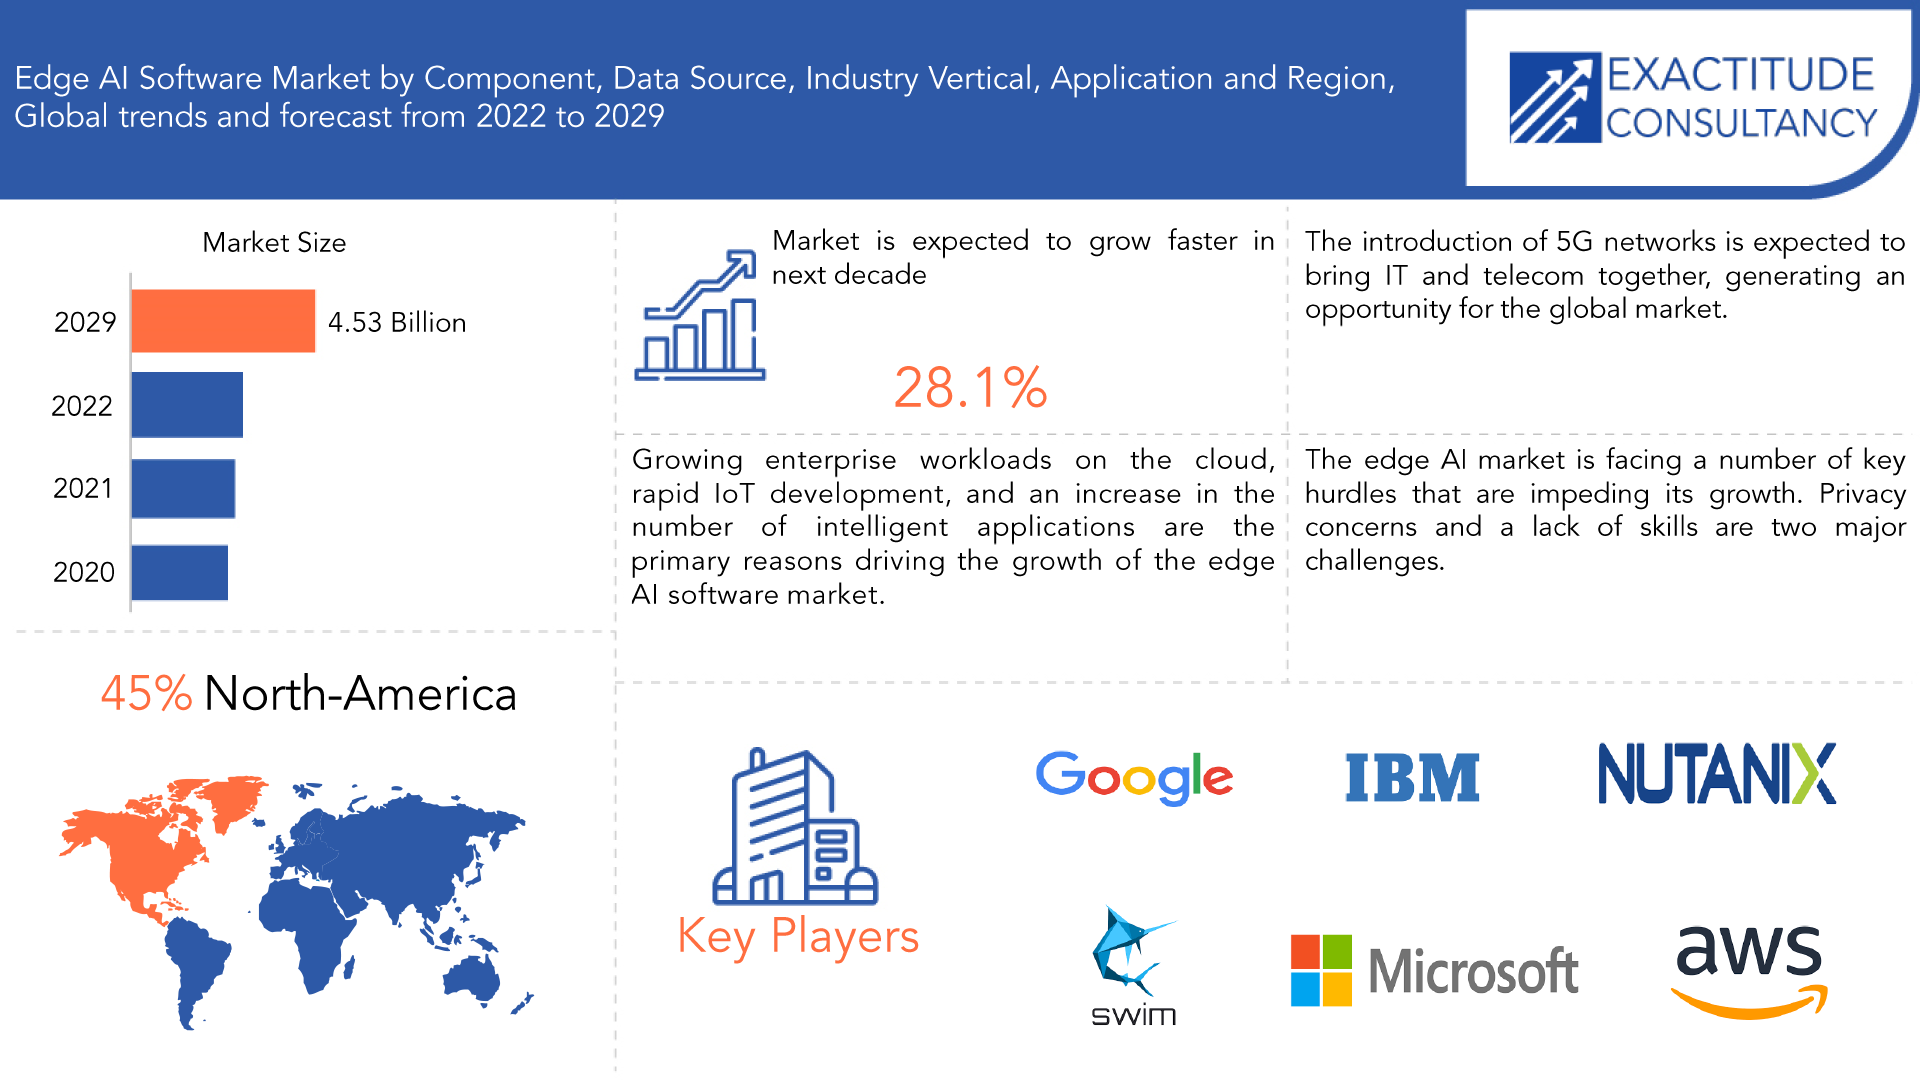
The edge AI software market is expected to grow at 28.1% CAGR from 2022 to 2029. It is expected to reach above USD 4.53 billion by 2029 from USD 0.49 billion in 2020.
Edge AI (Edge artificial intelligence) is a paradigm for designing AI workflows that reach all the way out to the edge of a network from centralized data centers (the cloud). Endpoints, which might even be user devices, are referred to as the edge of a network. The more typical approach, in which AI applications are created and operated wholly on the cloud, is contrasted with edge AI. Some have started to refer to this method as cloud AI. On the other hand, edge computing and artificial intelligence are combined in edge AI. Among other benefits, edge computing places processing and data storage as close as feasible to the point of request in order to provide minimal latency and conserve bandwidth. Building intelligent machines that can carry out tasks that traditionally require human intelligence is the focus of the broad field of artificial intelligence (AI).
The automotive and consumer electronics sectors, which now hold a monopoly on the edge AI industry, have seen a spike in demand for this kind of technology as a result of the use cases made feasible by Edge AI. Self-driving automobiles, video analytics systems, and security cameras are a few examples of products related to these businesses.
The adoption of Edge AI solutions and services is anticipated to be influenced by a number of factors, including rising enterprise workloads on the cloud and the quick development of intelligent apps.
| ATTRIBUTE | DETAILS |
| Study period | 2020-2029 |
| Base year | 2021 |
| Estimated year | 2022 |
| Forecasted year | 2022-2029 |
| Historical period | 2018-2020 |
| Unit | Value (USD BILLION) |
| Segmentation | By component, By data source, By industry vertical, By Application, By Region |
| By Component |
|
| By Data Source |
|
| By Industry Vertical |
|
| By Application |
|
| By Region |
|
Edge AI software is in high demand due to its capacity to provide real-time processing and decision-making, which is critical in today's fast-paced business environment. The increasing number of IoT devices generating massive amounts of data necessitates the use of edge AI software to process the data in real-time. Furthermore, advances in machine learning techniques have enabled AI models to be deployed at the edge, enabling new use cases such as predictive maintenance and anomaly detection. This has increased demand for edge AI software.
The projection period is expected to be hampered by ethical issues, privacy concerns, and a shortage of skilled personnel. Privacy concerns are a significant barrier to the adoption of edge AI technologies. There is a risk that sensitive information will be compromised as data is processed and analyzed at the network's edge. This is especially true in high-stakes areas like healthcare and finance. Several firms are hesitant to employ edge AI technologies due to concerns about data privacy and security.
The edge AI industry provides numerous opportunities for organizations and industries in a variety of areas. The capacity to process and analyses data in real time at the network's edge provides a number of advantages, including increased efficiency, reduced latency, and speedier decision-making. Edge AI also enables new applications such as self-driving cars, predictive maintenance, and anomaly detection.
Just-in-time supply chain operations are one of the primary industries impacted by COVID-19 in the worldwide market. All manufacturing enterprises are having difficulty procuring the ingredients required to manufacture items, as well as shipping their products to retailers and distributors. COVID-19, unlike other disruptions, affects every area of supply networks.
[caption id="attachment_21838" align="aligncenter" width="1920"]
Frequently Asked Questions
• What is the expected CAGR in terms of revenue for the global edge AI software market over the forecast period (2020–2029)?
The global edge AI software market revenue is projected to expand at a CAGR of 28.1% during the forecast period.
• What was the global edge AI software market valued at in 2020?
The global edge AI software market was valued at USD 0.49 Billion in 2020.
• Who are the key players in the edge AI software market?
Some key players operating in IBM, Google, Gorilla Technology Group, Synaptics Incorporated, Microsoft, Amazon Web Services Inc., Nutanix, TIBCO Software Inc., Octonion SA, SWIM.AI Inc., Imagimob AB, Anagog Ltd.
• Which region held the largest market share in the edge AI software market?
North America had the largest share of the global edge AI software market.
• Which is the key factor driving the market growth?
The rising demand for autonomous vehicles and robotics drives market growth.
• Which is the leading industry vertical segment in the market?
Manufacturing holds the largest share of the market in the industry vertical segment.
Edge AI Software Market Segment Analysis
The edge AI software market is segmented based on component, data source, industry vertical, application and region.
By component the market is bifurcated into solution and service; by data source the market is bifurcated into video and image recognition, bio0metric data, sensor data, mobile data; by industry vertical the market is bifurcated into automotive, manufacturing, healthcare, energy and utility, consumer goods, IT and telecom, others; by application the market is bifurcated into autonomous vehicles, access management, video management, video surveillance, remote monitoring and predictive maintenance, energy management, others.
In 2021, the Solutions category had the largest market share. Edge AI software solutions assist businesses in automating administrative tasks, increasing output, and reducing costs. The services provided by Edge AI software solutions, which include both integrated and standalone solutions, also include system integration and testing, support, and maintenance.
The sub-segment for video and image recognition is expected to increase significantly based on data source. The USD 214 million video and image recognition sub segment is expected to develop at a CAGR of 28.1% over the estimated timeframe. The sub-segment market is expected to be driven by the use of video and image data sources for suspect identification in AI-accelerated systems effectively for analyzing and processing of videos and images in various locations throughout the forecast period.
Due to the growing use of this technology in automated production operations, the manufacturing sector now maintains the biggest market share for edge AI. This method of automating the assembly line in factories is becoming increasingly popular.
In the anticipated time, the automotive sub-segment is expected to have the biggest market share. In the anticipated period, the sub-segment market is expected to grow due to the widespread use of edge AI software in the automotive sectors for a variety of purposes, including the production of autonomous vehicles, the development of sustainable transportation, and the production of automotive parts.
[caption id="attachment_21841" align="aligncenter" width="1920"]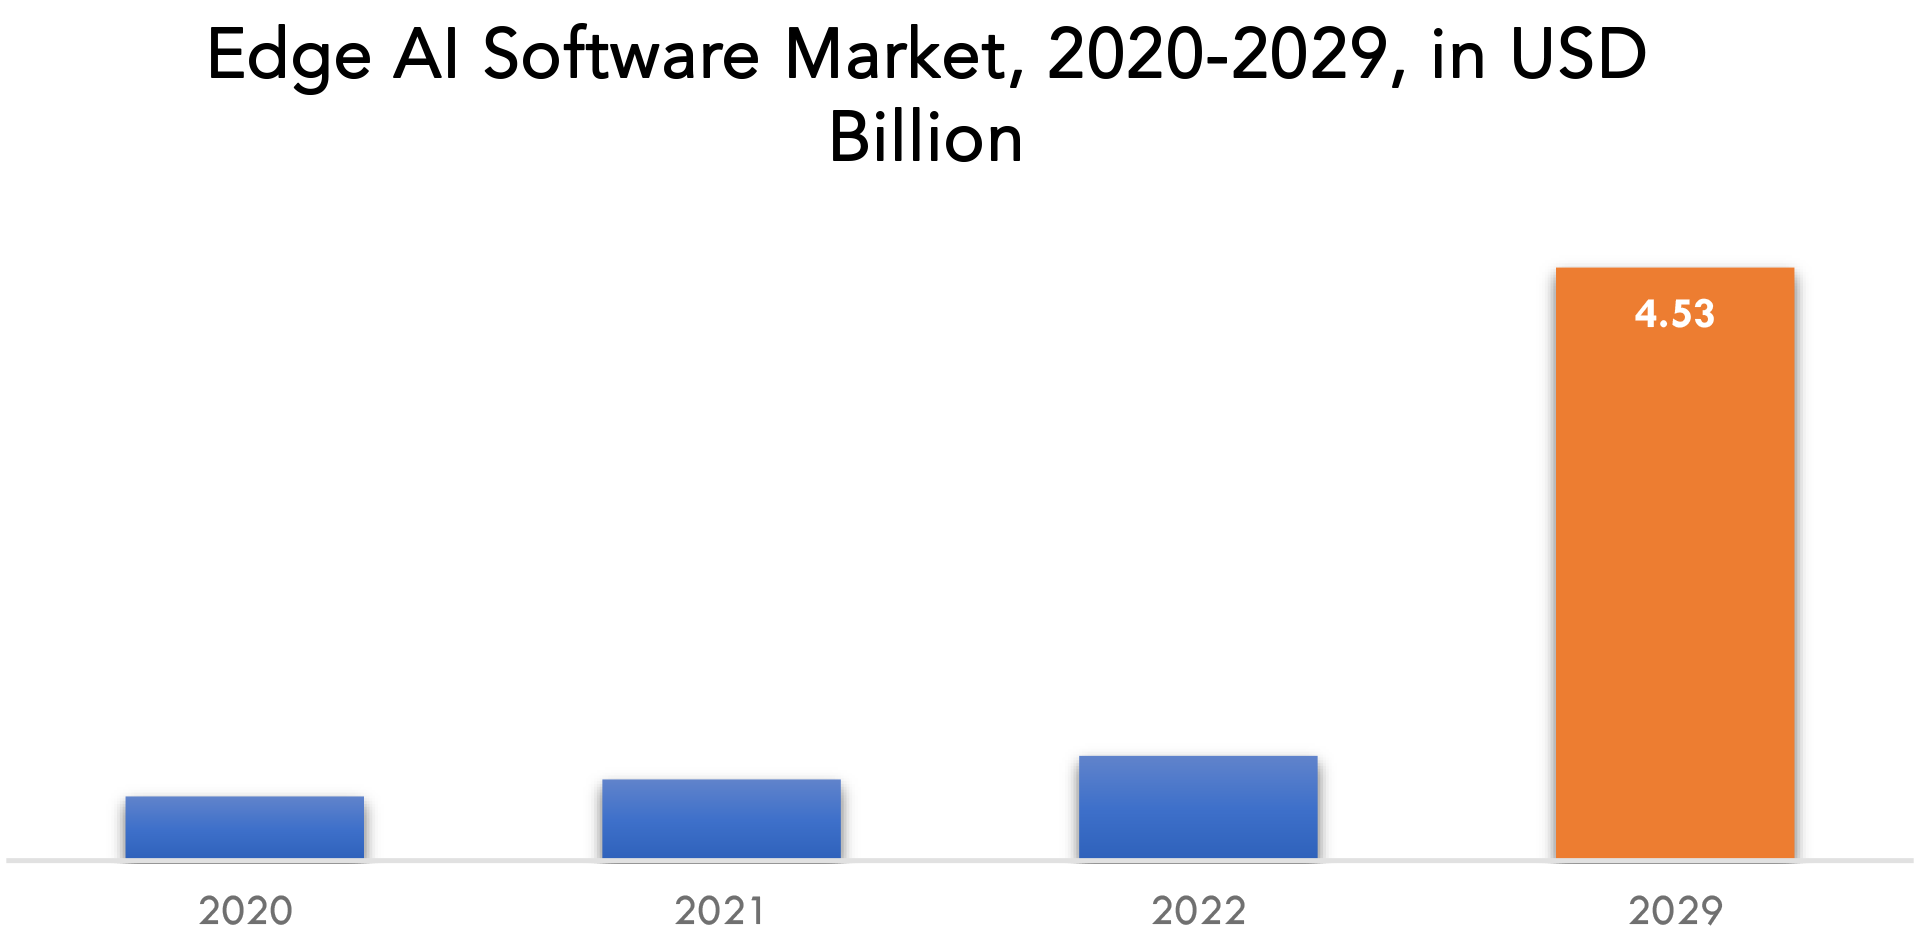
Edge AI Software Market Key Players
The edge AI software market key players include IBM, Google, Gorilla Technology Group, Synaptics Incorporated, Microsoft, Amazon Web Services Inc., Nutanix, TIBCO Software Inc., Octonion SA, SWIM.AI Inc., Imagimob AB, Anagog Ltd., and others.
Recent developments
- 29 March 2023: IBM and Wasabi Technologies, the hot cloud storage company, announced their collaboration to drive data innovation across hybrid cloud environments.
- 12 October 2022: Nutanix a leader in hybrid multicloud computing, announced the general availability of Nutanix Cloud Clusters (NC2) on Microsoft Azure, extending its hybrid cloud environment to Microsoft Azure dedicated bare metal nodes.
Who Should Buy? Or Key Stakeholders
- Investors
- Suppliers and distributors
- Manufacturing Companies
- End-users companies
- Research Organizations
- Regulatory Authorities
- Scientific Research & Development
- Others
Edge AI Software Market Regional Analysis
The edge AI software market by region includes North America, Asia-Pacific (APAC), Europe, South America, and Middle East & Africa (MEA).
- North America: includes the US, Canada, Mexico, and Rest of North America
- Asia Pacific: includes China, Japan, South Korea, India, Australia, and Rest of APAC
- Europe: includes UK, Germany, France, Italy, Spain, Russia, and Rest of Europe
- South America: includes Brazil, Argentina, Colombia and Rest of South America
- Middle East & Africa: includes UAE, South Africa, Saudi Arabia, Israel and Rest of MEA
North America is one of the most enthusiastic users of edge AI software among all regions. The United States and Canada are the leading countries contributing to the growth of the edge AI software market. Businesses in this region, particularly in the United States, have reaped the benefits of AI, machine learning, and deep learning technologies to stay competitive. Advances in AI-powered Internet of Things (IoT) for intelligent systems and smart applications, as well as the usage of edge AI computing in the 5G network, which provides better data control, lower costs, faster insights, and continuous operation, are driving the market.
During the projection period, Asia-Pacific is expected to be the fastest-growing regional market. The region is increasing rapidly due to a variety of factors, including expanding local businesses and government programmes geared at AI development. Due to the rising demand for these solutions in the manufacturing, automotive, energy & utility, and other industries in the United Kingdom, Germany, France, and Italy, Europe is expected to hold a sizeable market share.
[caption id="attachment_21843" align="aligncenter" width="1920"]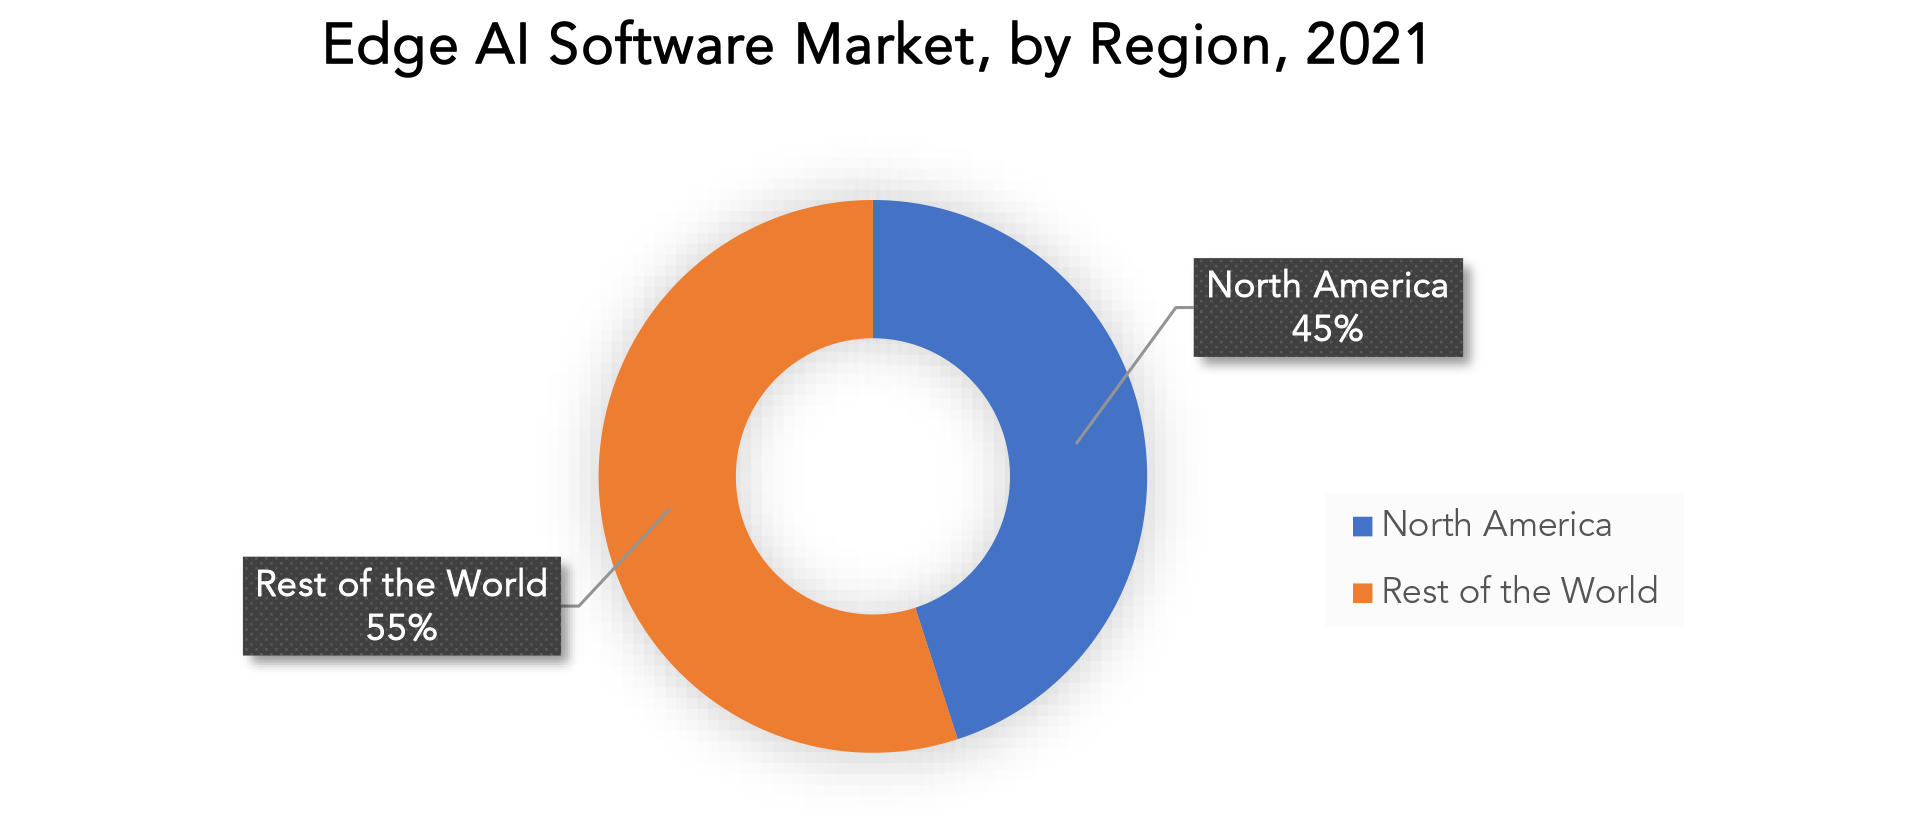
Key Market Segments: Edge AI Software Market
Edge Ai Software Market by Component, 2020-2029, (USD Billion)- Solution
- Services
- Video And Image Recognition
- Speech Recognition
- Bio-Metric Data
- Sensor Data
- Mobile Data
- Automotive
- Manufacturing
- Healthcare
- Energy And Utility
- Consumer Goods
- It And Telecom
- Others
- Autonomous Vehicles
- Access Management
- Video Surveillance
- Remote Monitoring And Predictive Maintenance
- Energy Management
- Others
- North America
- Asia Pacific
- Europe
- South America
- Middle East And Africa
Key Question Answered
- What is the expected growth rate of the edge AI software market over the next 7 years?
- Who are the major players in the edge AI software market and what is their market share?
- What are the end-user industries driving demand for market and what is their outlook?
- What are the opportunities for growth in emerging markets such as Asia-pacific, Middle East, and Africa?
- How is the economic environment affecting the edge AI software market, including factors such as interest rates, inflation, and exchange rates?
- What is the expected impact of government policies and regulations on the edge AI software market?
- What is the current and forecasted size and growth rate of the global edge AI software market?
- What are the key drivers of growth in the edge AI software market?
- Who are the major players in the market and what is their market share?
- What are the distribution channels and supply chain dynamics in the edge AI software market?
- What are the technological advancements and innovations in the edge AI software market and their impact on product development and growth?
- What are the regulatory considerations and their impact on the market?
- What are the challenges faced by players in the edge AI software market and how are they addressing these challenges?
- What are the opportunities for growth and expansion in the edge AI software market?
- What are the service offerings and specifications of leading players in the market?
Exactitude Consultancy Services Key Objectives
- Increasing sales and market share
- Developing new technology
- Improving profitability
- Entering new markets
- Enhancing brand reputation
- INTRODUCTION
- MARKET DEFINITION
- MARKET SEGMENTATION
- RESEARCH TIMELINES
- ASSUMPTIONS AND LIMITATIONS
- RESEARCH METHODOLOGY
- DATA MINING
- SECONDARY RESEARCH
- PRIMARY RESEARCH
- SUBJECT-MATTER EXPERTS’ ADVICE
- QUALITY CHECKS
- FINAL REVIEW
- DATA TRIANGULATION
- BOTTOM-UP APPROACH
- TOP-DOWN APPROACH
- RESEARCH FLOW
- DATA SOURCES
- DATA MINING
- EXECUTIVE SUMMARY
- MARKET OVERVIEW
- GLOBAL EDGE AI SOFTWARE MARKET OUTLOOK
- MARKET DRIVERS
- MARKET RESTRAINTS
- MARKET OPPORTUNITIES
- IMPACT OF COVID-19 ON EDGE AI SOFTWARE MARKET
- PORTER’S FIVE FORCES MODEL
- THREAT FROM NEW ENTRANTS
- THREAT FROM SUBSTITUTES
- BARGAINING POWER OF SUPPLIERS
- BARGAINING POWER OF CUSTOMERS
- DEGREE OF COMPETITION
- INDUSTRY VALUE CHAIN ANALYSIS
- GLOBAL EDGE AI SOFTWARE MARKET OUTLOOK
- GLOBAL EDGE AI SOFTWARE MARKET BY COMPONENT (USD BILLION), 2020-2029
- SOLUTION
- SERVICES
- GLOBAL EDGE AI SOFTWARE MARKET BY DATA SOURCE (USD BILLION), 2020-2029
- VIDEO AND IMAGE RECOGNITION
- SPEECH RECOGNITION
- BIO-METRIC DATA
- SENSOR DATA
- MOBILE DATA
- GLOBAL EDGE AI SOFTWARE MARKET BY INDUSTRY VERTICAL (USD BILLION), 2020-2029
- AUTOMOTIVE
- MANUFACTURING
- HEALTHCARE
- ENERGY AND UTILITY
- CONSUMER GOODS
- IT AND TELECOM
- OTHERS
- GLOBAL EDGE AI SOFTWARE MARKET BY APPLICATION (USD BILLION), 2020-2029
- AUTONOMOUS VEHICLES
- ACCESS MANAGEMENT
- VIDEO SURVEILLANCE
- REMOTE MONITORING AND PREDICTIVE MAINTENANCE
- ENERGY MANAGEMENT
- OTHERS
- GLOBAL EDGE AI SOFTWARE MARKET BY REGION (USD BILLION), 2020-2029
- NORTH AMERICA
- US
- CANADA
- MEXICO
- SOUTH AMERICA
- BRAZIL
- ARGENTINA
- COLOMBIA
- REST OF SOUTH AMERICA
- EUROPE
- GERMANY
- UK
- FRANCE
- ITALY
- SPAIN
- RUSSIA
- REST OF EUROPE
- ASIA PACIFIC
- INDIA
- CHINA
- JAPAN
- SOUTH KOREA
- AUSTRALIA
- REST OF ASIA PACIFIC
- MIDDLE EAST AND AFRICA
- UAE
- SOUTH AFRICA
- SAUDI ARABIA
- REST OF MIDDLE EAST AND AFRICA
- NORTH AMERICA
- COMPANY PROFILES* (BUSINESS OVERVIEW, COMPANY SNAPSHOT, PRODUCTS OFFERED, RECENT DEVELOPMENTS)
- IBM
- GORILLA TECHNOLOGY GROUP
- SYNAPTICS INCORPORATED
- MICROSOFT
- AMAZON WEB SERVICES INC.
- NUTANIX
- TIBCO SOFTWARE INC
- OCTONION SA
- AI INC.
- IMAGIMOB AB
- ANAGOG LTD.*THE COMPANY LIST IS INDICATIVE
LIST OF TABLES
TABLE 1 GLOBAL EDGE AI SOFTWARE MARKET BY COMPONENT (USD BILLION), 2020-2029
TABLE 2 GLOBAL EDGE AI SOFTWARE MARKET BY DATA SOURCE (USD BILLION), 2020-2029
TABLE 3 GLOBAL EDGE AI SOFTWARE MARKET BY INDUSTRY VERTICAL (USD BILLION), 2020-2029
TABLE 4 GLOBAL EDGE AI SOFTWARE MARKET BY APPLICATION (USD BILLION), 2020-2029
TABLE 5 GLOBAL EDGE AI SOFTWARE MARKET BY REGION (USD BILLION), 2020-2029
TABLE 6 NORTH AMERICA EDGE AI SOFTWARE MARKET BY COMPONENT (USD BILLION), 2020-2029
TABLE 7 NORTH AMERICA EDGE AI SOFTWARE MARKET BY DATA SOURCE (USD BILLION), 2020-2029
TABLE 8 NORTH AMERICA EDGE AI SOFTWARE MARKET BY INDUSTRY VERTICAL (USD BILLION), 2020-2029
TABLE 9 NORTH AMERICA EDGE AI SOFTWARE MARKET BY APPLICATION (USD BILLION), 2020-2029
TABLE 10 NORTH AMERICA EDGE AI SOFTWARE MARKET BY COUNTRY (USD BILLION), 2020-2029
TABLE 11 US EDGE AI SOFTWARE MARKET BY COMPONENT (USD BILLION), 2020-2029
TABLE 12 US EDGE AI SOFTWARE MARKET BY DATA SOURCE (USD BILLION), 2020-2029
TABLE 13 US EDGE AI SOFTWARE MARKET BY INDUSTRY VERTICAL (USD BILLION), 2020-2029
TABLE 14 US EDGE AI SOFTWARE MARKET BY APPLICATION (USD BILLION), 2020-2029
TABLE 15 CANADA EDGE AI SOFTWARE MARKET BY COMPONENT (BILLION), 2020-2029
TABLE 16 CANADA EDGE AI SOFTWARE MARKET BY DATA SOURCE (USD BILLION), 2020-2029
TABLE 17 CANADA EDGE AI SOFTWARE MARKET BY INDUSTRY VERTICAL (USD BILLION), 2020-2029
TABLE 18 CANADA EDGE AI SOFTWARE MARKET BY APPLICATION (USD BILLION), 2020-2029
TABLE 19 MEXICO EDGE AI SOFTWARE MARKET BY COMPONENT (USD BILLION), 2020-2029
TABLE 20 MEXICO EDGE AI SOFTWARE MARKET BY DATA SOURCE (USD BILLION), 2020-2029
TABLE 21 MEXICO EDGE AI SOFTWARE MARKET BY INDUSTRY VERTICAL (USD BILLION), 2020-2029
TABLE 22 MEXICO EDGE AI SOFTWARE MARKET BY APPLICATION (USD BILLION), 2020-2029
TABLE 23 REST OF NORTH AMERICA EDGE AI SOFTWARE MARKET BY COMPONENT (USD BILLION), 2020-2029
TABLE 24 REST OF NORTH AMERICA EDGE AI SOFTWARE MARKET BY DATA SOURCE (USD BILLION), 2020-2029
TABLE 25 REST OF NORTH AMERICA EDGE AI SOFTWARE MARKET BY INDUSTRY VERTICAL (USD BILLION), 2020-2029
TABLE 26 REST OF NORTH AMERICA EDGE AI SOFTWARE MARKET BY APPLICATION (USD BILLION), 2020-2029
TABLE 27 SOUTH AMERICA EDGE AI SOFTWARE MARKET BY COMPONENT (USD BILLION), 2020-2029
TABLE 28 SOUTH AMERICA EDGE AI SOFTWARE MARKET BY DATA SOURCE (USD BILLION), 2020-2029
TABLE 29 SOUTH AMERICA EDGE AI SOFTWARE MARKET BY INDUSTRY VERTICAL (USD BILLION), 2020-2029
TABLE 30 SOUTH AMERICA EDGE AI SOFTWARE MARKET BY APPLICATION (USD BILLION), 2020-2029
TABLE 31 SOUTH AMERICA EDGE AI SOFTWARE MARKET BY COUNTRY (USD BILLION), 2020-2029
TABLE 32 BRAZIL EDGE AI SOFTWARE MARKET BY COMPONENT (USD BILLION), 2020-2029
TABLE 33 BRAZIL EDGE AI SOFTWARE MARKET BY DATA SOURCE (USD BILLION), 2020-2029
TABLE 34 BRAZIL EDGE AI SOFTWARE MARKET BY INDUSTRY VERTICAL (USD BILLION), 2020-2029
TABLE 35 BRAZIL EDGE AI SOFTWARE MARKET BY APPLICATION (USD BILLION), 2020-2029
TABLE 36 ARGENTINA EDGE AI SOFTWARE MARKET BY COMPONENT (USD BILLION), 2020-2029
TABLE 37 ARGENTINA EDGE AI SOFTWARE MARKET BY DATA SOURCE (USD BILLION), 2020-2029
TABLE 38 ARGENTINA EDGE AI SOFTWARE MARKET BY INDUSTRY VERTICAL (USD BILLION), 2020-2029
TABLE 39 ARGENTINA EDGE AI SOFTWARE MARKET BY APPLICATION (USD BILLION), 2020-2029
TABLE 40 COLOMBIA EDGE AI SOFTWARE MARKET BY COMPONENT (USD BILLION), 2020-2029
TABLE 41 COLOMBIA EDGE AI SOFTWARE MARKET BY DATA SOURCE (USD BILLION), 2020-2029
TABLE 42 COLOMBIA EDGE AI SOFTWARE MARKET BY INDUSTRY VERTICAL (USD BILLION), 2020-2029
TABLE 43 COLOMBIA EDGE AI SOFTWARE MARKET BY APPLICATION (USD BILLION), 2020-2029
TABLE 44 REST OF SOUTH AMERICA EDGE AI SOFTWARE MARKET BY COMPONENT (USD BILLION), 2020-2029
TABLE 45 REST OF SOUTH AMERICA EDGE AI SOFTWARE MARKET BY DATA SOURCE (USD BILLION), 2020-2029
TABLE 46 REST OF SOUTH AMERICA EDGE AI SOFTWARE MARKET BY INDUSTRY VERTICAL (USD BILLION), 2020-2029
TABLE 47 REST OF SOUTH AMERICA EDGE AI SOFTWARE MARKET BY APPLICATION (USD BILLION), 2020-2029
TABLE 48 ASIA -PACIFIC EDGE AI SOFTWARE MARKET BY COMPONENT (USD BILLION), 2020-2029
TABLE 49 ASIA -PACIFIC EDGE AI SOFTWARE MARKET BY DATA SOURCE (USD BILLION), 2020-2029
TABLE 50 ASIA -PACIFIC EDGE AI SOFTWARE MARKET BY INDUSTRY VERTICAL (USD BILLION), 2020-2029
TABLE 51 ASIA -PACIFIC EDGE AI SOFTWARE MARKET BY APPLICATION (USD BILLION), 2020-2029
TABLE 52 ASIA -PACIFIC EDGE AI SOFTWARE MARKET BY COUNTRY (USD BILLION), 2020-2029
TABLE 53 INDIA EDGE AI SOFTWARE MARKET BY COMPONENT (USD BILLION), 2020-2029
TABLE 54 INDIA EDGE AI SOFTWARE MARKET BY DATA SOURCE (USD BILLION), 2020-2029
TABLE 55 INDIA EDGE AI SOFTWARE MARKET BY INDUSTRY VERTICAL (USD BILLION), 2020-2029
TABLE 56 INDIA EDGE AI SOFTWARE MARKET BY APPLICATION (USD BILLION), 2020-2029
TABLE 57 CHINA EDGE AI SOFTWARE MARKET BY COMPONENT (USD BILLION), 2020-2029
TABLE 58 CHINA EDGE AI SOFTWARE MARKET BY DATA SOURCE (USD BILLION), 2020-2029
TABLE 59 CHINA EDGE AI SOFTWARE MARKET BY INDUSTRY VERTICAL (USD BILLION), 2020-2029
TABLE 60 CHINA EDGE AI SOFTWARE MARKET BY APPLICATION (USD BILLION), 2020-2029
TABLE 61 JAPAN EDGE AI SOFTWARE MARKET BY COMPONENT (USD BILLION), 2020-2029
TABLE 62 JAPAN EDGE AI SOFTWARE MARKET BY DATA SOURCE (USD BILLION), 2020-2029
TABLE 63 JAPAN EDGE AI SOFTWARE MARKET BY INDUSTRY VERTICAL (USD BILLION), 2020-2029
TABLE 64 JAPAN EDGE AI SOFTWARE MARKET BY APPLICATION (USD BILLION), 2020-2029
TABLE 65 SOUTH KOREA EDGE AI SOFTWARE MARKET BY COMPONENT (USD BILLION), 2020-2029
TABLE 66 SOUTH KOREA EDGE AI SOFTWARE MARKET BY DATA SOURCE (USD BILLION), 2020-2029
TABLE 67 SOUTH KOREA EDGE AI SOFTWARE MARKET BY INDUSTRY VERTICAL (USD BILLION), 2020-2029
TABLE 68 SOUTH KOREA EDGE AI SOFTWARE MARKET BY APPLICATION (USD BILLION), 2020-2029
TABLE 69 AUSTRALIA EDGE AI SOFTWARE MARKET BY COMPONENT (USD BILLION), 2020-2029
TABLE 70 AUSTRALIA HYBRID TRANSPLANT TYPEBY DATA SOURCE (USD BILLION), 2020-2029
TABLE 71 AUSTRALIA EDGE AI SOFTWARE MARKET BY INDUSTRY VERTICAL (USD BILLION), 2020-2029
TABLE 72 AUSTRALIA EDGE AI SOFTWARE MARKET BY APPLICATION (USD BILLION), 2020-2029
TABLE 73 REST OF ASIA PACIFIC EDGE AI SOFTWARE MARKET BY COMPONENT (USD BILLION), 2020-2029
TABLE 74 REST OF ASIA PACIFIC HYBRID TRANSPLANT TYPEBY DATA SOURCE (USD BILLION), 2020-2029
TABLE 75 REST OF ASIA PACIFIC EDGE AI SOFTWARE MARKET BY INDUSTRY VERTICAL (USD BILLION), 2020-2029
TABLE 76 REST OF ASIA PACIFIC EDGE AI SOFTWARE MARKET BY APPLICATION (USD BILLION), 2020-2029
TABLE 77 EUROPE EDGE AI SOFTWARE MARKET BY COMPONENT (USD BILLION), 2020-2029
TABLE 78 EUROPE EDGE AI SOFTWARE MARKET BY DATA SOURCE (USD BILLION), 2020-2029
TABLE 79 EUROPE EDGE AI SOFTWARE MARKET BY INDUSTRY VERTICAL (USD BILLION), 2020-2029
TABLE 80 EUROPE EDGE AI SOFTWARE MARKET BY APPLICATION (USD BILLION), 2020-2029
TABLE 81 EUROPE EDGE AI SOFTWARE MARKET BY COUNTRY (USD BILLION), 2020-2029
TABLE 82 GERMANY EDGE AI SOFTWARE MARKET BY COMPONENT (USD BILLION), 2020-2029
TABLE 83 GERMANY EDGE AI SOFTWARE MARKET BY DATA SOURCE (USD BILLION), 2020-2029
TABLE 84 GERMANY EDGE AI SOFTWARE MARKET BY INDUSTRY VERTICAL (USD BILLION), 2020-2029
TABLE 85 GERMANY EDGE AI SOFTWARE MARKET BY APPLICATION (USD BILLION), 2020-2029
TABLE 86 UK EDGE AI SOFTWARE MARKET BY COMPONENT (USD BILLION), 2020-2029
TABLE 87 UK EDGE AI SOFTWARE MARKET BY DATA SOURCE (USD BILLION), 2020-2029
TABLE 88 UK EDGE AI SOFTWARE MARKET BY INDUSTRY VERTICAL (USD BILLION), 2020-2029
TABLE 89 UK EDGE AI SOFTWARE MARKET BY APPLICATION (USD BILLION), 2020-2029
TABLE 90 FRANCE EDGE AI SOFTWARE MARKET BY COMPONENT (USD BILLION), 2020-2029
TABLE 91 FRANCE EDGE AI SOFTWARE MARKET BY DATA SOURCE (USD BILLION), 2020-2029
TABLE 92 FRANCE EDGE AI SOFTWARE MARKET BY INDUSTRY VERTICAL (USD BILLION), 2020-2029
TABLE 93 FRANCE EDGE AI SOFTWARE MARKET BY APPLICATION (USD BILLION), 2020-2029
TABLE 94 ITALY EDGE AI SOFTWARE MARKET BY COMPONENT (USD BILLION), 2020-2029
TABLE 95 ITALY EDGE AI SOFTWARE MARKET BY DATA SOURCE (USD BILLION), 2020-2029
TABLE 96 ITALY EDGE AI SOFTWARE MARKET BY INDUSTRY VERTICAL (USD BILLION), 2020-2029
TABLE 97 ITALY EDGE AI SOFTWARE MARKET BY APPLICATION (USD BILLION), 2020-2029
TABLE 98 SPAIN EDGE AI SOFTWARE MARKET BY COMPONENT (USD BILLION), 2020-2029
TABLE 99 SPAIN EDGE AI SOFTWARE MARKET BY DATA SOURCE (USD BILLION), 2020-2029
TABLE 100 SPAIN EDGE AI SOFTWARE MARKET BY INDUSTRY VERTICAL (USD BILLION), 2020-2029
TABLE 101 SPAIN EDGE AI SOFTWARE MARKET BY APPLICATION (USD BILLION), 2020-2029
TABLE 102 RUSSIA EDGE AI SOFTWARE MARKET BY COMPONENT (USD BILLION), 2020-2029
TABLE 103 RUSSIA EDGE AI SOFTWARE MARKET BY DATA SOURCE (USD BILLION), 2020-2029
TABLE 104 RUSSIA EDGE AI SOFTWARE MARKET BY INDUSTRY VERTICAL (USD BILLION), 2020-2029
TABLE 105 RUSSIA EDGE AI SOFTWARE MARKET BY APPLICATION (USD BILLION), 2020-2029
TABLE 106 REST OF EUROPE EDGE AI SOFTWARE MARKET BY COMPONENT (USD BILLION), 2020-2029
TABLE 107 REST OF EUROPE EDGE AI SOFTWARE MARKET BY DATA SOURCE (USD BILLION), 2020-2029
TABLE 108 REST OF EUROPE EDGE AI SOFTWARE MARKET BY INDUSTRY VERTICAL (USD BILLION), 2020-2029
TABLE 109 REST OF EUROPE EDGE AI SOFTWARE MARKET BY APPLICATION (USD BILLION), 2020-2029
TABLE 110 MIDDLE EAST AND AFRICA EDGE AI SOFTWARE MARKET BY COMPONENT (USD BILLION), 2020-2029
TABLE 111 MIDDLE EAST AND AFRICA EDGE AI SOFTWARE MARKET BY DATA SOURCE (USD BILLION), 2020-2029
TABLE 112 MIDDLE EAST AND AFRICA EDGE AI SOFTWARE MARKET BY INDUSTRY VERTICAL (USD BILLION), 2020-2029
TABLE 113 MIDDLE EAST AND AFRICA EDGE AI SOFTWARE MARKET BY APPLICATION (USD BILLION), 2020-2029
TABLE 114 MIDDLE EAST ABD AFRICA EDGE AI SOFTWARE MARKET BY COUNTRY (USD BILLION), 2020-2029
TABLE 115 UAE EDGE AI SOFTWARE MARKET BY COMPONENT (USD BILLION), 2020-2029
TABLE 116 UAE EDGE AI SOFTWARE MARKET BY DATA SOURCE (USD BILLION), 2020-2029
TABLE 117 UAE EDGE AI SOFTWARE MARKET BY INDUSTRY VERTICAL (USD BILLION), 2020-2029
TABLE 118 UAE EDGE AI SOFTWARE MARKET BY APPLICATION (USD BILLION), 2020-2029
TABLE 119 SAUDI ARABIA EDGE AI SOFTWARE MARKET BY COMPONENT (USD BILLION), 2020-2029
TABLE 120 SAUDI ARABIA EDGE AI SOFTWARE MARKET BY DATA SOURCE (USD BILLION), 2020-2029
TABLE 121 SAUDI ARABIA EDGE AI SOFTWARE MARKET BY INDUSTRY VERTICAL (USD BILLION), 2020-2029
TABLE 122 SAUDI ARABIA EDGE AI SOFTWARE MARKET BY APPLICATION (USD BILLION), 2020-2029
TABLE 123 SOUTH AFRICA EDGE AI SOFTWARE MARKET BY COMPONENT (USD BILLION), 2020-2029
TABLE 124 SOUTH AFRICA EDGE AI SOFTWARE MARKET BY DATA SOURCE (USD BILLION), 2020-2029
TABLE 125 SOUTH AFRICA EDGE AI SOFTWARE MARKET BY INDUSTRY VERTICAL (USD BILLION), 2020-2029
TABLE 126 SOUTH AFRICA EDGE AI SOFTWARE MARKET BY APPLICATION (USD BILLION), 2020-2029
TABLE 127 REST OF MIDDLE EAST AND AFRICA EDGE AI SOFTWARE MARKET BY COMPONENT (USD BILLION), 2020-2029
TABLE 128 REST OF MIDDLE EAST AND AFRICA EDGE AI SOFTWARE MARKET BY DATA SOURCE (USD BILLION), 2020-2029
TABLE 129 REST OF MIDDLE EAST AND AFRICA EDGE AI SOFTWARE MARKET BY INDUSTRY VERTICAL (USD BILLION), 2020-2029
TABLE 130 REST OF MIDDLE EAST AND AFRICA EDGE AI SOFTWARE MARKET BY APPLICATION (USD BILLION), 2020-2029
LIST OF FIGURES
FIGURE 1 MARKET DYNAMICS
FIGURE 2 MARKET SEGMENTATION
FIGURE 3 REPORT TIMELINES: YEARS CONSIDERED
FIGURE 4 DATA TRIANGULATION
FIGURE 5 BOTTOM-UP APPROACH
FIGURE 6 TOP-DOWN APPROACH
FIGURE 7 RESEARCH FLOW
FIGURE 8 GLOBAL EDGE AI SOFTWARE MARKET BY COMPONENT, USD BILLION, 2020-2029
FIGURE 9 GLOBAL EDGE AI SOFTWARE MARKET BY DATA SOURCE, USD BILLION, 2020-2029
FIGURE 10 GLOBAL EDGE AI SOFTWARE MARKET BY INDUSTRY VERTICAL, USD BILLION, 2020-2029
FIGURE 11 GLOBAL EDGE AI SOFTWARE MARKET BY APPLICATION, USD BILLION, 2020-2029
FIGURE 12 GLOBAL EDGE AI SOFTWARE MARKET BY REGION, USD BILLION, 2020-2029
FIGURE 13 PORTER’S FIVE FORCES MODEL
FIGURE 14 EDGE AI SOFTWARE MARKET BY COMPONENT, USD BILLION, 2021
FIGURE 15 EDGE AI SOFTWARE MARKET BY DATA SOURCE, USD BILLION, 2021
FIGURE 16 EDGE AI SOFTWARE MARKET BY INDUSTRY VERTICAL, USD BILLION, 2021
FIGURE 17 EDGE AI SOFTWARE MARKET BY APPLICATION, USD BILLION, 2021
FIGURE 18 EDGE AI SOFTWARE MARKET BY REGION, USD BILLION, 2021
FIGURE 19 MARKET SHARE ANALYSIS
FIGURE 20 IBM: COMPANY SNAPSHOT
FIGURE 21 GOOGLE: COMPANY SNAPSHOT
FIGURE 22 GORILLA TECHNOLOGY GROUP: COMPANY SNAPSHOT
FIGURE 23 SYNAPTICS INCORPORATED: COMPANY SNAPSHOT
FIGURE 24 MICROSOFT: COMPANY SNAPSHOT
FIGURE 25 AMAZON WEB SERVICES INC.: COMPANY SNAPSHOT
FIGURE 26 NUTANIX: COMPANY SNAPSHOT
FIGURE 27 TIBCO SOFTWARE INC: COMPANY SNAPSHOT
FIGURE 28 OCTONION SA: COMPANY SNAPSHOT
FIGURE 29 SWIM.AI INC.: COMPANY SNAPSHOT
FIGURE 30 IMAGIMOB AB: COMPANY SNAPSHOT
FIGURE 31 ANAGOG LTD.: COMPANY SNAPSHOT
DOWNLOAD FREE SAMPLE REPORT
License Type
SPEAK WITH OUR ANALYST
Want to know more about the report or any specific requirement?
WANT TO CUSTOMIZE THE REPORT?
Our Clients Speak
We asked them to research ‘ Equipment market’ all over the world, and their whole arrangement was helpful to us. thehealthanalytics.com insightful analysis and reports contributed to our current analysis and in creating a future strategy. Besides, the te
Yosuke Mitsui
Senior Associate Construction Equipment Sales & Marketing
We asked them to research ‘Equipment market’ all over the world, and their whole arrangement was helpful to us. thehealthanalytics.com insightful analysis and reports contributed to our current analysis and in creating a future strategy. Besides, the te


