

Base Year Value ()
x.x %
x.x %
CAGR ()
x.x %
x.x %
Forecast Year Value ()
x.x %
x.x %
Historical Data Period
Largest Region
Forecast Period
Global Microgrid as a Service (MaaS) Market by Grid Type (Grid Connected, Remote/Islanded), by Service (Engineering & Design, SAAS, Monitoring & Control, Operation & Maintenance), by Vertical (Government & Education, Industrial, Military, Residential & Commercial, Utility), and by Region, Global trends and forecast from 2022 to 2029
Instant access to hundreds of data points and trends
- Market estimates from 2014-2029
- Competitive analysis, industry segmentation, financial benchmarks
- Incorporates SWOT, Porter's Five Forces and risk management frameworks
- PDF report or online database with Word, Excel and PowerPoint export options
- 100% money back guarantee
Global Microgrid as a Service (MaaS) Market Overview
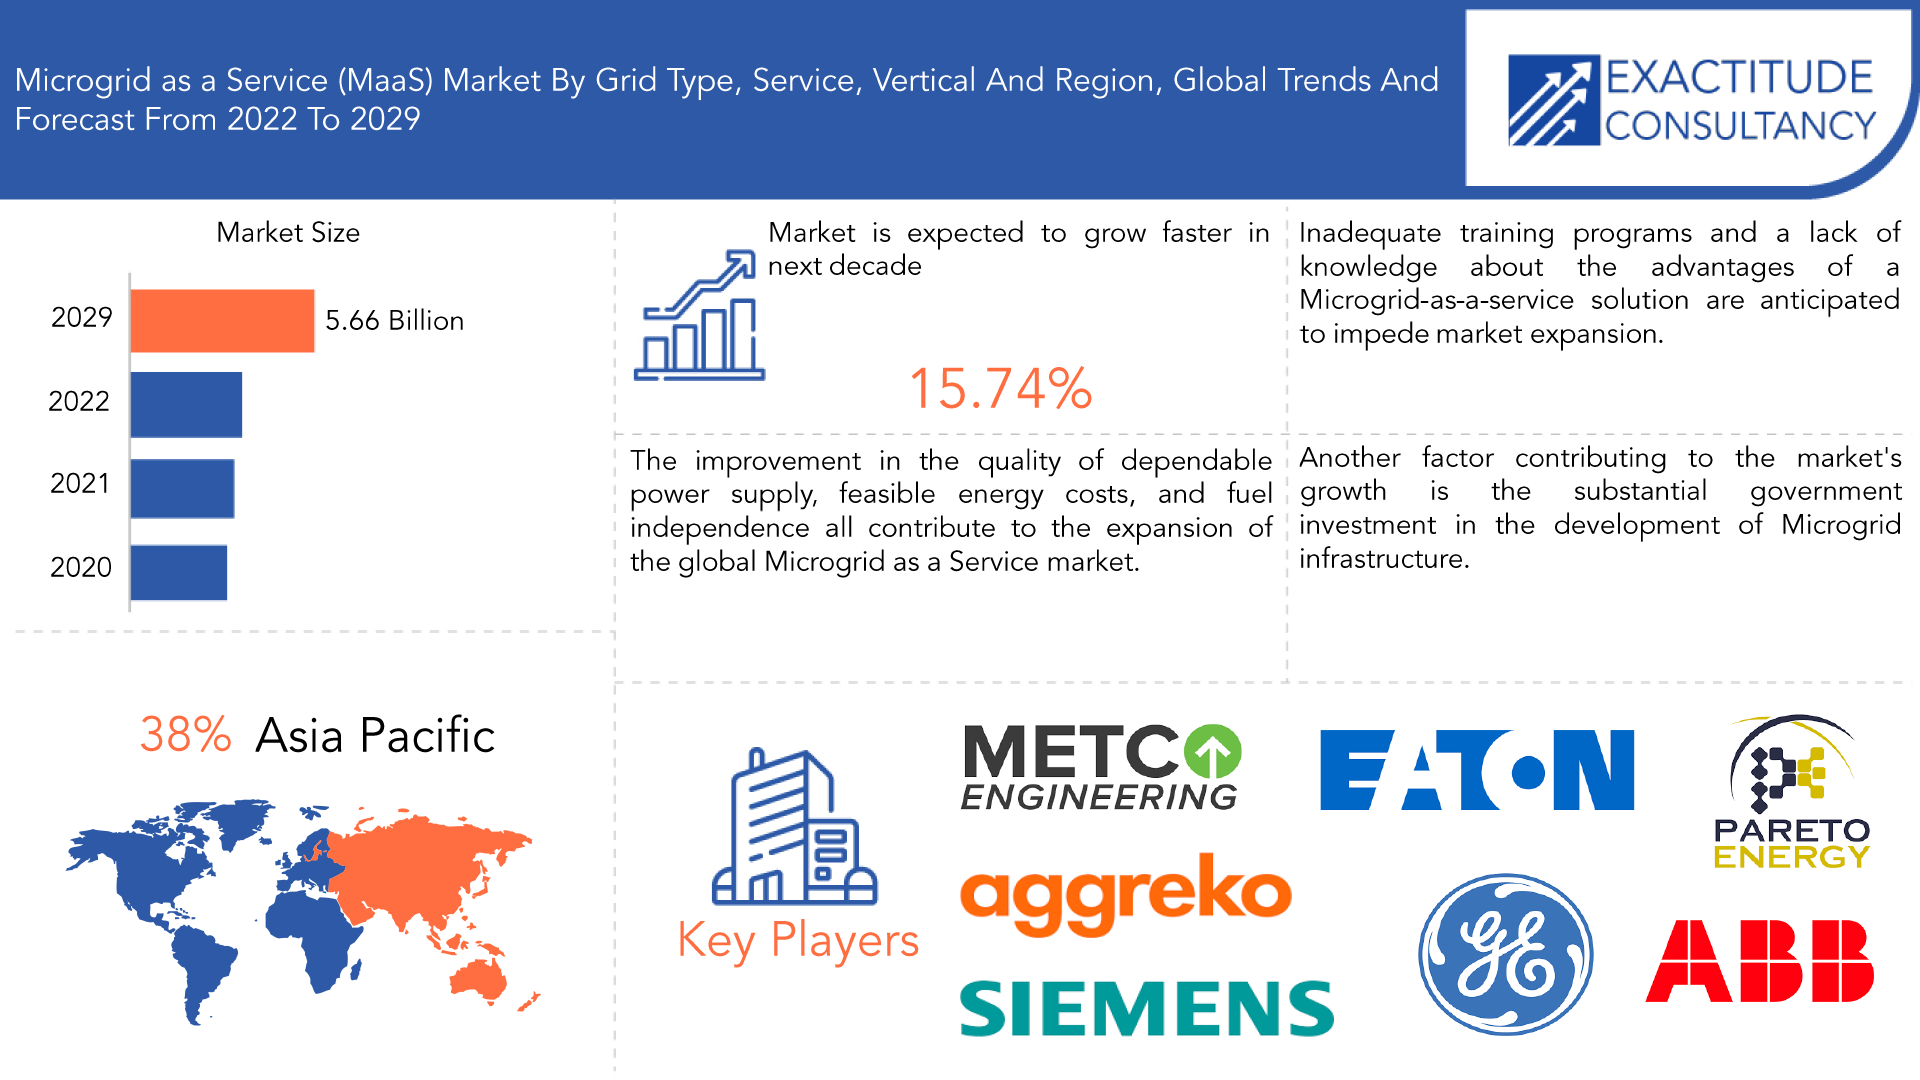
the global Microgrid as a Service (MaaS) market size is expected to grow at more than 15.74% CAGR from 2021 to 2029. It is expected to reach above USD 5.66 billion by 2029 from a little above USD 1.52 billion in 2020.
A localized group of electrical sources and loads is referred to as a microgrid. These sources and loads often operate with the conventional wide-area synchronous grid as well as a disconnect to island mode and function independently as necessary for economic and physical circumstances. A microgrid's principal function is to serve as a backup for buildings or businesses in the event that the main grid fails or is unable to provide enough electricity during peak hours. The Microgrid as a Service (MaaS) (MaaS) is a service that made the deployment of the microgrid simpler and less expensive at first. The software, design, and entire suite of financing toolkit development are all included in one cloud-based platform. These services make it possible to generate energy while also modernizing the infrastructure at reasonable operational and administration expenses. It has numerous uses in engineering, designs, monitoring, and operation control.
| ATTRIBUTE | DETAILS |
| Study period | 2020-2029 |
| Base year | 2021 |
| Estimated year | 2022 |
| Forecasted year | 2022-2029 |
| Historical period | 2018-2020 |
| Unit | Value (USD Billion) |
| Segmentation | By Grid Type, By Service, By Vertical, By Region |
| By Grid Type |
|
| By Service |
|
| By Vertical |
|
| By Region |
|
The superior quality of consistent power supply, reasonable energy expenditure, and fuel independence are some of the factors that are propelling the expansion of the global Microgrid as a Service (MaaS) market. The primary driver of the market's expansion is the growing adoption of MaaS in a variety of sectors, including defense, healthcare, and rural areas. Another factor contributing to the market's growth is the significant government investment in developing microgrid infrastructure. The electric power sector is keeping an eye on significant innovation's trajectory. Reliable MaaS may be more necessary in remote communities, educational institutions, and healthcare facilities that seek to profit from the unmatched advantages of microgrid infrastructure. As MaaS end users are not required to make substantial upfront expenditures, the global business may grow even quicker as a result. Utilizing a microgrid system can drastically cut operating costs. Most market categories might adopt MaaS as a result of this. Microgrid technology has the potential to be extensively adopted due to features like fuel independence, grid resilience, a higher and more dependable quality of power supply, and a cheap energy cost. In addition, the worldwide Microgrid as a Service (MaaS) (MaaS) market is anticipated to expand with the software as a service (SaaS) industry, which supports the creation of more affordable, dependable, and secure microgrid systems.
The lack of end-user awareness and increasing structure complexity are two significant factors limiting the growth of the Microgrid as a Service (MaaS) (MaaS) market. The complexity of planning and developing, as well as a lack of public awareness, are anticipated to hinder the micro-grid as a service (MaaS) market throughout the projection period. From the beginning, the concept of the micro-grid was thought to be complex. A sophisticated system is made up of a variety of parts, including sensors, encoders, communication networks, controllers, motors, resolvers, mechanical structures, and more. Microgrid as a Service (MaaS) (MaaS) adoption is being hampered by a number of other factors, including the tight laws, regulations, and standards that apply to microgrids and the growing acceptability of customer-owned microgrids.
Numerous unforeseen effects of the COVID-19 epidemic have been felt by the world economy. Apart from a shock to business as usual that resonated throughout the global economy, one of the most noticeable repercussions on the energy industry was a dramatic decrease in demand (and corresponding price) for oil. There are both immediate and long-term consequences, yet despite a serious global economic crisis, convincing evidence supports overall double-digit growth in the demand for Microgrid as a Service (MaaS). That expansion will be determined, though, by the disparate effects on various market sectors and the acceptance of diverse distributed energy resource (DER) solutions. Additionally, even though project delays in 2020 are anticipated to continue into 2021, COVID-19 is projected to improve the long-term outlook for Microgrid as a Service (MaaS).
[caption id="attachment_21946" align="aligncenter" width="1100"]
Frequently Asked Questions
• Who are the key players in the global Microgrid as a Service (MaaS) market?
Some key players operating in the global Microgrid as a Service (MaaS) market include ABB Ltd., General Electric Company, Siemens AG, Eaton Corporation Inc., Pareto Energy, Spirae Inc., Green Energy Corporation, Schneider Electric SE, Metco Engineering, Aggreko PLC.
• What are the factors driving the global Microgrid as a Service (MaaS) market?
The improvement in the quality of dependable power supply, feasible energy costs, and fuel independence all contribute to the expansion of the global Microgrid as a Service (MaaS) market.
• How big is the global Microgrid as a Service (MaaS) market?
The global Microgrid as a Service (MaaS) market size was estimated at USD 1.76 billion in 2021 and is expected to reach USD 5.66 billion in 2029.
• What is the global Microgrid as a Service (MaaS) market growth?
The global Microgrid as a Service (MaaS) market is expected to grow at a compound annual growth rate of 15.74% from 2022 to 2029 to reach USD 5.66 billion by 2029.
• Which region accounted for the largest global Microgrid as a Service (MaaS) market share?
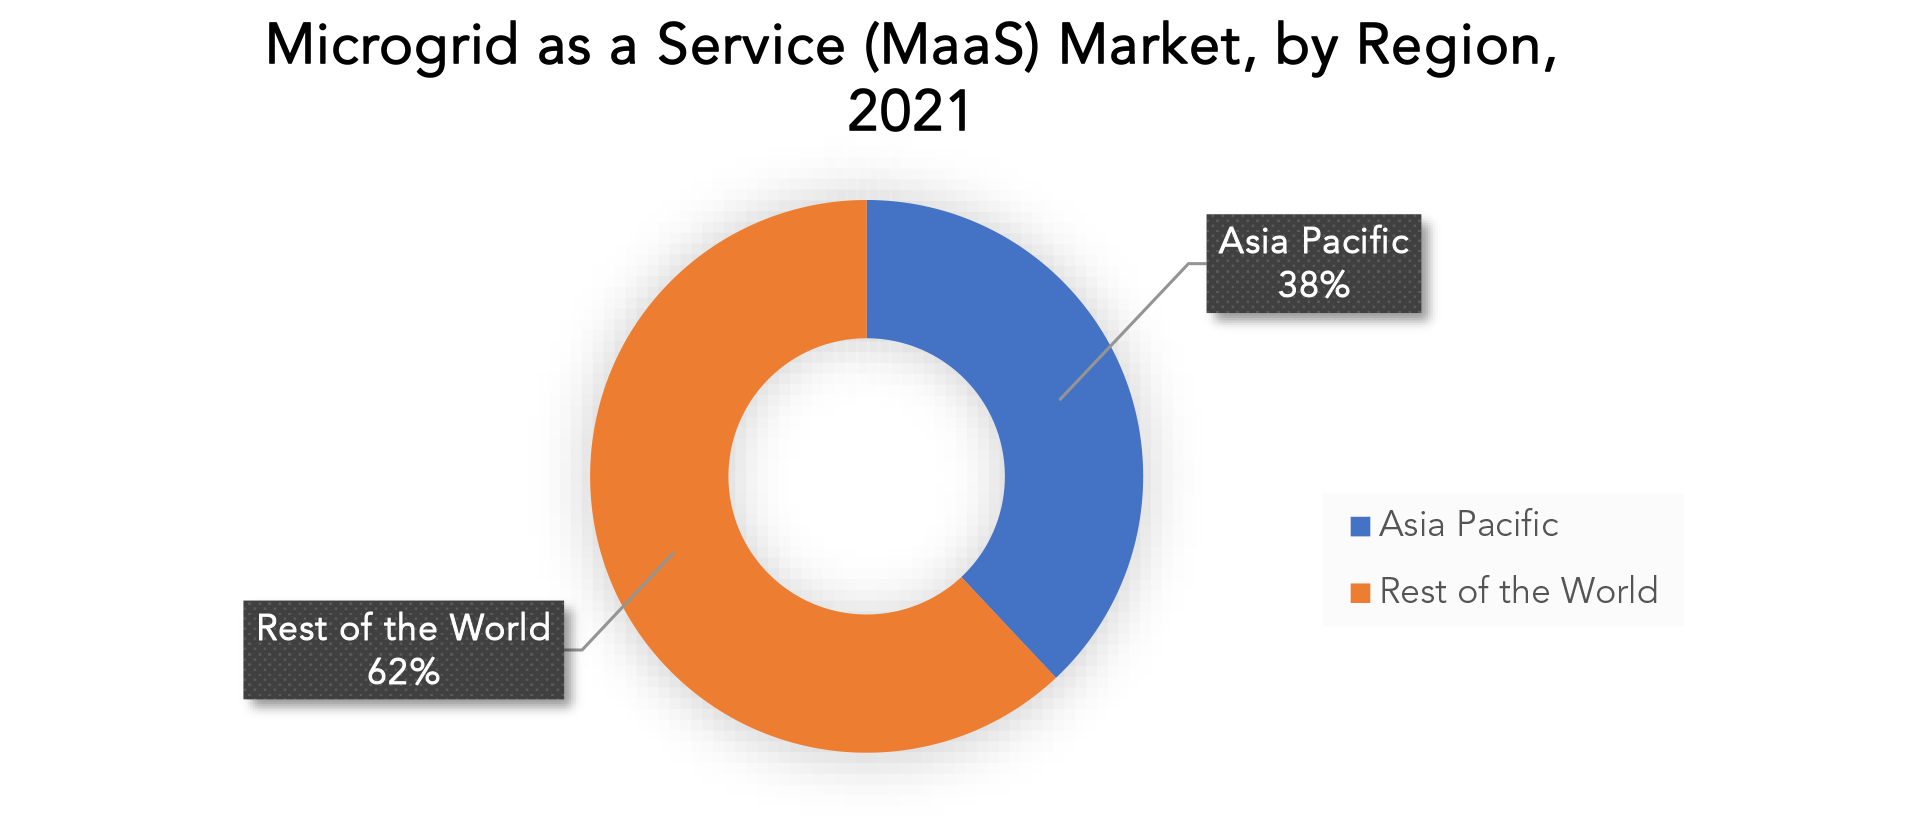
The Asia Pacific dominated the global Microgrid as a Service (MaaS) market with a share of 38% in 2021.
Global Microgrid as a Service (MaaS) Market Segment Analysis
By grid type, market is segmented into grid connected and remote/islanded. Remote or island-based is anticipated to expand at the fastest rate during the forecast period. Facilities can better manage distributed energy sources and have more control over meeting energy demands with the help of remote or island-based microgrids. Offices can more easily manage dispersed fuel sources and achieve more notable control in meeting their energy needs with the help of remote/island microgrids. By service, market is segmented into engineering & design, SAAS, monitoring & control, operation & maintenance. Due to microgrid owners' single responsibility and decreased chance of project failure, it is predicted that software as a service will increase at the fastest rate during the projected period. resulting in a microgrid system that is more dependable and secure. By vertical, market is segmented into government & education, industrial, military, residential & commercial and utility. Industry vertical holds the largest share in vertical segment. The advantages that have increased the acceptance of microgrid innovation in the modern industrial vertical include lower energy prices, more dependable and better quality power supply, network flexibility, access to power, and fuel autonomy. [caption id="attachment_21948" align="aligncenter" width="1920"]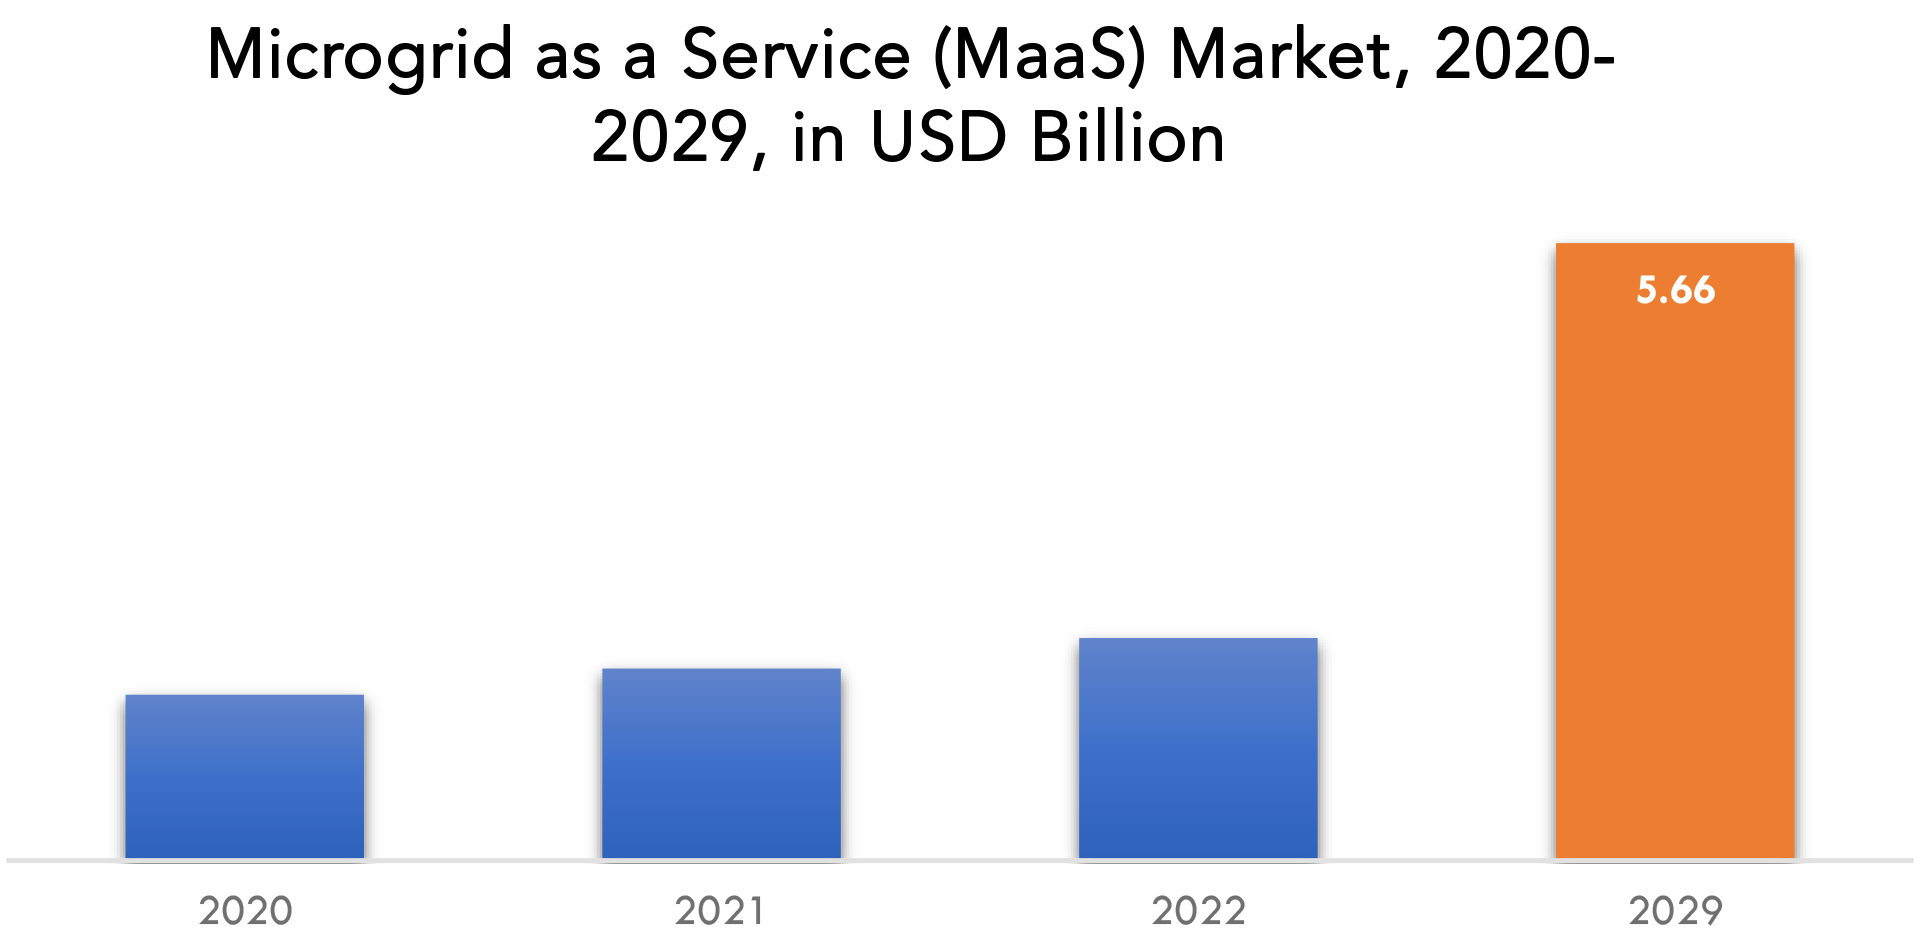
Global Microgrid as a Service (MaaS) Market Players
Key competitors from both domestic and international markets compete fiercely in the worldwide global Microgrid as a Service (MaaS) industry ABB Ltd., General Electric Company, Siemens AG, Eaton Corporation Inc., Pareto Energy, Spirae Inc., Green Energy Corporation, Schneider Electric SE, Metco Engineering, Aggreko PLC. Industry Developments: 14 November 2019: Siemens and the renewable energy developer juwi joined forces to enter into a strategic technology partnership to focus on microgrids in the mining industry. 9 March 2023: ABB entered into a strategic partnership with Direct Energy Partners (DEP), a start-up using digital technology to accelerate adoption of DC microgrids.Who Should Buy? Or Key stakeholders
- Microgrid Service Providers
- Transmission System Operators
- Energy Storage Vendors
- Smart Grid Software Vendors
- Solar PV Companies
- Government Agencies
- Utilities
- Investor Community
- Research Organizations
- Others
Global Microgrid as a Service (MaaS) Market Regional Analysis
The global Microgrid as a Service (MaaS) market by region includes North America, Asia-Pacific (APAC), Europe, South America, and Middle East & Africa (MEA).- North America: includes the US, Canada, Mexico
- Asia Pacific: includes China, Japan, South Korea, India, Australia, ASEAN and Rest of APAC
- Europe: includes UK, Germany, France, Italy, Spain, Russia, and Rest of Europe
- South America: includes Brazil, Argentina and Rest of South America
- Middle East & Africa: includes Turkey, UAE, Saudi Arabia, South Africa, and Rest of MEA
Key Market Segments: Global Microgrid as a Service (MaaS) Market
Global Microgrid as A Service (Maas) Market By Grid Type, 2020-2029, (USD Billion)- Grid Connected
- Remote/Islanded
- Engineering & Design
- SAAS
- Monitoring & Control
- Operation & Maintenance
- Government & Education
- Industrial
- Military
- Residential & Commercial
- Utility
- North America
- Europe
- Asia Pacific
- South America
- Middle East and Africa
Key Question Answered
- What is the expected growth rate of the Microgrid as a Service (MaaS) market over the next 7 years?
- Who are the major players in the Microgrid as a Service (MaaS) market and what is their market share?
- What are the end-user industries driving demand for market and what is their outlook?
- What are the opportunities for growth in emerging markets such as Asia-Pacific, Middle East, and Africa?
- How is the economic environment affecting the Microgrid as a Service (MaaS) market, including factors such as interest rates, inflation, and exchange rates?
- What is the expected impact of government policies and regulations on the Microgrid as a Service (MaaS) market?
- What is the current and forecasted size and growth rate of the global Microgrid as a Service (MaaS) market?
- What are the key drivers of growth in the Microgrid as a Service (MaaS) market?
- What are the distribution channels and supply chain dynamics in the Microgrid as a Service (MaaS) market?
- What are the technological advancements and innovations in the Microgrid as a Service (MaaS) market and their impact on product development and growth?
- What are the regulatory considerations and their impact on the market?
- What are the challenges faced by players in the Microgrid as a Service (MaaS) market and how are they addressing these challenges?
- What are the opportunities for growth and expansion in the Microgrid as a Service (MaaS) market?
- What are the service offerings and specifications of leading players in the market?
- INTRODUCTION
- MARKET DEFINITION
- MARKET SEGMENTATION
- RESEARCH TIMELINES
- ASSUMPTIONS AND LIMITATIONS
- RESEARCH METHODOLOGY
- DATA MINING
- SECONDARY RESEARCH
- PRIMARY RESEARCH
- SUBJECT-MATTER EXPERTS’ ADVICE
- QUALITY CHECKS
- FINAL REVIEW
- DATA TRIANGULATION
- BOTTOM-UP APPROACH
- TOP-DOWN APPROACH
- RESEARCH FLOW
- DATA SOURCES
- DATA MINING
- EXECUTIVE SUMMARY
- MARKET OVERVIEW
- GLOBAL MICROGRID AS A SERVICE (MAAS) MARKET OUTLOOK
- MARKET DRIVERS
- MARKET RESTRAINTS
- MARKET OPPORTUNITIES
- IMPACT OF COVID-19 ON MICROGRID AS A SERVICE (MAAS) MARKET
- PORTER’S FIVE FORCES MODEL
- THREAT FROM NEW ENTRANTS
- THREAT FROM SUBSTITUTES
- BARGAINING POWER OF SUPPLIERS
- BARGAINING POWER OF CUSTOMERS
- DEGREE OF COMPETITION
- VERTICAL VALUE CHAIN ANALYSIS
- GLOBAL MICROGRID AS A SERVICE (MAAS) MARKET OUTLOOK
- GLOBAL MICROGRID AS A SERVICE (MAAS) MARKET BY GRID TYPE, 2020-2029, (USD BILLION)
- GRID CONNECTED
- REMOTE/ISLANDED
- GLOBAL MICROGRID AS A SERVICE (MAAS) MARKET BY SERVICE, 2020-2029, (USD BILLION)
- ENGINEERING & DESIGN
- SAAS
- MONITORING & CONTROL
- OPERATION & MAINTENANCE
- GLOBAL MICROGRID AS A SERVICE (MAAS) MARKET BY VERTICAL, 2020-2029, (USD BILLION)
- GOVERNMENT & EDUCATION
- INDUSTRIAL
- MILITARY
- RESIDENTIAL & COMMERCIAL
- UTILITY
- GLOBAL MICROGRID AS A SERVICE (MAAS) MARKET BY REGION, 2020-2029, (USD BILLION)
- NORTH AMERICA
- US
- CANADA
- MEXICO
- SOUTH AMERICA
- BRAZIL
- ARGENTINA
- COLOMBIA
- REST OF SOUTH AMERICA
- EUROPE
- GERMANY
- UK
- FRANCE
- ITALY
- SPAIN
- RUSSIA
- REST OF EUROPE
- ASIA PACIFIC
- INDIA
- CHINA
- JAPAN
- SOUTH KOREA
- AUSTRALIA
- SOUTH-EAST ASIA
- REST OF ASIA PACIFIC
- MIDDLE EAST AND AFRICA
- UAE
- SAUDI ARABIA
- SOUTH AFRICA
- REST OF MIDDLE EAST AND AFRICA
- NORTH AMERICA
- COMPANY PROFILES*(BUSINESS OVERVIEW, COMPANY SNAPSHOT, PRODUCTS OFFERED, RECENT DEVELOPMENTS)
- ABB LTD.
- GENERAL ELECTRIC COMPANY
- SIEMENS AG
- EATON CORPORATION INC.
- PARETO ENERGY
- SPIRAE INC.
- GREEN ENERGY CORPORATION
- SCHNEIDER ELECTRIC SE
- METCO ENGINEERING
- AGGREKO PLC
*THE COMPANY LIST IS INDICATIVE
LIST OF TABLES
TABLE 1 GLOBAL MICROGRID AS A SERVICE (MAAS) MARKET BY GRID TYPE (USD BILLION) 2020-2029
TABLE 2 GLOBAL MICROGRID AS A SERVICE (MAAS) MARKET BY SERVICE (USD BILLION) 2020-2029
TABLE 3 GLOBAL MICROGRID AS A SERVICE (MAAS) MARKET BY VERTICAL (USD BILLION) 2020-2029
TABLE 4 GLOBAL MICROGRID AS A SERVICE (MAAS) MARKET BY REGION (USD BILLION) 2020-2029
TABLE 5 NORTH AMERICA MICROGRID AS A SERVICE (MAAS) MARKET BY COUNTRY (USD BILLION) 2020-2029
TABLE 6 NORTH AMERICA MICROGRID AS A SERVICE (MAAS) MARKET BY GRID TYPE (USD BILLION) 2020-2029
TABLE 7 NORTH AMERICA MICROGRID AS A SERVICE (MAAS) MARKET BY SERVICE (USD BILLION) 2020-2029
TABLE 8 NORTH AMERICA MICROGRID AS A SERVICE (MAAS) MARKET BY VERTICAL (USD BILLION) 2020-2029
TABLE 9 US MICROGRID AS A SERVICE (MAAS) MARKET BY GRID TYPE (USD BILLION) 2020-2029
TABLE 10 US MICROGRID AS A SERVICE (MAAS) MARKET BY SERVICE (USD BILLION) 2020-2029
TABLE 11 US MICROGRID AS A SERVICE (MAAS) MARKET BY VERTICAL (USD BILLION) 2020-2029
TABLE 12 CANADA MICROGRID AS A SERVICE (MAAS) MARKET BY GRID TYPE (USD BILLION) 2020-2029
TABLE 13 CANADA MICROGRID AS A SERVICE (MAAS) MARKET BY SERVICE (USD BILLION) 2020-2029
TABLE 14 CANADA MICROGRID AS A SERVICE (MAAS) MARKET BY VERTICAL (USD BILLION) 2020-2029
TABLE 15 MEXICO MICROGRID AS A SERVICE (MAAS) MARKET BY GRID TYPE (USD BILLION) 2020-2029
TABLE 16 MEXICO MICROGRID AS A SERVICE (MAAS) MARKET BY SERVICE (USD BILLION) 2020-2029
TABLE 17 MEXICO MICROGRID AS A SERVICE (MAAS) MARKET BY VERTICAL (USD BILLION) 2020-2029
TABLE 18 SOUTH AMERICA MICROGRID AS A SERVICE (MAAS) MARKET BY COUNTRY (USD BILLION) 2020-2029
TABLE 19 SOUTH AMERICA MICROGRID AS A SERVICE (MAAS) MARKET BY GRID TYPE (USD BILLION) 2020-2029
TABLE 20 SOUTH AMERICA MICROGRID AS A SERVICE (MAAS) MARKET BY SERVICE (USD BILLION) 2020-2029
TABLE 21 SOUTH AMERICA MICROGRID AS A SERVICE (MAAS) MARKET BY VERTICAL (USD BILLION) 2020-2029
TABLE 22 BRAZIL MICROGRID AS A SERVICE (MAAS) MARKET BY GRID TYPE (USD BILLION) 2020-2029
TABLE 23 BRAZIL MICROGRID AS A SERVICE (MAAS) MARKET BY SERVICE (USD BILLION) 2020-2029
TABLE 24 BRAZIL MICROGRID AS A SERVICE (MAAS) MARKET BY VERTICAL (USD BILLION) 2020-2029
TABLE 25 ARGENTINA MICROGRID AS A SERVICE (MAAS) MARKET BY GRID TYPE (USD BILLION) 2020-2029
TABLE 26 ARGENTINA MICROGRID AS A SERVICE (MAAS) MARKET BY SERVICE (USD BILLION) 2020-2029
TABLE 27 ARGENTINA MICROGRID AS A SERVICE (MAAS) MARKET BY VERTICAL (USD BILLION) 2020-2029
TABLE 28 COLOMBIA MICROGRID AS A SERVICE (MAAS) MARKET BY GRID TYPE (USD BILLION) 2020-2029
TABLE 29 COLOMBIA MICROGRID AS A SERVICE (MAAS) MARKET BY SERVICE (USD BILLION) 2020-2029
TABLE 30 COLOMBIA MICROGRID AS A SERVICE (MAAS) MARKET BY VERTICAL (USD BILLION) 2020-2029
TABLE 31 REST OF SOUTH AMERICA MICROGRID AS A SERVICE (MAAS) MARKET BY GRID TYPE (USD BILLION) 2020-2029
TABLE 32 REST OF SOUTH AMERICA MICROGRID AS A SERVICE (MAAS) MARKET BY SERVICE (USD BILLION) 2020-2029
TABLE 33 REST OF SOUTH AMERICA MICROGRID AS A SERVICE (MAAS) MARKET BY VERTICAL (USD BILLION) 2020-2029
TABLE 34 ASIA-PACIFIC MICROGRID AS A SERVICE (MAAS) MARKET BY COUNTRY (USD BILLION) 2020-2029
TABLE 35 ASIA-PACIFIC MICROGRID AS A SERVICE (MAAS) MARKET BY GRID TYPE (USD BILLION) 2020-2029
TABLE 36 ASIA-PACIFIC MICROGRID AS A SERVICE (MAAS) MARKET BY SERVICE (USD BILLION) 2020-2029
TABLE 37 ASIA-PACIFIC MICROGRID AS A SERVICE (MAAS) MARKET BY VERTICAL (USD BILLION) 2020-2029
TABLE 38 INDIA MICROGRID AS A SERVICE (MAAS) MARKET BY GRID TYPE (USD BILLION) 2020-2029
TABLE 39 INDIA MICROGRID AS A SERVICE (MAAS) MARKET BY SERVICE (USD BILLION) 2020-2029
TABLE 40 INDIA MICROGRID AS A SERVICE (MAAS) MARKET BY VERTICAL (USD BILLION) 2020-2029
TABLE 41 CHINA MICROGRID AS A SERVICE (MAAS) MARKET BY GRID TYPE (USD BILLION) 2020-2029
TABLE 42 CHINA MICROGRID AS A SERVICE (MAAS) MARKET BY SERVICE (USD BILLION) 2020-2029
TABLE 43 CHINA MICROGRID AS A SERVICE (MAAS) MARKET BY VERTICAL (USD BILLION) 2020-2029
TABLE 44 JAPAN MICROGRID AS A SERVICE (MAAS) MARKET BY GRID TYPE (USD BILLION) 2020-2029
TABLE 45 JAPAN MICROGRID AS A SERVICE (MAAS) MARKET BY SERVICE (USD BILLION) 2020-2029
TABLE 46 JAPAN MICROGRID AS A SERVICE (MAAS) MARKET BY VERTICAL (USD BILLION) 2020-2029
TABLE 47 SOUTH KOREA MICROGRID AS A SERVICE (MAAS) MARKET BY GRID TYPE (USD BILLION) 2020-2029
TABLE 48 SOUTH KOREA MICROGRID AS A SERVICE (MAAS) MARKET BY SERVICE (USD BILLION) 2020-2029
TABLE 49 SOUTH KOREA MICROGRID AS A SERVICE (MAAS) MARKET BY VERTICAL (USD BILLION) 2020-2029
TABLE 50 AUSTRALIA MICROGRID AS A SERVICE (MAAS) MARKET BY GRID TYPE (USD BILLION) 2020-2029
TABLE 51 AUSTRALIA MICROGRID AS A SERVICE (MAAS) MARKET BY SERVICE (USD BILLION) 2020-2029
TABLE 52 AUSTRALIA MICROGRID AS A SERVICE (MAAS) MARKET BY VERTICAL (USD BILLION) 2020-2029
TABLE 53 SOUTH-EAST ASIA MICROGRID AS A SERVICE (MAAS) MARKET BY GRID TYPE (USD BILLION) 2020-2029
TABLE 54 SOUTH-EAST ASIA MICROGRID AS A SERVICE (MAAS) MARKET BY SERVICE (USD BILLION) 2020-2029
TABLE 55 SOUTH-EAST ASIA MICROGRID AS A SERVICE (MAAS) MARKET BY VERTICAL (USD BILLION) 2020-2029
TABLE 56 REST OF ASIA PACIFIC MICROGRID AS A SERVICE (MAAS) MARKET BY GRID TYPE (USD BILLION) 2020-2029
TABLE 57 REST OF ASIA PACIFIC MICROGRID AS A SERVICE (MAAS) MARKET BY SERVICE (USD BILLION) 2020-2029
TABLE 58 REST OF ASIA PACIFIC MICROGRID AS A SERVICE (MAAS) MARKET BY VERTICAL (USD BILLION) 2020-2029
TABLE 59 EUROPE MICROGRID AS A SERVICE (MAAS) MARKET BY COUNTRY (USD BILLION) 2020-2029
TABLE 60 EUROPE MICROGRID AS A SERVICE (MAAS) MARKET BY GRID TYPE (USD BILLION) 2020-2029
TABLE 61 EUROPE MICROGRID AS A SERVICE (MAAS) MARKET BY SERVICE (USD BILLION) 2020-2029
TABLE 62 EUROPE MICROGRID AS A SERVICE (MAAS) MARKET BY VERTICAL (USD BILLION) 2020-2029
TABLE 63 GERMANY MICROGRID AS A SERVICE (MAAS) MARKET BY GRID TYPE (USD BILLION) 2020-2029
TABLE 64 GERMANY MICROGRID AS A SERVICE (MAAS) MARKET BY SERVICE (USD BILLION) 2020-2029
TABLE 65 GERMANY MICROGRID AS A SERVICE (MAAS) MARKET BY VERTICAL (USD BILLION) 2020-2029
TABLE 66 UK MICROGRID AS A SERVICE (MAAS) MARKET BY GRID TYPE (USD BILLION) 2020-2029
TABLE 67 UK MICROGRID AS A SERVICE (MAAS) MARKET BY SERVICE (USD BILLION) 2020-2029
TABLE 68 UK MICROGRID AS A SERVICE (MAAS) MARKET BY VERTICAL (USD BILLION) 2020-2029
TABLE 69 FRANCE MICROGRID AS A SERVICE (MAAS) MARKET BY GRID TYPE (USD BILLION) 2020-2029
TABLE 70 FRANCE MICROGRID AS A SERVICE (MAAS) MARKET BY SERVICE (USD BILLION) 2020-2029
TABLE 71 FRANCE MICROGRID AS A SERVICE (MAAS) MARKET BY VERTICAL (USD BILLION) 2020-2029
TABLE 72 ITALY MICROGRID AS A SERVICE (MAAS) MARKET BY GRID TYPE (USD BILLION) 2020-2029
TABLE 73 ITALY MICROGRID AS A SERVICE (MAAS) MARKET BY SERVICE (USD BILLION) 2020-2029
TABLE 74 ITALY MICROGRID AS A SERVICE (MAAS) MARKET BY VERTICAL (USD BILLION) 2020-2029
TABLE 75 SPAIN MICROGRID AS A SERVICE (MAAS) MARKET BY GRID TYPE (USD BILLION) 2020-2029
TABLE 76 SPAIN MICROGRID AS A SERVICE (MAAS) MARKET BY SERVICE (USD BILLION) 2020-2029
TABLE 77 SPAIN MICROGRID AS A SERVICE (MAAS) MARKET BY VERTICAL (USD BILLION) 2020-2029
TABLE 78 RUSSIA MICROGRID AS A SERVICE (MAAS) MARKET BY GRID TYPE (USD BILLION) 2020-2029
TABLE 79 RUSSIA MICROGRID AS A SERVICE (MAAS) MARKET BY SERVICE (USD BILLION) 2020-2029
TABLE 80 RUSSIA MICROGRID AS A SERVICE (MAAS) MARKET BY VERTICAL (USD BILLION) 2020-2029
TABLE 81 REST OF EUROPE MICROGRID AS A SERVICE (MAAS) MARKET BY GRID TYPE (USD BILLION) 2020-2029
TABLE 82 REST OF EUROPE MICROGRID AS A SERVICE (MAAS) MARKET BY SERVICE (USD BILLION) 2020-2029
TABLE 83 REST OF EUROPE MICROGRID AS A SERVICE (MAAS) MARKET BY VERTICAL (USD BILLION) 2020-2029
TABLE 84 MIDDLE EAST AND AFRICA MICROGRID AS A SERVICE (MAAS) MARKET BY COUNTRY (USD BILLION) 2020-2029
TABLE 85 MIDDLE EAST AND AFRICA MICROGRID AS A SERVICE (MAAS) MARKET BY GRID TYPE (USD BILLION) 2020-2029
TABLE 86 MIDDLE EAST AND AFRICA MICROGRID AS A SERVICE (MAAS) MARKET BY SERVICE (USD BILLION) 2020-2029
TABLE 87 MIDDLE EAST AND AFRICA MICROGRID AS A SERVICE (MAAS) MARKET BY VERTICAL (USD BILLION) 2020-2029
TABLE 88 UAE MICROGRID AS A SERVICE (MAAS) MARKET BY GRID TYPE (USD BILLION) 2020-2029
TABLE 89 UAE MICROGRID AS A SERVICE (MAAS) MARKET BY SERVICE (USD BILLION) 2020-2029
TABLE 90 UAE MICROGRID AS A SERVICE (MAAS) MARKET BY VERTICAL (USD BILLION) 2020-2029
TABLE 91 SAUDI ARABIA MICROGRID AS A SERVICE (MAAS) MARKET BY GRID TYPE (USD BILLION) 2020-2029
TABLE 92 SAUDI ARABIA MICROGRID AS A SERVICE (MAAS) MARKET BY SERVICE (USD BILLION) 2020-2029
TABLE 93 SAUDI ARABIA MICROGRID AS A SERVICE (MAAS) MARKET BY VERTICAL (USD BILLION) 2020-2029
TABLE 94 SOUTH AFRICA MICROGRID AS A SERVICE (MAAS) MARKET BY GRID TYPE (USD BILLION) 2020-2029
TABLE 95 SOUTH AFRICA MICROGRID AS A SERVICE (MAAS) MARKET BY SERVICE (USD BILLION) 2020-2029
TABLE 96 SOUTH AFRICA MICROGRID AS A SERVICE (MAAS) MARKET BY VERTICAL (USD BILLION) 2020-2029
TABLE 97 REST OF MIDDLE EAST AND AFRICA MICROGRID AS A SERVICE (MAAS) MARKET BY GRID TYPE (USD BILLION) 2020-2029
TABLE 98 REST OF MIDDLE EAST AND AFRICA MICROGRID AS A SERVICE (MAAS) MARKET BY SERVICE (USD BILLION) 2020-2029
TABLE 99 REST OF MIDDLE EAST AND AFRICA MICROGRID AS A SERVICE (MAAS) MARKET BY VERTICAL (USD BILLION) 2020-2029
LIST OF FIGURES
FIGURE 1 MARKET DYNAMICS
FIGURE 2 MARKET SEGMENTATION
FIGURE 3 REPORT TIMELINES: YEARS CONSIDERED
FIGURE 4 DATA TRIANGULATION
FIGURE 5 BOTTOM-UP APPROACH
FIGURE 6 TOP-DOWN APPROACH
FIGURE 7 RESEARCH FLOW
FIGURE 8 GLOBAL MICROGRID AS A SERVICE (MAAS) MARKET BY GRID TYPE, USD BILLION, 2020-2029
FIGURE 9 GLOBAL MICROGRID AS A SERVICE (MAAS) MARKET BY SERVICE, USD BILLION, 2020-2029
FIGURE 10 GLOBAL MICROGRID AS A SERVICE (MAAS) MARKET BY VERTICAL, USD BILLION, 2020-2029
FIGURE 11 GLOBAL MICROGRID AS A SERVICE (MAAS) MARKET BY REGION, USD BILLION, 2020-2029
FIGURE 12 PORTER’S FIVE FORCES MODEL
FIGURE 13 GLOBAL MICROGRID AS A SERVICE (MAAS) MARKET BY GRID TYPE, USD BILLION, 2021
FIGURE 14 GLOBAL MICROGRID AS A SERVICE (MAAS) MARKET BY SERVICE, USD BILLION, 2021
FIGURE 15 GLOBAL MICROGRID AS A SERVICE (MAAS) MARKET BY VERTICAL, USD BILLION, 2021
FIGURE 16 GLOBAL MICROGRID AS A SERVICE (MAAS) MARKET BY REGION, USD BILLION, 2021
FIGURE 17 NORTH AMERICA MICROGRID AS A SERVICE (MAAS) MARKET SNAPSHOT
FIGURE 18 EUROPE MICROGRID AS A SERVICE (MAAS) MARKET SNAPSHOT
FIGURE 19 SOUTH AMERICA MICROGRID AS A SERVICE (MAAS) MARKET SNAPSHOT
FIGURE 20 ASIA PACIFIC MICROGRID AS A SERVICE (MAAS) MARKET SNAPSHOT
FIGURE 21 MIDDLE EAST ASIA AND AFRICA MICROGRID AS A SERVICE (MAAS) MARKET SNAPSHOT
FIGURE 22 MARKET SHARE ANALYSIS
FIGURE 23 ABB LTD.: COMPANY SNAPSHOT
FIGURE 24 GENERAL ELECTRIC COMPANY: COMPANY SNAPSHOT
FIGURE 25 SIEMENS AG: COMPANY SNAPSHOT
FIGURE 26 EATON CORPORATION INC.: COMPANY SNAPSHOT
FIGURE 27 PARETO ENERGY: COMPANY SNAPSHOT
FIGURE 28 SPIRAE INC.: COMPANY SNAPSHOT
FIGURE 29 GREEN ENERGY CORPORATION: COMPANY SNAPSHOT
FIGURE 30 SCHNEIDER ELECTRIC SE: COMPANY SNAPSHOT
FIGURE 31 METCO ENGINEERING: COMPANY SNAPSHOT
FIGURE 32 AGGREKO PLC.: COMPANY SNAPSHOT
DOWNLOAD FREE SAMPLE REPORT
License Type
SPEAK WITH OUR ANALYST
Want to know more about the report or any specific requirement?
WANT TO CUSTOMIZE THE REPORT?
Our Clients Speak
We asked them to research ‘ Equipment market’ all over the world, and their whole arrangement was helpful to us. thehealthanalytics.com insightful analysis and reports contributed to our current analysis and in creating a future strategy. Besides, the te
Yosuke Mitsui
Senior Associate Construction Equipment Sales & Marketing
We asked them to research ‘Equipment market’ all over the world, and their whole arrangement was helpful to us. thehealthanalytics.com insightful analysis and reports contributed to our current analysis and in creating a future strategy. Besides, the te


