

Base Year Value ()
x.x %
x.x %
CAGR ()
x.x %
x.x %
Forecast Year Value ()
x.x %
x.x %
Historical Data Period
Largest Region
Forecast Period
Global Smart Construction Market by Type (On-site Visualization, Fleet Tracking, Construction Simulation, Intelligent Control), by Application (Construction, Transportation, Mining) and Region, Global Trends and Forecast From 2022 To 2029
Instant access to hundreds of data points and trends
- Market estimates from 2014-2029
- Competitive analysis, industry segmentation, financial benchmarks
- Incorporates SWOT, Porter's Five Forces and risk management frameworks
- PDF report or online database with Word, Excel and PowerPoint export options
- 100% money back guarantee
Smart Construction Market Overview
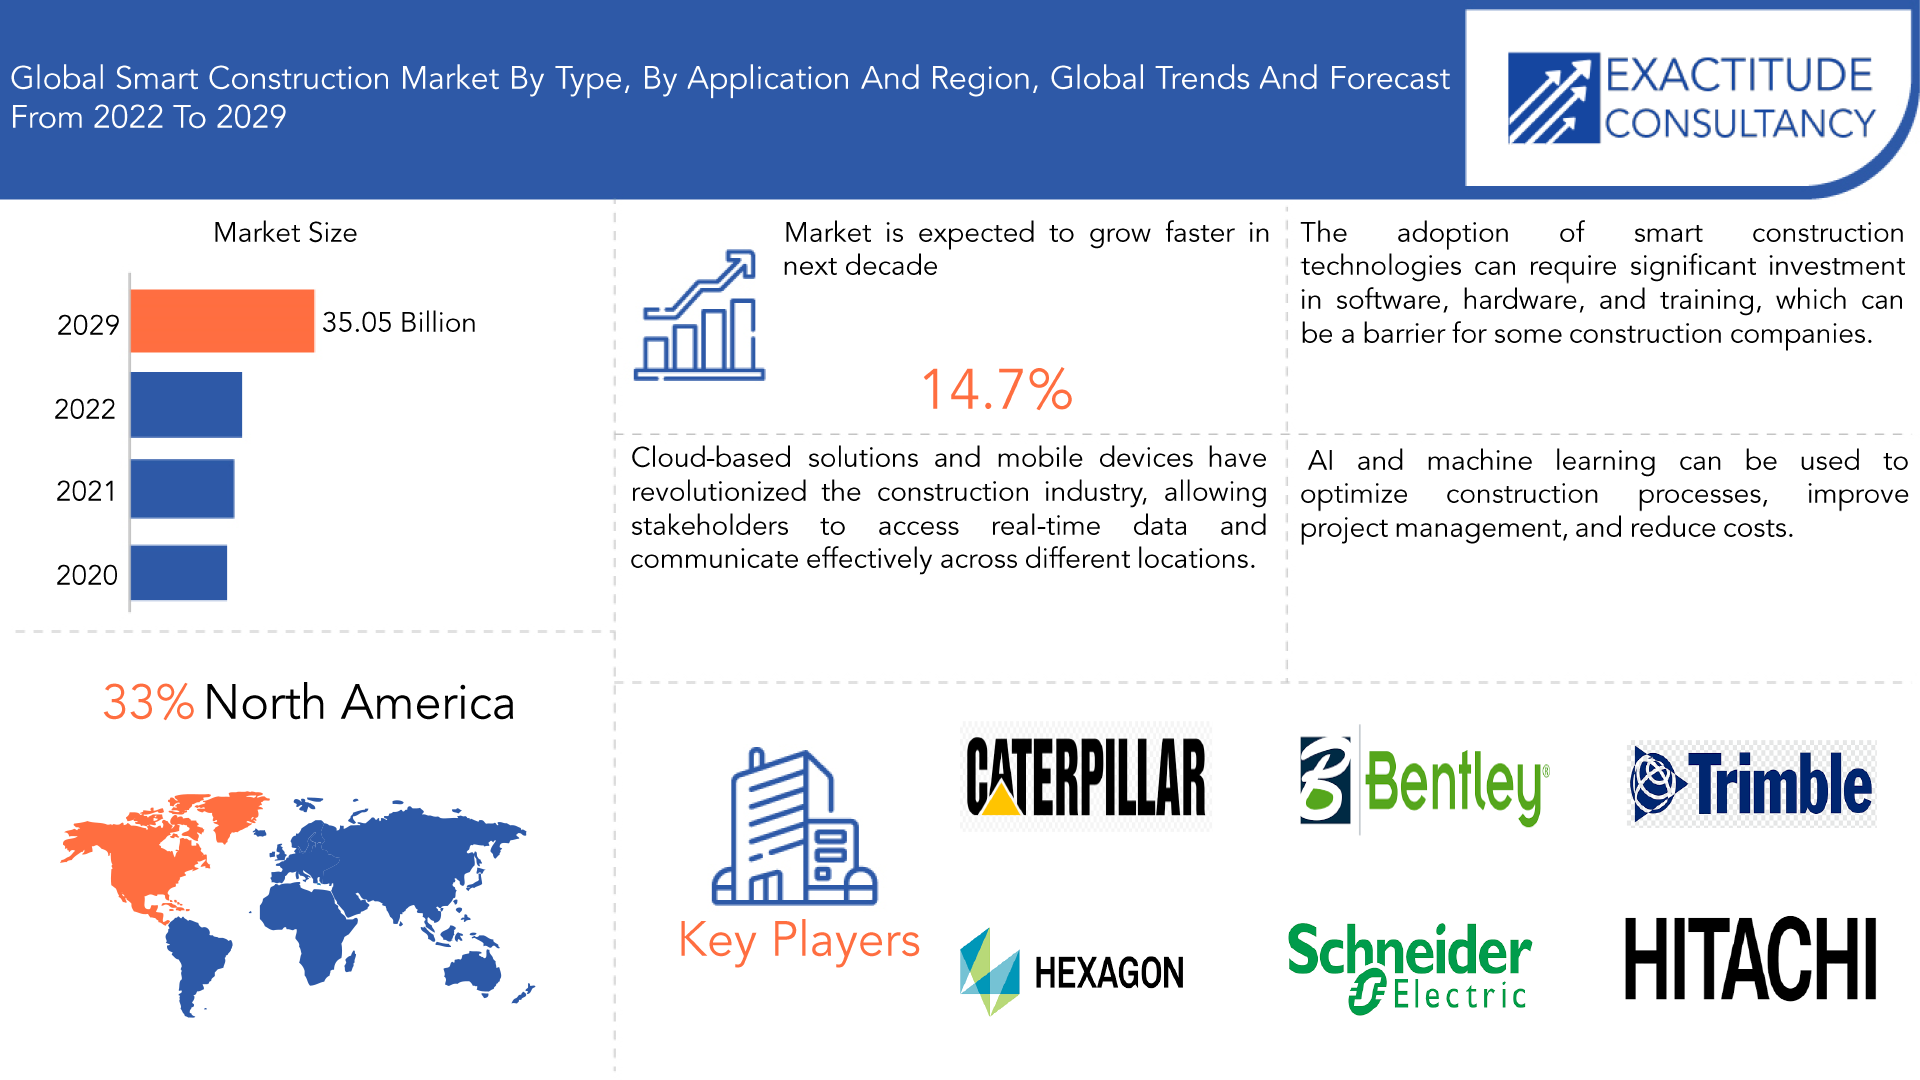
The global smart construction market is expected to grow at 14.70% CAGR from 2020 to 2029. It is expected to reach above USD 35.05 Billion by 2029 from USD 10.20 Billion in 2020.
Smart construction is the use of advanced technologies and innovative solutions to improve the efficiency, productivity, and safety of the construction industry. It involves the use of real-time data analytics, digital communication, and automation technologies to streamline construction processes, reduce costs, and enhance quality. Smart Construction solutions can include software, hardware, and services that use technologies such as building information modelling (BIM), internet of things (IoT), artificial intelligence (AI), and other advanced solutions. These technologies allow for better communication and collaboration among stakeholders, improved project management, and more accurate tracking of project progress.
| ATTRIBUTE | DETAILS |
| Study period | 2020-2029 |
| Base year | 2021 |
| Estimated year | 2022 |
| Forecasted year | 2022-2029 |
| Historical period | 2018-2020 |
| Unit | Value (USD Billion) |
| Segmentation | By Type, Application and region. |
| By Type |
|
| By Application |
|
| By Region |
|
The increasing demand for smart buildings is driven by factors such as cost savings, sustainability, improved occupant comfort, and regulatory requirements. Smart buildings use advanced technologies such as automated systems, sensors, and monitoring systems to optimize energy usage, reduce environmental impact, and enhance occupant comfort and productivity. Governments are also introducing regulations and incentives to encourage the development of smart buildings. The adoption of smart construction technologies such as BIM, IoT, and AI is expected to increase in response to the demand for smart buildings, leading to improved energy efficiency, sustainability, and occupant comfort.
High implementation costs are one of the major restraints of the smart construction market. The adoption of smart construction technologies can require significant investment in software, hardware, and training, which can be a barrier for some construction companies. The high implementation costs can be attributed to several factors, such as the cost of purchasing and integrating hardware and software systems, the need for specialized training and expertise to operate these systems, and the cost of hiring new staff or outsourcing services to manage these technologies.
The integration of artificial intelligence (AI) and machine learning (ML) in the construction industry offers numerous benefits. By automating repetitive and manual tasks, AI and ML can free up construction workers to focus on more complex tasks. These technologies can also help to improve safety on the job site by identifying potential hazards in real-time. Additionally, AI and ML can optimize construction schedules and resource allocation, reduce errors and defects in finished products, and predict potential maintenance issues before they occur. As these technologies become more advanced and accessible, we can expect to see even more innovative applications in the smart construction market, transforming the way construction projects are planned, managed, and executed.
The COVID-19 pandemic had impacted the smart construction market in several ways. Global supply chains had been disrupted, leading to difficulties in obtaining materials and equipment needed for construction projects. Labor shortages had also been reported, causing delays in completing projects on time. The pandemic had also caused delays in the planning, design, and execution of construction projects, resulting in longer project timelines. Economic uncertainty and decreased investment in construction projects had led to a reduction in demand for smart construction solutions. However, the pandemic had also increased the focus on safety measures in the construction industry, with companies implementing new protocols to protect workers from the virus. Despite these challenges, the smart construction market is recovering and continue to grow as the need for more efficient and sustainable construction methods continues to drive demand for smart construction solutions.
[caption id="attachment_22067" align="aligncenter" width="1920"]
Frequently Asked Questions
• What is the worth of the global smart construction market?
The global smart construction market is expected to grow at 14.70% CAGR from 2020 to 2029. It is expected to reach above USD 35.05 Billion by 2029 from USD 10.20 Billion in 2020.
• What is the size of the North America smart construction market?
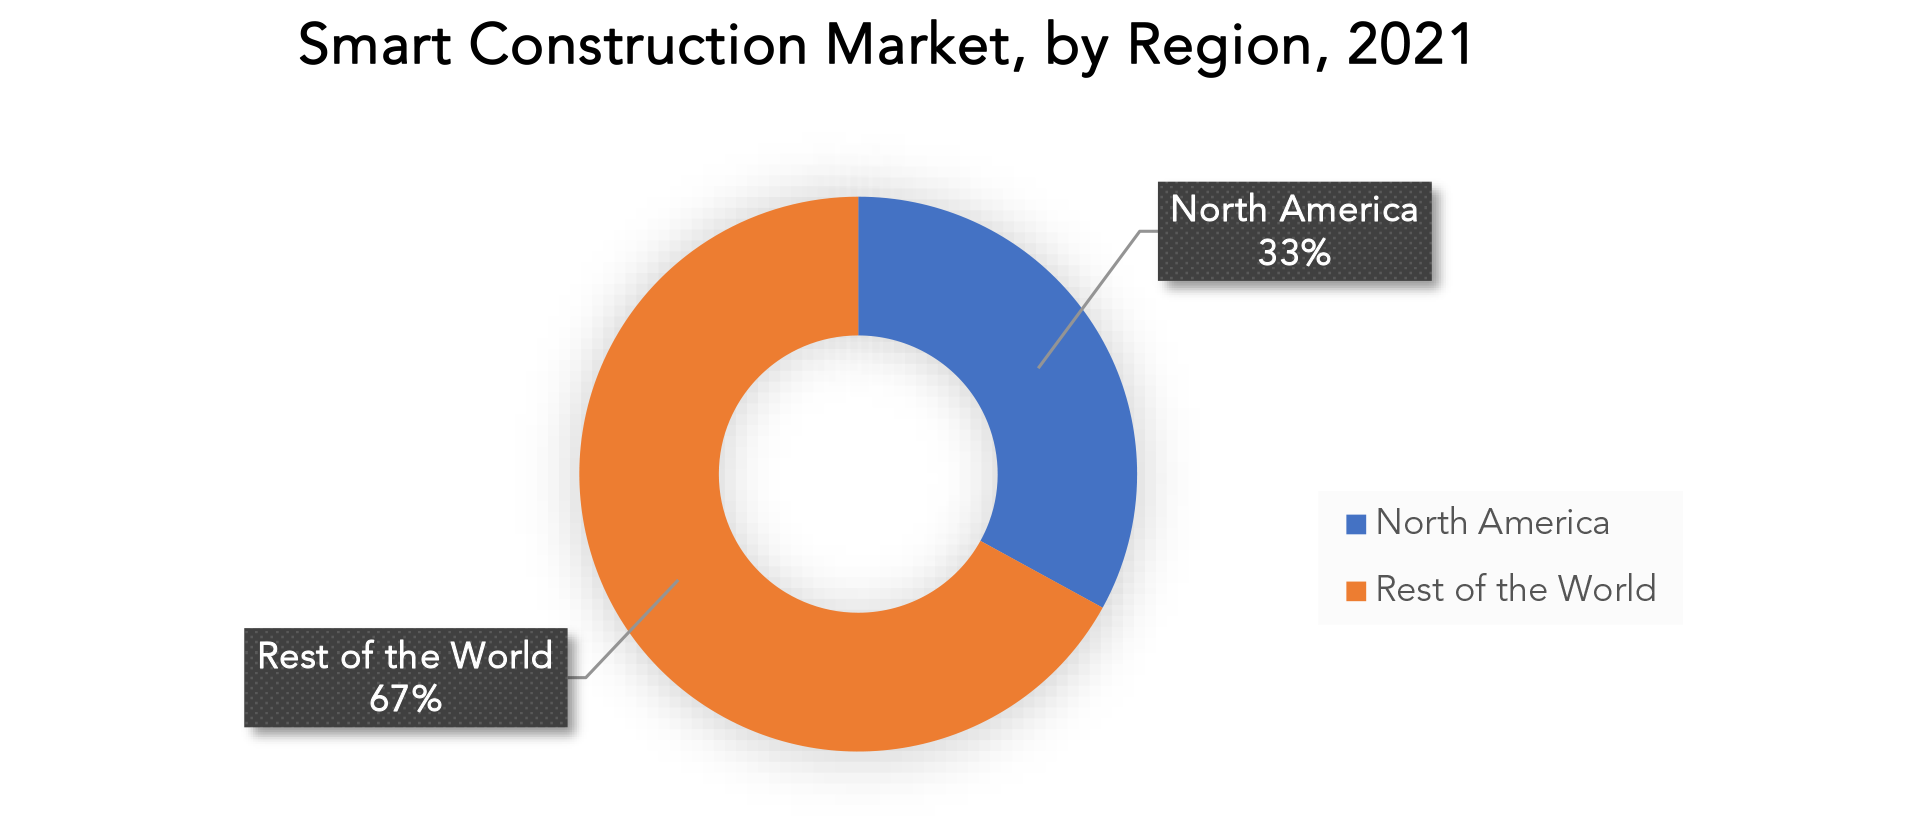
North America held more than 33% of the smart construction market revenue share in 2020 and will witness tremendous expansion during the forecast period.
• What are some of the market's driving forces?
There is a growing demand for smart buildings that are energy-efficient, sustainable, and technologically advanced. This has led to the adoption of advanced technologies such as BIM, IoT, and AI in the construction industry to meet the demands of smart buildings.
• Which are the top companies to hold the market share in the smart construction market?
The smart construction market key players include Trimble Inc., Oracle Corporation, Bentley Systems Inc., Hexagon AB, Caterpillar Inc., SAP SE, Hitachi Ltd., Schneider Electric SE, IBM Corporation, Honeywell International Inc.
• What is the leading application of the smart construction market?
The construction sector is major sector where the application of smart construction has seen more.
• Which is the largest regional market for smart construction market?
The markets largest share is in the North America region.
Smart Construction Market Segment Analysis
The smart construction market is segmented into different product types, including on-site visualization, fleet tracking, construction simulation, and intelligent control. On-site visualization technology is expected to grow due to the increasing need for real-time monitoring and visualization of construction progress. Fleet tracking is expected to grow due to the increasing demand for better management of construction equipment and vehicles. The construction simulation segment is expected to grow due to the increasing need for better planning and risk assessment. The intelligent control segment is expected to grow due to the increasing demand for automation and optimization of construction processes. Each segment has its own unique opportunities and challenges, contributing to the overall growth of the smart construction market. The smart construction market has three main application types, including construction, transportation, and mining. The construction segment is expected to dominate the market due to the increasing demand for better project management, safety, and sustainability. Smart construction technologies can be used to optimize resources, reduce costs, and improve efficiency. The transportation segment is expected to grow due to the increasing demand for better infrastructure planning and management. Smart construction technologies can be used to optimize the construction and maintenance of highways, railways, bridges, and tunnels. The mining segment is also expected to grow due to the increasing demand for automation and optimization of mining operations. Smart construction technologies can help improve safety, reduce downtime, and enhance productivity in mining operations. [caption id="attachment_22068" align="aligncenter" width="1920"]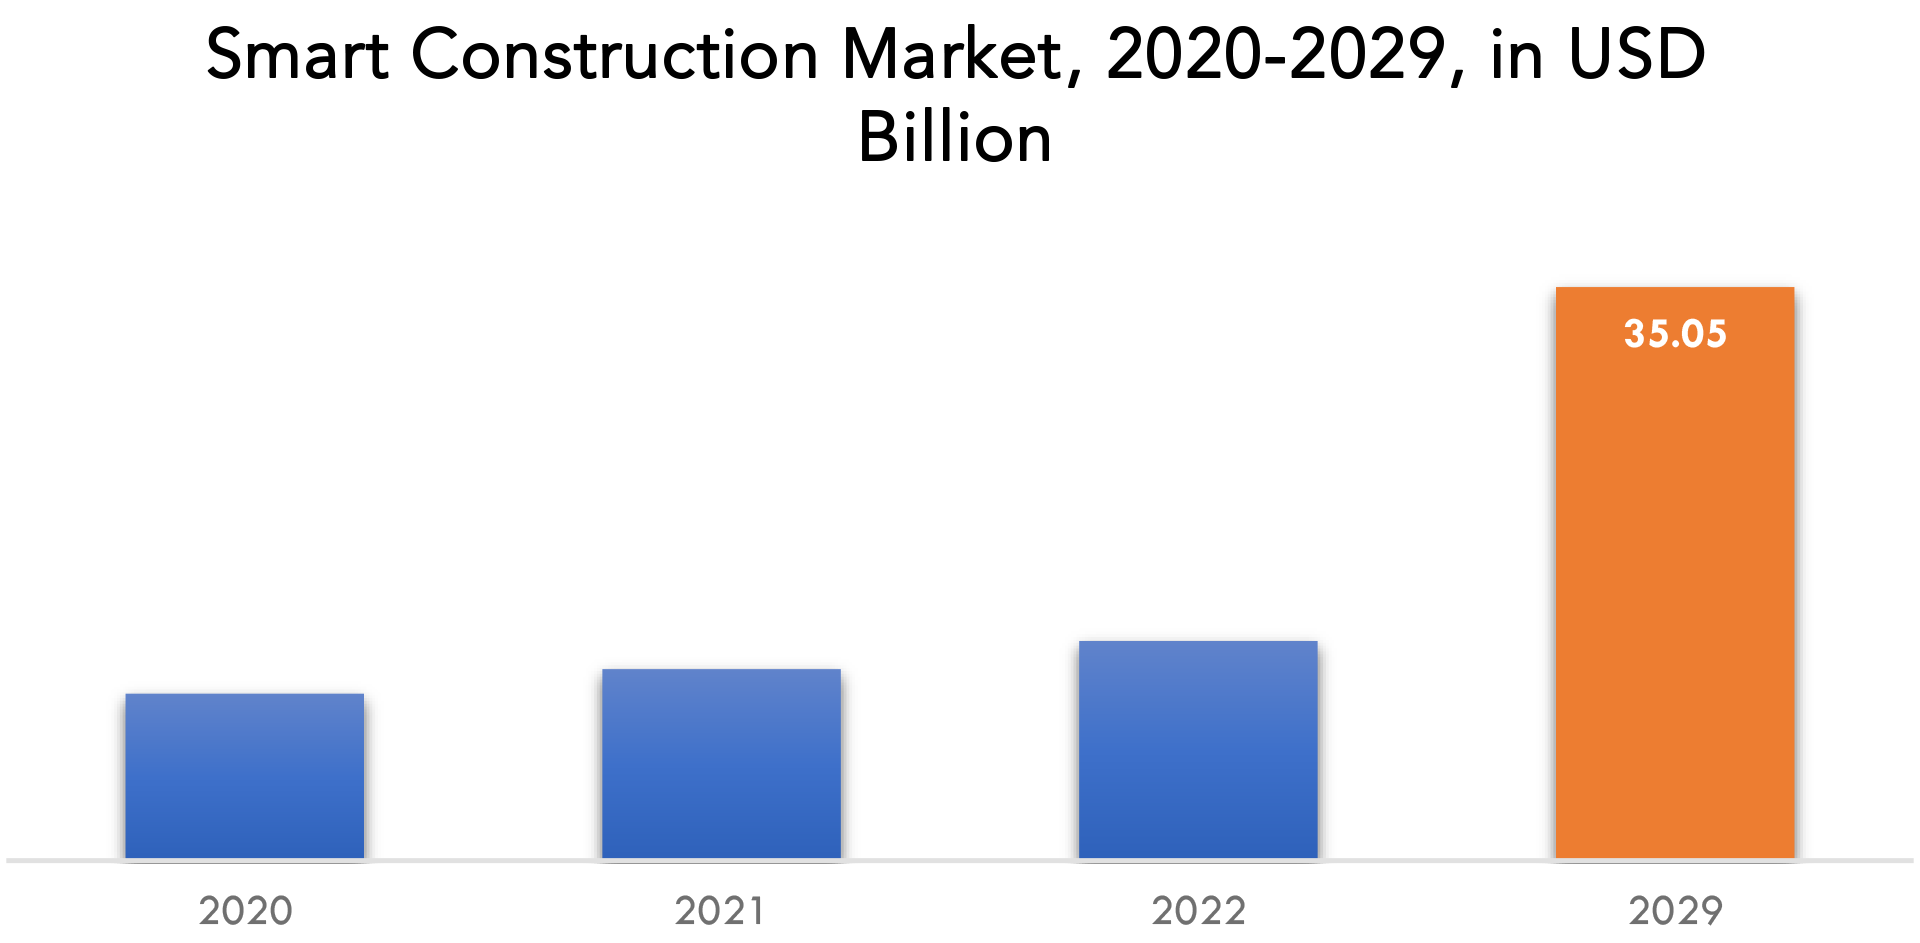
Smart Construction Market Players
The smart construction market key players include Trimble Inc., Oracle Corporation, Bentley Systems Inc., Hexagon AB, Caterpillar Inc., SAP SE, Hitachi Ltd., Schneider Electric SE, IBM Corporation, Honeywell International Inc. For corporate expansion, these key leaders are implementing strategic formulations such as new product development and commercialization, commercial expansion, and distribution agreements. Moreover, these participants are substantially spending on product development, which is fueling revenue generation. Industry Development: February 2020 – Honeywell International Inc. launched a cloud-based Forge Energy Optimization, an autonomous sustainability solution to manage energy consumption. The building solution aims to reduce energy consumption, lower carbon footprints, double-digit energy saving, and more. February 2021 – Oracle announced Oracle Construction Intelligence Cloud Service, a new suite of AI and analytics applications for the engineering and construction industry. Construction projects often run into problems that impact productivity, safety, and profitability. The new suite used machine learning to continually analyze project data managed in Oracle Construction and Engineering solutions to identify these potential risks and inefficiencies early, helping organizations make better decisions.Who Should Buy? Or Key stakeholders
- Investors
- Raw Materials Manufacturer
- Supplier and Distributor
- Construction Companies
- Research Organizations
- Regulatory Authorities
- Institutional & retail players
- Others
Smart Construction Market Regional Analysis
The Smart Construction Market by region includes North America, Asia-Pacific (APAC), Europe, South America, and Middle East & Africa (MEA).- North America: includes the US, Canada, Mexico
- Asia Pacific: includes China, Japan, South Korea, India, Australia, ASEAN, and Rest of APAC
- Europe: includes the UK, Germany, France, Italy, Spain, Russia, and the Rest of Europe
- South America: includes Brazil, Argentina, and Rest of South America
- Middle East & Africa: includes Turkey, UAE, Saudi Arabia, South Africa, and the Rest of MEA
Key Market Segments: Smart Construction Market
Smart Construction Market By Type, 2020-2029, (USD Billion).- On-Site Visualization
- Fleet Tracking
- Construction Simulation
- Intelligent Control
- Construction
- Transportation
- Mining
- North America
- Asia Pacific
- Europe
- South America
- Middle East And Africa
Exactitude Consultancy Services Key Objectives:
- Increasing sales and market share
- Developing new technology
- Improving profitability
- Entering new markets
- Enhancing brand reputation
Key Question Answered
- What is the expected growth rate of the smart construction market over the next 7 years?
- Who are the major players in the smart construction market and what is their market share?
- What are the end-user industries driving demand for market and what is their outlook?
- What are the opportunities for growth in emerging markets such as Asia-pacific, middle east, and Africa?
- How is the economic environment affecting the smart construction market, including factors such as interest rates, inflation, and exchange rates?
- What is the expected impact of government policies and regulations on the smart construction market?
- What is the current and forecasted size and growth rate of the global smart construction market?
- What are the key drivers of growth in the smart construction market?
- What are the distribution channels and supply chain dynamics in the smart construction market?
- What are the technological advancements and innovations in the smart construction market and their impact on product development and growth?
- What are the regulatory considerations and their impact on the market?
- What are the challenges faced by players in the smart construction market and how are they addressing these challenges?
- What are the opportunities for growth and expansion in the smart construction market?
- What are the product offerings and specifications of leading players in the market?
- What is the pricing trend of smart construction in the market and what is the impact of raw material prices on the price trend?
- INTRODUCTION
- MARKET DEFINITION
- MARKET SEGMENTATION
- RESEARCH TIMELINES
- ASSUMPTIONS AND LIMITATIONS
- RESEARCH METHODOLOGY
- DATA MINING
- SECONDARY RESEARCH
- PRIMARY RESEARCH
- SUBJECT-MATTER EXPERTS’ ADVICE
- QUALITY CHECKS
- FINAL REVIEW
- DATA TRIANGULATION
- BOTTOM-UP APPROACH
- TOP-DOWN APPROACH
- RESEARCH FLOW
- DATA SOURCES
- DATA MINING
- EXECUTIVE SUMMARY
- MARKET OVERVIEW
- GLOBAL SMART CONSTRUCTION MARKET OUTLOOK
- MARKET DRIVERS
- MARKET RESTRAINTS
- MARKET OPPORTUNITIES
- IMPACT OF COVID-19 ON SMART CONSTRUCTION MARKET
- PORTER’S FIVE FORCES MODEL
- THREAT FROM NEW ENTRANTS
- THREAT FROM SUBSTITUTES
- BARGAINING POWER OF SUPPLIERS
- BARGAINING POWER OF CUSTOMERS
- DEGREE OF COMPETITION
- INDUSTRY VALUE CHAIN ANALYSIS
- GLOBAL SMART CONSTRUCTION MARKET OUTLOOK
- GLOBAL SMART CONSTRUCTION MARKET BY TYPE, 2020-2029, (USD BILLION).
- ON-SITE VISUALIZATION
- FLEET TRACKING
- CONSTRUCTION SIMULATION
- INTELLIGENT CONTROL
- GLOBAL SMART CONSTRUCTION MARKET BY APPLICATION, 2020-2029, (USD BILLION).
- CONSTRUCTION
- TRANSPORTATION
- MINING
- GLOBAL SMART CONSTRUCTION MARKET BY REGION, 2020-2029, (USD BILLION).
- NORTH AMERICA
- US
- CANADA
- MEXICO
- SOUTH AMERICA
- BRAZIL
- ARGENTINA
- COLOMBIA
- REST OF SOUTH AMERICA
- EUROPE
- GERMANY
- UK
- FRANCE
- ITALY
- SPAIN
- RUSSIA
- REST OF EUROPE
- ASIA PACIFIC
- INDIA
- CHINA
- JAPAN
- SOUTH KOREA
- AUSTRALIA
- SOUTH-EAST ASIA
- REST OF ASIA PACIFIC
- MIDDLE EAST AND AFRICA
- UAE
- SAUDI ARABIA
- SOUTH AFRICA
- REST OF MIDDLE EAST AND AFRICA
- NORTH AMERICA
- COMPANY PROFILES*(BUSINESS OVERVIEW, COMPANY SNAPSHOT, PRODUCTS OFFERED, RECENT DEVELOPMENTS)
- TRIMBLE INC.
- ORACLE CORPORATION
- BENTLEY SYSTEMS INC.
- HEXAGON AB
- CATERPILLAR INC.
- SAP SE
- HITACHI LTD.
- SCHNEIDER ELECTRIC SE
- IBM CORPORATION
- HONEYWELL INTERNATIONAL INC.
*THE COMPANY LIST IS INDICATIVE
LIST OF TABLES
TABLE 1 GLOBAL SMART CONSTRUCTION MARKET BY TYPE (USD BILLION), 2020-2029
TABLE 2 GLOBAL SMART CONSTRUCTION MARKET BY APPLICATION (USD BILLION), 2020-2029
TABLE 3 GLOBAL SMART CONSTRUCTION MARKET BY REGION (USD BILLION), 2020-2029
TABLE 4 NORTH AMERICA SMART CONSTRUCTION MARKET BY TYPE (USD BILLION), 2020-2029
TABLE 5 NORTH AMERICA SMART CONSTRUCTION MARKET BY APPLICATION (USD BILLION), 2020-2029
TABLE 6 NORTH AMERICA SMART CONSTRUCTION MARKET BY COUNTRY (USD BILLION), 2020-2029
TABLE 7 US SMART CONSTRUCTION MARKET BY TYPE (USD BILLION), 2020-2029
TABLE 8 US SMART CONSTRUCTION MARKET BY APPLICATION (USD BILLION), 2020-2029
TABLE 9 CANADA SMART CONSTRUCTION MARKET BY TYPE (BILLION), 2020-2029
TABLE 10 CANADA SMART CONSTRUCTION MARKET BY APPLICATION (USD BILLION), 2020-2029
TABLE 11 MEXICO SMART CONSTRUCTION MARKET BY TYPE (USD BILLION), 2020-2029
TABLE 12 MEXICO SMART CONSTRUCTION MARKET BY APPLICATION (USD BILLION), 2020-2029
TABLE 13 SOUTH AMERICA SMART CONSTRUCTION MARKET BY TYPE (USD BILLION), 2020-2029
TABLE 14 SOUTH AMERICA SMART CONSTRUCTION MARKET BY APPLICATION (USD BILLION), 2020-2029
TABLE 15 SOUTH AMERICA SMART CONSTRUCTION MARKET BY COUNTRY (USD BILLION), 2020-2029
TABLE 16 BRAZIL SMART CONSTRUCTION MARKET BY TYPE (USD BILLION), 2020-2029
TABLE 17 BRAZIL SMART CONSTRUCTION MARKET BY APPLICATION (USD BILLION), 2020-2029
TABLE 18 ARGENTINA SMART CONSTRUCTION MARKET BY TYPE (USD BILLION), 2020-2029
TABLE 19 ARGENTINA SMART CONSTRUCTION MARKET BY APPLICATION (USD BILLION), 2020-2029
TABLE 20 REST OF SOUTH AMERICA SMART CONSTRUCTION MARKET BY TYPE (USD BILLION), 2020-2029
TABLE 21 REST OF SOUTH AMERICA SMART CONSTRUCTION MARKET BY APPLICATION (USD BILLION), 2020-2029
TABLE 22 ASIA -PACIFIC SMART CONSTRUCTION MARKET BY TYPE (USD BILLION), 2020-2029
TABLE 23 ASIA -PACIFIC SMART CONSTRUCTION MARKET BY APPLICATION (USD BILLION), 2020-2029
TABLE 24 ASIA -PACIFIC SMART CONSTRUCTION MARKET BY COUNTRY (USD BILLION), 2020-2029
TABLE 25 INDIA SMART CONSTRUCTION MARKET BY TYPE (USD BILLION), 2020-2029
TABLE 26 INDIA SMART CONSTRUCTION MARKET BY APPLICATION (USD BILLION), 2020-2029
TABLE 27 CHINA SMART CONSTRUCTION MARKET BY TYPE (USD BILLION), 2020-2029
TABLE 28 CHINA SMART CONSTRUCTION MARKET BY APPLICATION (USD BILLION), 2020-2029
TABLE 29 JAPAN SMART CONSTRUCTION MARKET BY TYPE (USD BILLION), 2020-2029
TABLE 30 JAPAN SMART CONSTRUCTION MARKET BY APPLICATION (USD BILLION), 2020-2029
TABLE 31 SOUTH KOREA SMART CONSTRUCTION MARKET BY TYPE (USD BILLION), 2020-2029
TABLE 32 SOUTH KOREA SMART CONSTRUCTION MARKET BY APPLICATION (USD BILLION), 2020-2029
TABLE 33 AUSTRALIA SMART CONSTRUCTION MARKET BY TYPE (USD BILLION), 2020-2029
TABLE 34 AUSTRALIA HYBRID FUNCTIONBY APPLICATION (USD BILLION), 2020-2029
TABLE 35 AUSTRALIA SMART CONSTRUCTION MARKET BY FUNCTION (USD BILLION), 2020-2029
TABLE 36 AUSTRALIA SMART CONSTRUCTION MARKET BY ORGANIZATION SIZE (USD BILLION), 2020-2029
TABLE 37 REST OF ASIA PACIFIC SMART CONSTRUCTION MARKET BY TYPE (USD BILLION), 2020-2029
TABLE 38 REST OF ASIA PACIFIC HYBRID FUNCTIONBY APPLICATION (USD BILLION), 2020-2029
TABLE 39 EUROPE SMART CONSTRUCTION MARKET BY TYPE (USD BILLION), 2020-2029
TABLE 40 EUROPE SMART CONSTRUCTION MARKET BY APPLICATION (USD BILLION), 2020-2029
TABLE 41 EUROPE SMART CONSTRUCTION MARKET BY COUNTRY (USD BILLION), 2020-2029
TABLE 42 GERMANY SMART CONSTRUCTION MARKET BY TYPE (USD BILLION), 2020-2029
TABLE 43 GERMANY SMART CONSTRUCTION MARKET BY APPLICATION (USD BILLION), 2020-2029
TABLE 44 UK SMART CONSTRUCTION MARKET BY TYPE (USD BILLION), 2020-2029
TABLE 45 UK SMART CONSTRUCTION MARKET BY APPLICATION (USD BILLION), 2020-2029
TABLE 46 FRANCE SMART CONSTRUCTION MARKET BY TYPE (USD BILLION), 2020-2029
TABLE 47 FRANCE SMART CONSTRUCTION MARKET BY APPLICATION (USD BILLION), 2020-2029
TABLE 48 ITALY SMART CONSTRUCTION MARKET BY TYPE (USD BILLION), 2020-2029
TABLE 49 ITALY SMART CONSTRUCTION MARKET BY APPLICATION (USD BILLION), 2020-2029
TABLE 50 SPAIN SMART CONSTRUCTION MARKET BY TYPE (USD BILLION), 2020-2029
TABLE 51 SPAIN SMART CONSTRUCTION MARKET BY APPLICATION (USD BILLION), 2020-2029
TABLE 52 REST OF EUROPE SMART CONSTRUCTION MARKET BY TYPE (USD BILLION), 2020-2029
TABLE 53 REST OF EUROPE SMART CONSTRUCTION MARKET BY APPLICATION (USD BILLION), 2020-2029
TABLE 54 MIDDLE EAST AND AFRICA SMART CONSTRUCTION MARKET BY TYPE (USD BILLION), 2020-2029
TABLE 55 MIDDLE EAST AND AFRICA SMART CONSTRUCTION MARKET BY APPLICATION (USD BILLION), 2020-2029
TABLE 56 MIDDLE EAST ABD AFRICA SMART CONSTRUCTION MARKET BY COUNTRY (USD BILLION), 2020-2029
TABLE 57 UAE SMART CONSTRUCTION MARKET BY TYPE (USD BILLION), 2020-2029
TABLE 58 UAE SMART CONSTRUCTION MARKET BY APPLICATION (USD BILLION), 2020-2029
TABLE 59 SOUTH AFRICA SMART CONSTRUCTION MARKET BY TYPE (USD BILLION), 2020-2029
TABLE 60 SOUTH AFRICA SMART CONSTRUCTION MARKET BY APPLICATION (USD BILLION), 2020-2029
TABLE 61 REST OF MIDDLE EAST AND AFRICA SMART CONSTRUCTION MARKET BY TYPE (USD BILLION), 2020-2029
TABLE 62 REST OF MIDDLE EAST AND AFRICA SMART CONSTRUCTION MARKET BY APPLICATION (USD BILLION), 2020-2029
LIST OF FIGURES
FIGURE 1 MARKET DYNAMICS
FIGURE 2 MARKET SEGMENTATION
FIGURE 3 REPORT TIMELINES: YEARS CONSIDERED
FIGURE 4 DATA TRIANGULATION
FIGURE 5 BOTTOM-UP APPROACH
FIGURE 6 TOP-DOWN APPROACH
FIGURE 7 RESEARCH FLOW
FIGURE 8 GLOBAL SMART CONSTRUCTION MARKET BY TYPE, USD BILLION, 2020-2029
FIGURE 9 GLOBAL SMART CONSTRUCTION MARKET BY APPLICATION, USD BILLION, 2020-2029
FIGURE 10 GLOBAL SMART CONSTRUCTION MARKET BY REGION, USD BILLION, 2020-2029
FIGURE 11 PORTER’S FIVE FORCES MODEL
FIGURE 12 GLOBAL SMART CONSTRUCTION MARKET BY TYPE, USD BILLION, 2021
FIGURE 13 GLOBAL SMART CONSTRUCTION MARKET BY APPLICATION, USD BILLION, 2021
FIGURE 14 GLOBAL SMART CONSTRUCTION MARKET BY REGION, USD BILLION, 2021
FIGURE 15 MARKET SHARE ANALYSIS
FIGURE 16 TRIMBLE INC.: COMPANY SNAPSHOT
FIGURE 17 ORACLE CORPORATION: COMPANY SNAPSHOT
FIGURE 18 BENTLEY SYSTEMS INC.: COMPANY SNAPSHOT
FIGURE 19 HEXAGON AB: COMPANY SNAPSHOT
FIGURE 20 CATERPILLAR INC.: COMPANY SNAPSHOT
FIGURE 21 SAP SE: COMPANY SNAPSHOT
FIGURE 22 HITACHI LTD.: COMPANY SNAPSHOT
FIGURE 23 SCHNEIDER ELECTRIC SE: COMPANY SNAPSHOT
FIGURE 24 IBM CORPORATION: COMPANY SNAPSHOT
FIGURE 25 HONEYWELL INTERNATIONAL INC.: COMPANY SNAPSHOT
DOWNLOAD FREE SAMPLE REPORT
License Type
SPEAK WITH OUR ANALYST
Want to know more about the report or any specific requirement?
WANT TO CUSTOMIZE THE REPORT?
Our Clients Speak
We asked them to research ‘ Equipment market’ all over the world, and their whole arrangement was helpful to us. thehealthanalytics.com insightful analysis and reports contributed to our current analysis and in creating a future strategy. Besides, the te
Yosuke Mitsui
Senior Associate Construction Equipment Sales & Marketing
We asked them to research ‘Equipment market’ all over the world, and their whole arrangement was helpful to us. thehealthanalytics.com insightful analysis and reports contributed to our current analysis and in creating a future strategy. Besides, the te


