

Base Year Value ()
x.x %
x.x %
CAGR ()
x.x %
x.x %
Forecast Year Value ()
x.x %
x.x %
Historical Data Period
Largest Region
Forecast Period
4K Technology Market Size by Type (TV, Camera, Digital Signage), by Application (Television and Consumer Media, Movie Projection) and by Region Global Trends and Forecast From 2022 To 2029
Instant access to hundreds of data points and trends
- Market estimates from 2014-2029
- Competitive analysis, industry segmentation, financial benchmarks
- Incorporates SWOT, Porter's Five Forces and risk management frameworks
- PDF report or online database with Word, Excel and PowerPoint export options
- 100% money back guarantee
4K Technology Market Overview
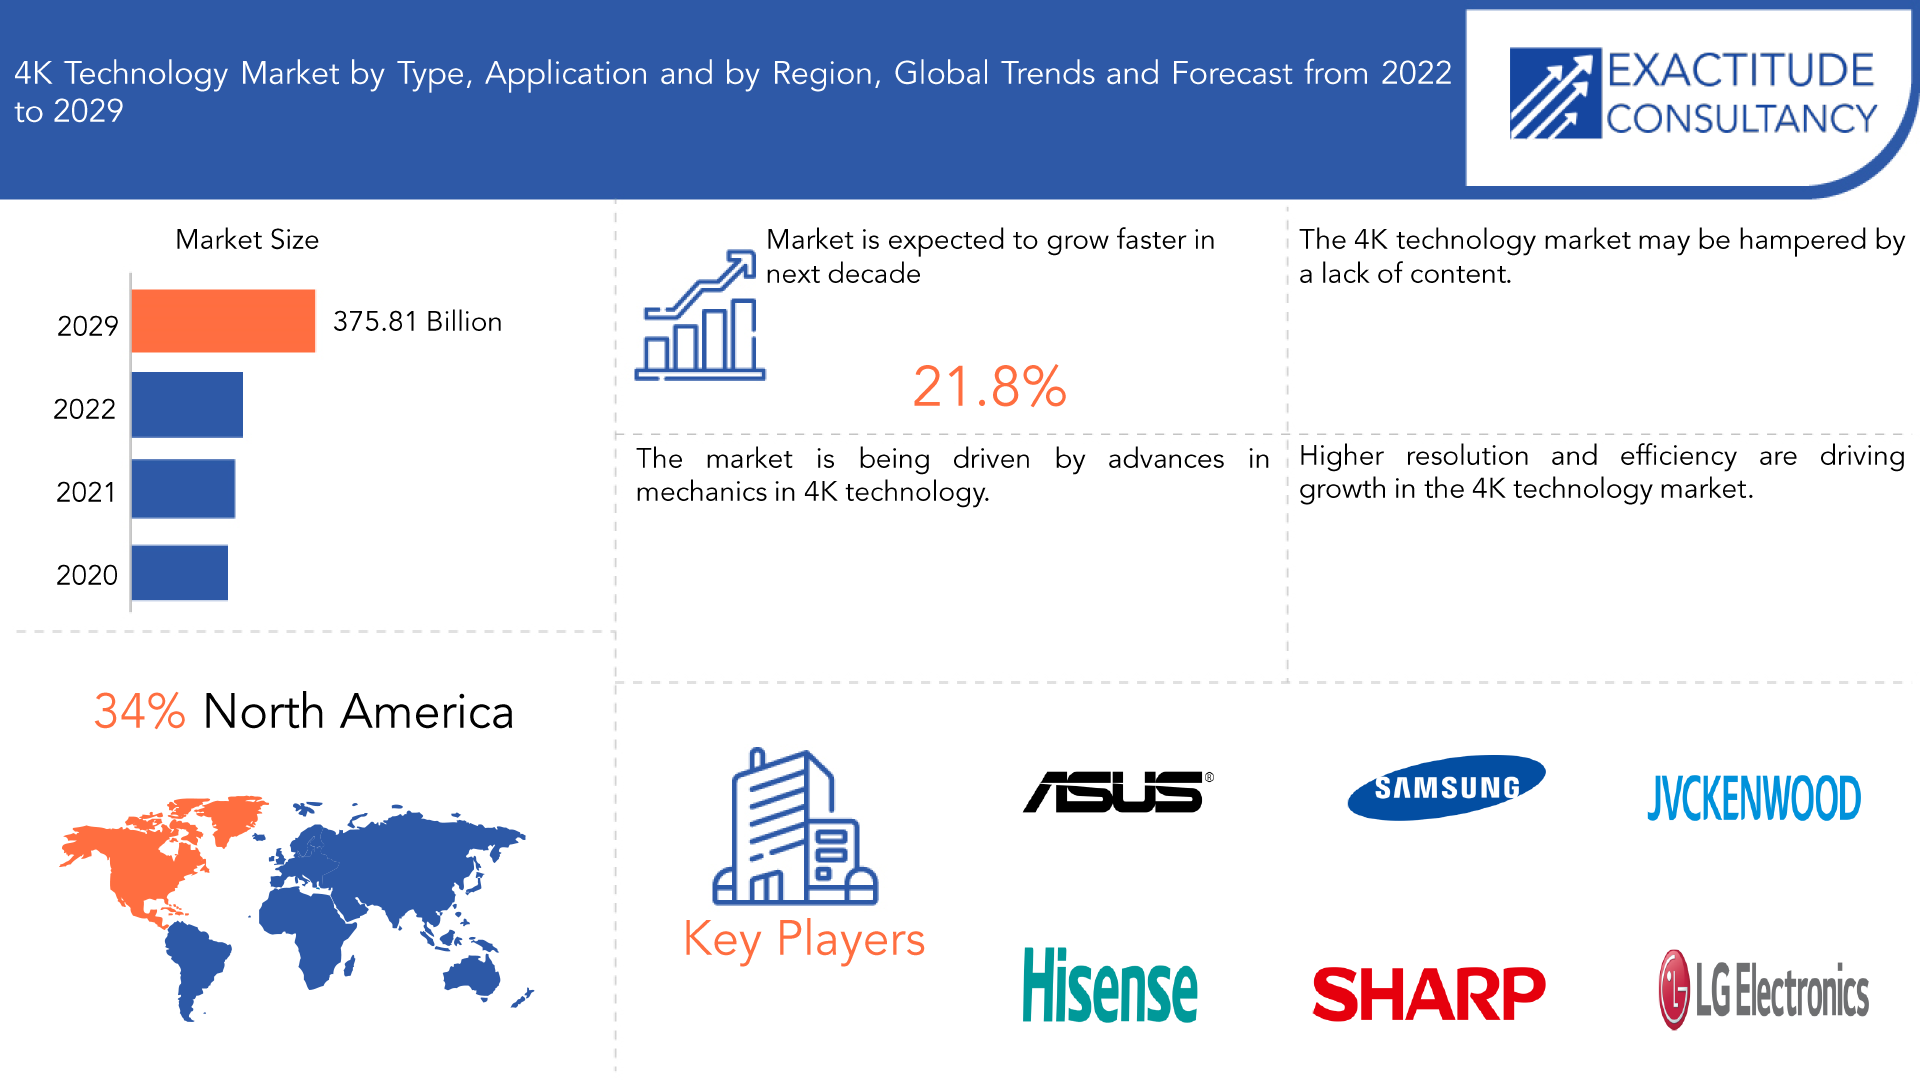
Displays and content with a resolution of at least 3840 x 2160 pixels, or four times that of traditional 1080p HD displays, are referred to as 4K technology. Sharper, more detailed images are produced, making them suitable for a variety of applications such as televisions, computer monitors, gaming systems, and professional video production. An increase in 4K content availability, such as movies, TV shows, and streaming services, is a major driver in the 4K technology market.
The market for higher-resolution exhibits is being transformed by the technological revolution. The horizontal and vertical resolutions of 4K technology are 3840 or 4096 pixels and 2190 pixels, respectively. Its main advantage is that it has a higher resolution, which provides better quality. The digital market has changed as a result of the introduction of 4K TV, projectors, and cameras. A wide variety of movies, TV shows, documentaries, and videos are available in the content recorded by 4K pixels adopted devices. It efficiently delivers 4K resolution to audiences.
| ATTRIBUTE | DETAILS |
| Study period | 2020-2029 |
| Base year | 2021 |
| Estimated year | 2022 |
| Forecasted year | 2022-2029 |
| Historical period | 2018-2020 |
| Unit | Value (USD Billion) |
| Segmentation | By Type, By Application, By Region. |
| By Type
|
|
| By Application
|
|
| By Region
|
|
The global 4K Technology market is expected to grow at a 21.8% CAGR from 2022 to 2029, from USD 63.70 billion in 2020. The 4K technology market has expanded rapidly in recent years as a result of rising demand for high-quality video content and the availability of cutting-edge technology.
4K technology is gradually supplanting HD technology in TV screens, computer monitors, cameras, and projectors. Video signals with a horizontal resolution of 4,000 pixels or higher are referred to as 4K. A 4K display has a resolution of 4096 x 2160 pixels (approximately a 1.9:1 aspect ratio). In a full HD resolution produced by Blu-ray technology, a 4K image has nearly 8.3 million pixels, whereas a 1080p image has slightly more than 2 million pixels. The revolution in compression artefacts and image resolution technology is changing the market dynamics of high-resolution displays and digital signage.
A different physical product makes use of 4K technology. The advancement of technology is propelling market growth. 4K cameras currently capture film videos with a single frame for a high-resolution image allows photographers to capture videos without sacrificing quality. Users benefit from the 4K resolution's high quality and detailed gaming features. 4K laptops provide users with a large amount of storage space for software interfaces. On the other hand, the main factors impeding the growth of the 4K technology market are a lack of 4K content, a disparity between screen size and viewing distance, and broadcasting issues with 4K content.
Recent Developments:
- The growing availability of 4K content from streaming services like Netflix and Amazon Prime Video, as well as the release of 4K Blu-ray discs, indicates that it is becoming more popular in healthcare for medical imaging purposes.
- 8K technology has recently been developed, providing higher resolution than 4K at a higher cost.
- Furthermore, 4K displays now include AI technology for improved image quality and features like upscaling lower-resolution content to 4K resolution.
[caption id="attachment_22195" align="aligncenter" width="1920"]
Frequently Asked Questions
• What is the worth of global 4K Technology market?
The 4K Technology market reached USD 63.70 billion in 2020 and is expected to grow at a CAGR of more than 21.8% through 2029, owing to the increasing development in the new technology.
• What are the upcoming trends of 4K Technology market, globally?
The upcoming trend in the 4K Technology market is an opportunity for market growth.
• What is the CAGR of 4K Technology market?
The global 4K Technology market registered a CAGR of 21.8% from 2022 to 2029.
• Which are the top companies to hold the market share in 4K Technology market?
Key players profiled in the report include AsusTek Corp, Samsung Electronics Corp, JVC Kenwood Corp, Hisense, Sharp, LG Electronics, Hong Kong Skyworth Digital Holdings Ltd, Innolux Corp, Canon Inc. and Sony Corp.
• Which is the largest regional market for 4K Technology market?
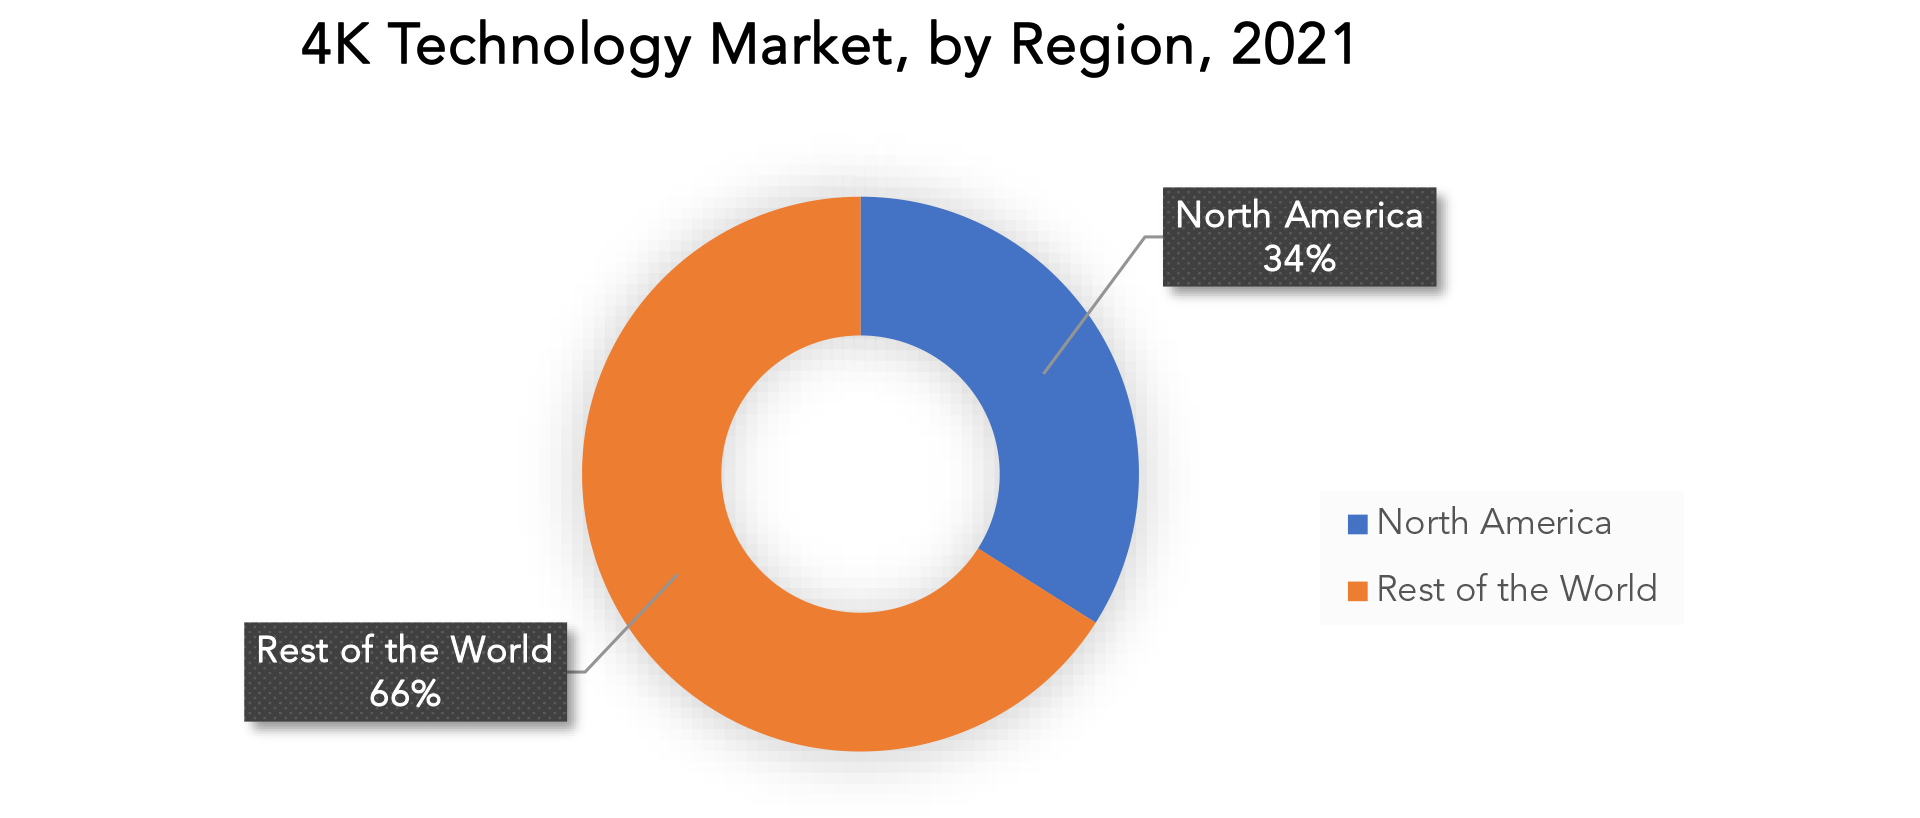
The North America 4K Technology market is expected to grow at a 34% CAGR during the forecast period (2022 - 2029). It’s driven by the increasing demand for high-quality video content and the presence of key market players.
4K Technology Market Segment Analysis
Televisions, projectors, digital cameras, monitors, and other products comprise the 4K technology market. Televisions are the largest segment of the 4K technology market, driven by rising demand for high-quality video content and the increasing popularity of 4K TVs among consumers. The projector market is also expanding rapidly, owing to the increasing use of 4K projectors in a variety of applications such as cinemas, sports arenas, and other public places. The TV industry held a market share of over 35.2% in 2021. In the global 4k technology market, television holds the largest market share. Thanks to 4K TVs, viewers can now see objects with exquisite detail and crystal-clear clarity. Users can see the finer details of the images and videos that are displayed on the screen thanks to advances in lighting technology. The adoption of cutting-edge technology, which offers high resolution and a superior viewing experience, is fueling the growth of the 4K TV market. Consumer electronics, aerospace and defense, healthcare, education, and other industries are among the application segments of the 4K technology market. The largest application segment is consumer electronics, which is being driven by the increasing adoption of 4K displays and TVs in homes. The aerospace and defense segment are also a significant application segment, with the increasing use of 4K displays in military and surveillance applications driving this trend. The entertainment and media industry segment are predicted to grow at the highest CAGR of 7.4% from 2022 to 2029, by application. Due to a number of factors, including the growing demand for a better gaming experience, enriched entertainment, and the expanding availability of 4K content, the entertainment and media industry is predicted to remain one of the primary applications of 4K technology. [caption id="attachment_22196" align="aligncenter" width="1920"]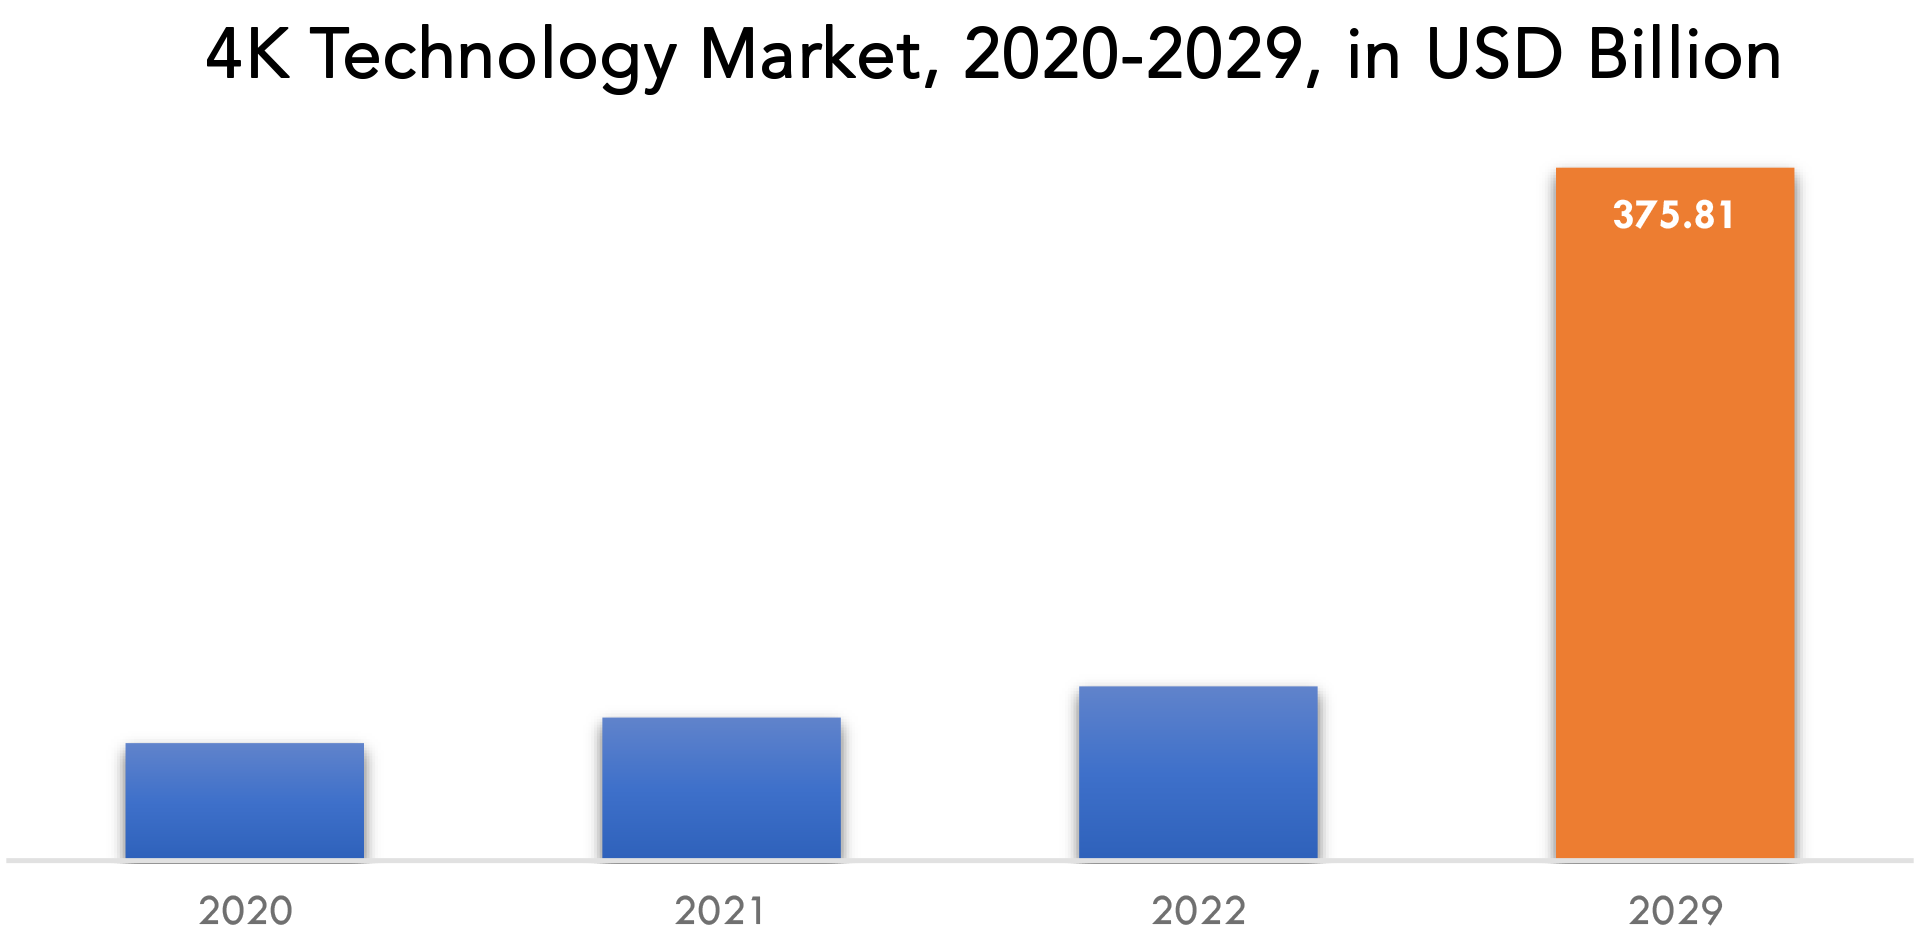
4K Technology Market Players
Key players involved in 4K Technology market are AsusTek Corp, Samsung Electronics Corp, JVC Kenwood Corp, Hisense, Sharp, LG Electronics, Hong Kong Skyworth Digital Holdings Ltd, Innolux Corp, Canon Inc. and Sony Corp. Mergers and acquisitions, joint ventures, capacity expansions, significant distribution, and branding decisions by established industry players to boost market share and regional presence. They are also engaged in continuous R&D activities to develop new Product Types and are focused on expanding the Product Type portfolio. This is expected to increase competition and pose a threat to new market entrants. Industry Developments: 14 April, 2023, Innolux introduces the first smart EV charger and joins forces with strategic partners to create a total smart mobility ecosystem. 11 April, 2023, Sony launched a service called "360 Virtual Mixing Environment" for immersive sound production.Who Should Buy? Or Key stakeholders
- Research and development
- Manufacturing
- End Use industries
- Automotive
- Government
- Healthcare
- Production Industry and manufacturing
4K Technology Market Regional Analysis
Geographically, the 4K Technology market is segmented into North America, South America, Europe, APAC and MEA.- North America: includes the US, Canada, Mexico
- Europe: includes UK, Germany, France, Italy, Spain, Russia, and Rest of Europe
- Asia Pacific: includes China, Japan, South Korea, India, Australia, ASEAN and Rest of APAC
- South America: includes Brazil, Argentina and Rest of South America
- Middle East & Africa: includes Turkey, UAE, Saudi Arabia, South Africa, and Rest of MEA
Key Market Segments: 4K Technology Market
4k Technology Market Type, 2020-2029, (USD Billion)- Tv
- Camera
- Digital Signage
- Television And Consumer Media
- Movie Projection
- North America
- Europe
- Asia Pacific
- South America
- Middle East And Africa
Exactitude Consultancy Services Key Objectives:
- Increasing sales and market share
- Developing new End user
- Improving profitability
- Entering new markets
- Enhancing brand reputation
Key Question Answered
- What is the expected growth rate of the 4K Technology market over the next 5 years?
- Who are the major players in the 4K Technology market and what is their market share?
- What are the end-user industries driving demand for market and what is their outlook?
- What are the opportunities for growth in emerging markets such as Asia-Pacific, Middle East, and Africa?
- How is the economic environment affecting the 4K Technology market, including factors such as interest rates, inflation, and exchange rates?
- What is the expected impact of government policies and regulations on the 4K Technology market?
- What is the current and forecasted size and growth rate of the global 4K Technology market?
- What are the key drivers of growth in the 4K Technology market?
- Who are the major players in the market and what is their market share?
- What are the distribution channels and supply chain dynamics in the 4K Technology market?
- What are the technological advancements and innovations in the 4K Technology market and their impact on product development and growth?
- What are the regulatory considerations and their impact on the market?
- What are the challenges faced by players in the 4K Technology market and how are they addressing these challenges?
- What are the opportunities for growth and expansion in the 4K Technology market?
- What are the service offerings and specifications of leading players in the market?
- INTRODUCTION
- MARKET DEFINITION
- MARKET SEGMENTATION
- RESEARCH TIMELINES
- ASSUMPTIONS AND LIMITATIONS
- RESEARCH METHODOLOGY
- DATA MINING
- SECONDARY RESEARCH
- PRIMARY RESEARCH
- SUBJECT-MATTER EXPERTS’ ADVICE
- QUALITY CHECKS
- FINAL REVIEW
- DATA TRIANGULATION
- BOTTOM-UP APPROACH
- TOP-DOWN APPROACH
- RESEARCH FLOW
- DATA SOURCES
- DATA MINING
- EXECUTIVE SUMMARY
- MARKET OVERVIEW
- GLOBAL 4K TECHNOLOGY MARKET OUTLOOK
- MARKET DRIVERS
- MARKET RESTRAINTS
- MARKET OPPORTUNITIES
- IMPACT OF COVID-19 ON 4K TECHNOLOGY MARKET
- PORTER’S FIVE FORCES MODEL
- THREAT FROM NEW ENTRANTS
- THREAT FROM SUBSTITUTES
- BARGAINING POWER OF SUPPLIERS
- BARGAINING POWER OF CUSTOMERS
- DEGREE OF COMPETITION
- INDUSTRY VALUE CHAIN ANALYSIS
- GLOBAL 4K TECHNOLOGY MARKET OUTLOOK
- GLOBAL 4K TECHNOLOGY MARKET BY TYPE, 2020-2029, (USD BILLION)
- TV
- CAMERA
- DIGITAL SIGNAGE
- GLOBAL 4K TECHNOLOGY MARKET BY APPLICATION, 2020-2029, (USD BILLION)
- TELEVISION AND CONSUMER MEDIA
- MOVIE PROJECTION
- GLOBAL DRUG TESTING MARKET BY REGION, 2020-2029, (USD BILLION)
- NORTH AMERICA
- US
- CANADA
- MEXICO
- SOUTH AMERICA
- BRAZIL
- ARGENTINA
- COLOMBIA
- REST OF SOUTH AMERICA
- EUROPE
- GERMANY
- UK
- FRANCE
- ITALY
- SPAIN
- RUSSIA
- REST OF EUROPE
- ASIA PACIFIC
- INDIA
- CHINA
- JAPAN
- SOUTH KOREA
- AUSTRALIA
- SOUTH-EAST ASIA
- REST OF ASIA PACIFIC
- MIDDLE EAST AND AFRICA
- UAE
- SAUDI ARABIA
- SOUTH AFRICA
- REST OF MIDDLE EAST AND AFRICA
- NORTH AMERICA
- COMPANY PROFILES*(BUSINESS OVERVIEW, COMPANY SNAPSHOT, PRODUCTS OFFERED, RECENT DEVELOPMENTS)
- ASUSTEK CORP
- SAMSUNG ELECTRONICS CORP
- JVC KENWOOD CORP
- HISENSE
- SHARP
- LG ELECTRONICS
- HONG KONG SKYWORTH DIGITAL HOLDINGS LTD
- INNOLUX CORP
- CANON INC.
- SONY CORP.
*THE COMPANY LIST IS INDICATIVE
LIST OF TABLES
TABLE 1 GLOBAL 4K TECHNOLOGY MARKET BY TYPE (USD BILLION) 2020-2029
TABLE 2 GLOBAL 4K TECHNOLOGY MARKET BY APPLICATION (USD BILLION) 2020-2029
TABLE 3 GLOBAL 4K TECHNOLOGY MARKET BY REGION (USD BILLION) 2020-2029
TABLE 4 NORTH AMERICA 4K TECHNOLOGY MARKET BY TYPE (USD BILLION) 2020-2029
TABLE 5 NORTH AMERICA 4K TECHNOLOGY MARKET BY APPLICATION (USD BILLION) 2020-2029
TABLE 6 NORTH AMERICA 4K TECHNOLOGY MARKET BY COUNTRY (USD BILLION) 2020-2029
TABLE 7 US 4K TECHNOLOGY MARKET BY TYPE (USD BILLION) 2020-2029
TABLE 8 US 4K TECHNOLOGY MARKET BY APPLICATION (USD BILLION) 2020-2029
TABLE 9 CANADA 4K TECHNOLOGY MARKET BY TYPE (USD BILLION) 2020-2029
TABLE 10 CANADA 4K TECHNOLOGY MARKET BY APPLICATION (USD BILLION) 2020-2029
TABLE 11 MEXICO 4K TECHNOLOGY MARKET BY TYPE (USD BILLION) 2020-2029
TABLE 12 MEXICO 4K TECHNOLOGY MARKET BY APPLICATION (USD BILLION) 2020-2029
TABLE 13 SOUTH AMERICA 4K TECHNOLOGY MARKET BY TYPE (USD BILLION) 2020-2029
TABLE 14 SOUTH AMERICA 4K TECHNOLOGY MARKET BY APPLICATION (USD BILLION) 2020-2029
TABLE 15 SOUTH AMERICA 4K TECHNOLOGY MARKET BY COUNTRY (USD BILLION) 2020-2029
TABLE 16 BRAZIL 4K TECHNOLOGY MARKET BY TYPE (USD BILLION) 2020-2029
TABLE 17 BRAZIL 4K TECHNOLOGY MARKET BY APPLICATION (USD BILLION) 2020-2029
TABLE 18 ARGENTINA 4K TECHNOLOGY MARKET BY TYPE (USD BILLION) 2020-2029
TABLE 19 ARGENTINA 4K TECHNOLOGY MARKET BY APPLICATION (USD BILLION) 2020-2029
TABLE 20 COLUMBIA 4K TECHNOLOGY MARKET BY TYPE (USD BILLION) 2020-2029
TABLE 21 COLUMBIA 4K TECHNOLOGY MARKET BY APPLICATION (USD BILLION) 2020-2029
TABLE 22 REST OF SOUTH AMERICA 4K TECHNOLOGY MARKET BY TYPE (USD BILLION) 2020-2029
TABLE 23 REST OF SOUTH AMERICA 4K TECHNOLOGY MARKET BY APPLICATION (USD BILLION) 2020-2029
TABLE 24 ASIA PACIFIC 4K TECHNOLOGY MARKET BY TYPE (USD BILLION) 2020-2029
TABLE 25 ASIA PACIFIC 4K TECHNOLOGY MARKET BY APPLICATION (USD BILLION) 2020-2029
TABLE 26 ASIA PACIFIC 4K TECHNOLOGY MARKET BY COUNTRY (USD BILLION) 2020-2029
TABLE 27 INDIA 4K TECHNOLOGY MARKET BY TYPE (USD BILLION) 2020-2029
TABLE 28 INDIA 4K TECHNOLOGY MARKET BY APPLICATION (USD BILLION) 2020-2029
TABLE 29 CHINA 4K TECHNOLOGY MARKET BY TYPE (USD BILLION) 2020-2029
TABLE 30 CHINA 4K TECHNOLOGY MARKET BY APPLICATION (USD BILLION) 2020-2029
TABLE 31 JAPAN 4K TECHNOLOGY MARKET BY TYPE (USD BILLION) 2020-2029
TABLE 32 JAPAN 4K TECHNOLOGY MARKET BY APPLICATION (USD BILLION) 2020-2029
TABLE 33 SOUTH KOREA 4K TECHNOLOGY MARKET BY TYPE (USD BILLION) 2020-2029
TABLE 34 SOUTH KOREA 4K TECHNOLOGY MARKET BY APPLICATION (USD BILLION) 2020-2029
TABLE 35 AUSTRALIA 4K TECHNOLOGY MARKET BY TYPE (USD BILLION) 2020-2029
TABLE 36 AUSTRALIA 4K TECHNOLOGY MARKET BY APPLICATION (USD BILLION) 2020-2029
TABLE 37 SOUTH EAST ASIA 4K TECHNOLOGY MARKET BY TYPE (USD BILLION) 2020-2029
TABLE 38 SOUTH EAST ASIA 4K TECHNOLOGY MARKET BY APPLICATION (USD BILLION) 2020-2029
TABLE 39 REST OF ASIA PACIFIC 4K TECHNOLOGY MARKET BY TYPE (USD BILLION) 2020-2029
TABLE 40 REST OF ASIA PACIFIC 4K TECHNOLOGY MARKET BY APPLICATION (USD BILLION) 2020-2029
TABLE 41 EUROPE 4K TECHNOLOGY MARKET BY TYPE (USD BILLION) 2020-2029
TABLE 42 EUROPE 4K TECHNOLOGY MARKET BY APPLICATION (USD BILLION) 2020-2029
TABLE 43 EUROPE 4K TECHNOLOGY MARKET BY COUNTRY (USD BILLION) 2020-2029
TABLE 44 GERMANY 4K TECHNOLOGY MARKET BY TYPE (USD BILLION) 2020-2029
TABLE 45 GERMANY 4K TECHNOLOGY MARKET BY APPLICATION (USD BILLION) 2020-2029
TABLE 46 UK 4K TECHNOLOGY MARKET BY TYPE (USD BILLION) 2020-2029
TABLE 47 UK 4K TECHNOLOGY MARKET BY APPLICATION (USD BILLION) 2020-2029
TABLE 48 FRANCE 4K TECHNOLOGY MARKET BY TYPE (USD BILLION) 2020-2029
TABLE 49 FRANCE 4K TECHNOLOGY MARKET BY APPLICATION (USD BILLION) 2020-2029
TABLE 50 ITALY 4K TECHNOLOGY MARKET BY TYPE (USD BILLION) 2020-2029
TABLE 51 ITALY 4K TECHNOLOGY MARKET BY APPLICATION (USD BILLION) 2020-2029
TABLE 52 SPAIN 4K TECHNOLOGY MARKET BY TYPE (USD BILLION) 2020-2029
TABLE 53 SPAIN 4K TECHNOLOGY MARKET BY APPLICATION (USD BILLION) 2020-2029
TABLE 54 RUSSIA 4K TECHNOLOGY MARKET BY TYPE (USD BILLION) 2020-2029
TABLE 55 RUSSIA 4K TECHNOLOGY MARKET BY APPLICATION (USD BILLION) 2020-2029
TABLE 56 REST OF EUROPE 4K TECHNOLOGY MARKET BY TYPE (USD BILLION) 2020-2029
TABLE 57 REST OF EUROPE 4K TECHNOLOGY MARKET BY APPLICATION (USD BILLION) 2020-2029
TABLE 58 MIDDLE EAST & AFRICA 4K TECHNOLOGY MARKET BY TYPE (USD BILLION) 2020-2029
TABLE 59 MIDDLE EAST & AFRICA 4K TECHNOLOGY MARKET BY APPLICATION (USD BILLION) 2020-2029
TABLE 60 MIDDLE EAST & AFRICA 4K TECHNOLOGY MARKET BY COUNTRY (USD BILLION) 2020-2029
TABLE 61 UAE 4K TECHNOLOGY MARKET BY TYPE (USD BILLION) 2020-2029
TABLE 62 UAE 4K TECHNOLOGY MARKET BY APPLICATION (USD BILLION) 2020-2029
TABLE 63 SAUDI ARABIA 4K TECHNOLOGY MARKET BY TYPE (USD BILLION) 2020-2029
TABLE 64 SAUDI ARABIA 4K TECHNOLOGY MARKET BY APPLICATION (USD BILLION) 2020-2029
TABLE 65 SOUTH AFRICA 4K TECHNOLOGY MARKET BY TYPE (USD BILLION) 2020-2029
TABLE 66 SOUTH AFRICA 4K TECHNOLOGY MARKET BY APPLICATION (USD BILLION) 2020-2029
TABLE 67 REST OF MIDDLE EAST & AFRICA 4K TECHNOLOGY MARKET BY TYPE (USD BILLION) 2020-2029
TABLE 68 REST OF MIDDLE EAST & AFRICA 4K TECHNOLOGY MARKET BY APPLICATION (USD BILLION) 2020-2029
LIST OF FIGURES
FIGURE 1 MARKET DYNAMICS
FIGURE 2 MARKET SEGMENTATION
FIGURE 3 REPORT TIMELINES: YEARS CONSIDERED
FIGURE 4 DATA TRIANGULATION
FIGURE 5 BOTTOM-UP APPROACH
FIGURE 6 TOP-DOWN APPROACH
FIGURE 7 RESEARCH FLOW
FIGURE 8 GLOBAL 4K TECHNOLOGY MARKET BY TYPE, USD BILLION, 2020-2029
FIGURE 9 GLOBAL 4K TECHNOLOGY MARKET BY APPLICATION, USD BILLION, 2020-2029
FIGURE 10 GLOBAL 4K TECHNOLOGY MARKET BY REGION, USD BILLION, 2020-2029
FIGURE 11 PORTER’S FIVE FORCES MODEL
FIGURE 12 GLOBAL 4K TECHNOLOGY MARKET BY TYPE (USD BILLION), 2021
FIGURE 13 GLOBAL 4K TECHNOLOGY MARKET BY APPLICATION (USD BILLION), 2021
FIGURE 14 GLOBAL 4K TECHNOLOGY MARKET BY REGION (USD BILLION), 2021
FIGURE 15 NORTH AMERICA 4K TECHNOLOGY MARKET SNAPSHOT
FIGURE 16 EUROPE 4K TECHNOLOGY MARKET SNAPSHOT
FIGURE 17 SOUTH AMERICA 4K TECHNOLOGY MARKET SNAPSHOT
FIGURE 18 ASIA PACIFIC 4K TECHNOLOGY MARKET SNAPSHOT
FIGURE 19 MIDDLE EAST ASIA AND AFRICA 4K TECHNOLOGY MARKET SNAPSHOT
FIGURE 20 MARKET SHARE ANALYSIS
FIGURE 21 ASUSTEK CORP: COMPANY SNAPSHOT
FIGURE 22 SAMSUNG ELECTRONICS CORP: COMPANY SNAPSHOT
FIGURE 23 JVC KENWOOD CORP: COMPANY SNAPSHOT
FIGURE 24 HISENSE: COMPANY SNAPSHOT
FIGURE 25 SHARP: COMPANY SNAPSHOT
FIGURE 26 LG ELECTRONICS: COMPANY SNAPSHOT
FIGURE 27 HONG KONG SKYWORTH DIGITAL HOLDINGS LTD: COMPANY SNAPSHOT
FIGURE 28 INNOLUX CORP: COMPANY SNAPSHOT
FIGURE 29 CANON INC.: COMPANY SNAPSHOT
FIGURE 30 SONY CORP.: COMPANY SNAPSHOT
DOWNLOAD FREE SAMPLE REPORT
License Type
SPEAK WITH OUR ANALYST
Want to know more about the report or any specific requirement?
WANT TO CUSTOMIZE THE REPORT?
Our Clients Speak
We asked them to research ‘ Equipment market’ all over the world, and their whole arrangement was helpful to us. thehealthanalytics.com insightful analysis and reports contributed to our current analysis and in creating a future strategy. Besides, the te
Yosuke Mitsui
Senior Associate Construction Equipment Sales & Marketing
We asked them to research ‘Equipment market’ all over the world, and their whole arrangement was helpful to us. thehealthanalytics.com insightful analysis and reports contributed to our current analysis and in creating a future strategy. Besides, the te


