

Base Year Value ()
x.x %
x.x %
CAGR ()
x.x %
x.x %
Forecast Year Value ()
x.x %
x.x %
Historical Data Period
Largest Region
Forecast Period
Eye Tracking Market by Type (Optical, Eye Attached Tracking), By Component (Hardware, Software), by Application (Healthcare, Consumer Electronics, Assistive Communication, Human Behavior, Usability Testing) and Region, Global trends and forecast from 2022 to 2029
Instant access to hundreds of data points and trends
- Market estimates from 2014-2029
- Competitive analysis, industry segmentation, financial benchmarks
- Incorporates SWOT, Porter's Five Forces and risk management frameworks
- PDF report or online database with Word, Excel and PowerPoint export options
- 100% money back guarantee
Eye Tracking Market Overview
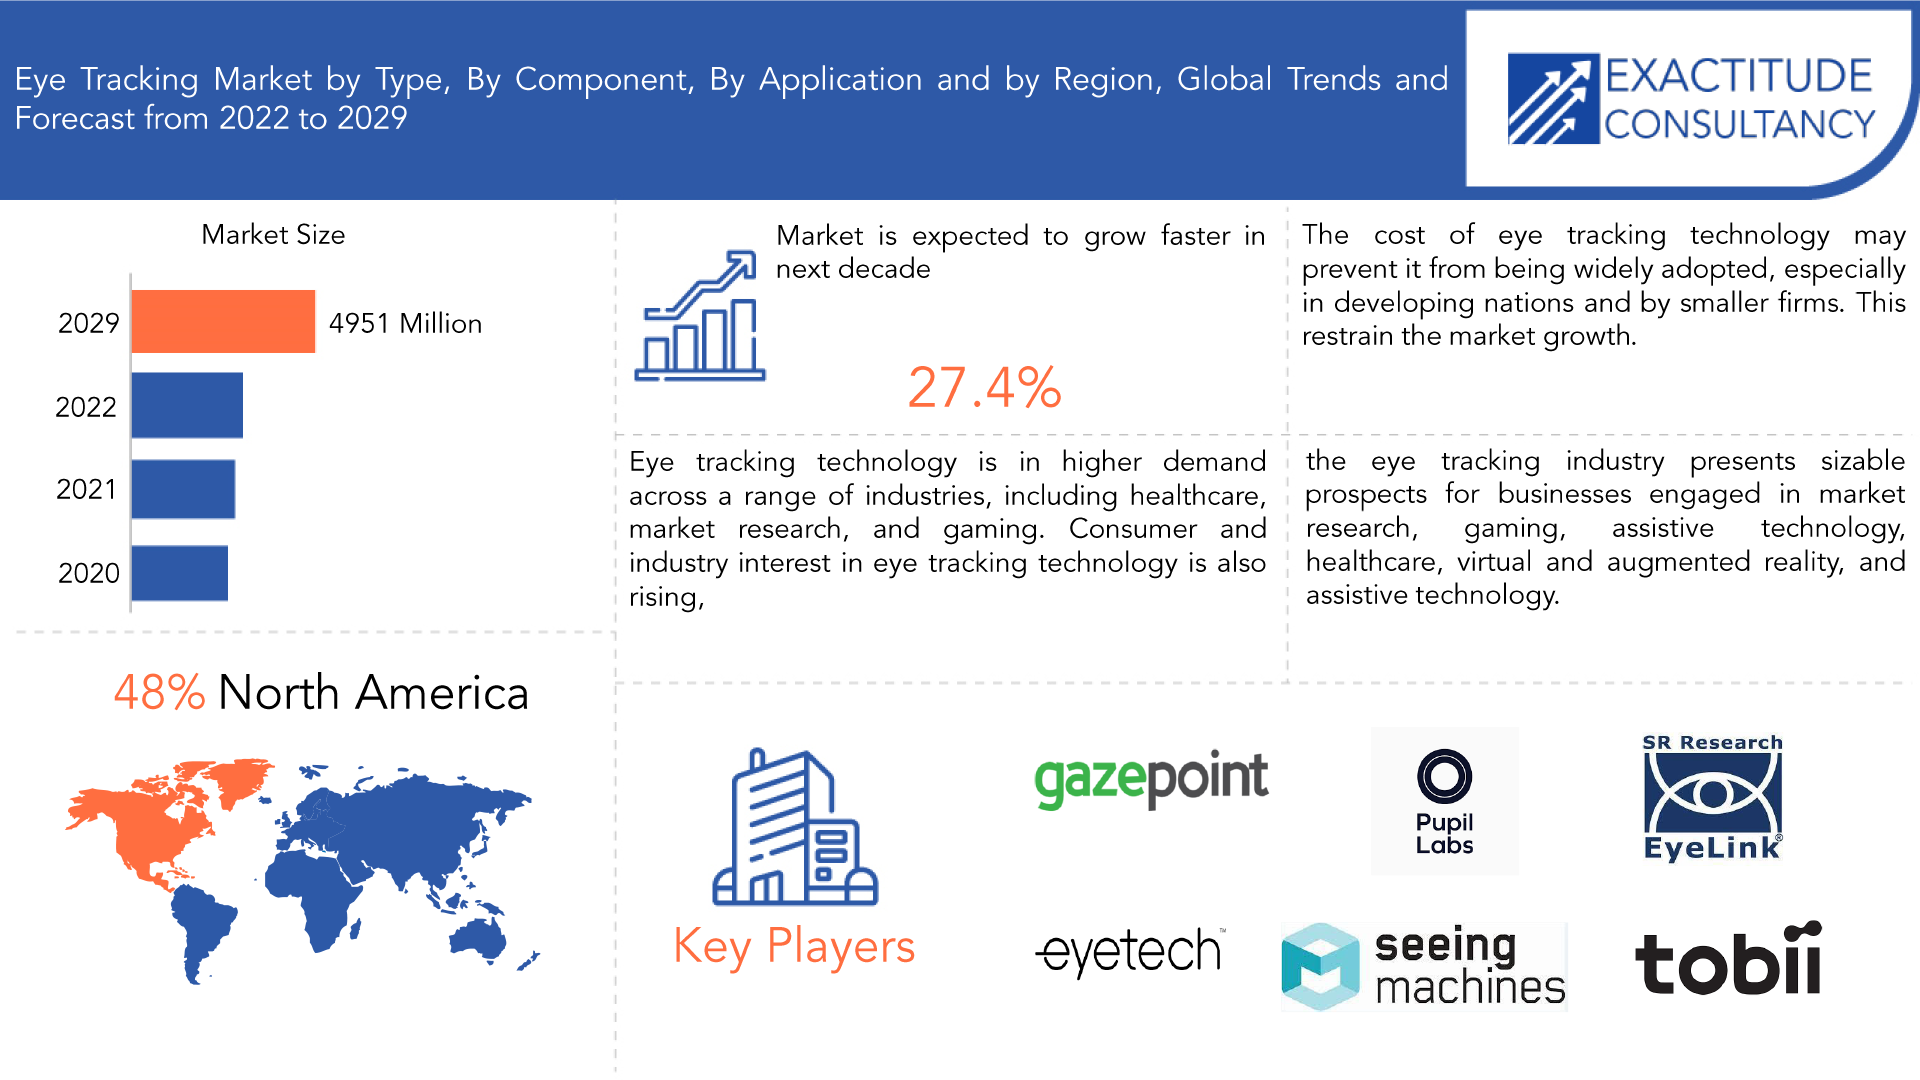
The eye tracking market is expected to grow at 27.4% CAGR from 2020 to 2029. It is expected to reach above USD 4951 million by 2029 from USD 560 million in 2020.
The industry that creates and offers eye tracking devices, software, and technology is known as the eye tracking market. Eye tracking technology enables a variety of applications, including research, healthcare, and gaming, by using sensors and cameras to monitor and track a person's eye movement and posture. Several industries, including psychology, neuroscience, marketing, human-computer interface, and assistive technology, use eye tracking technologies. A variety of eye tracking gadgets, including head-mounted and remote models, are available on the market, along with processing and visualization software. There are various kinds of eye tracking systems available, including contact or intrusive systems that demand the user to wear a device like a head-mounted display or special glasses. Remote or non-invasive systems employ infrared cameras to watch the user's eyes from a distance. The accuracy, speed, and usability of eye tracking technologies are constantly improving thanks to new breakthroughs in hardware, software, and algorithms.
Eye tracking technology is in higher demand across a range of industries, including healthcare, market research, and gaming. Consumer and industry interest in eye tracking technology is rising, and more sophisticated and user-friendly eye tracking hardware is being created. growing need for assistive communication tools like eye-tracking software for computer control and communication among people with impairments.
| ATTRIBUTE | DETAILS |
| Study period | 2020-2029 |
| Base year | 2021 |
| Estimated year | 2022 |
| Forecasted year | 2022-2029 |
| Historical period | 2018-2020 |
| Unit | Value (USD Million) (Thousand Units) |
| Segmentation | By Type, By Component, By Application, By Region |
| By Type |
|
| By Component |
|
| By Application |
|
| By Region |
|
Eye tracking technology is being used more frequently in the automotive sector for driver monitoring and safety purposes. The advancement of eye tracking technology for use in augmented and virtual reality applications, which is anticipated to propel market expansion in the ensuing years. Eye tracking technology is being used more and more in academic and scientific research, especially in the disciplines of neuroscience and psychology. increasing spending on eye tracking research and development by big businesses and startups, as well as improvements in AI and machine learning that are enabling more sophisticated eye tracking capabilities.
Eye tracking technology is being utilized more frequently in the healthcare industry for a variety of purposes, including diagnosis, treatment, and rehabilitation. In order to understand consumer behavior, preferences, and emotions, market researchers are using eye tracking technologies. The creation of assistive communication tools for people with disabilities makes use of eye tracking technologies. Overall, the eye tracking industry presents sizable prospects for businesses engaged in market research, gaming, assistive technology, healthcare, virtual and augmented reality, and assistive technology.
The cost of eye tracking technology may prevent it from being widely adopted, especially in developing nations and by smaller firms. Many individuals are unaware of the advantages of eye tracking and may not be aware of all the applications it may be utilized for. This ignorance can reduce demand. Eye tracking may not always be the best option, either in terms of effectiveness or cost. For instance, in some situations, voice or facial recognition may be a superior choice for spotting user activity. This are some main restrain of the market.
The COVID-19 pandemic has had a conflicting effect on the eye tracking market. The pandemic has hampered the world's supply chain, which has caused delays in the production and delivery of eye monitoring equipment. As a result of the pandemic, however, there has also been a rise in the demand for remote healthcare and virtual communication, which has also raised the need for eye tracking technologies. Throughout the pandemic, the use of eye tracking technologies in remote healthcare has grown in significance. Overall, the COVID-19 pandemic has given chances for expansion in remote healthcare and virtual communication while also posing some hurdles for the eye tracking sector.
[caption id="attachment_22467" align="aligncenter" width="1920"]
Frequently Asked Questions
• What is the worth of eye tracking market?
The eye tracking market is expected to grow at 27.4% CAGR from 2020 to 2029. It is expected to reach above USD 4951 million by 2029 from USD 560 million in 2020.
• What is the size of the North America eye tracking industry?
North America held more than 48% of the eye tracking market revenue share in 2021 and will witness expansion in the forecast period.
• What are some of the market's driving forces?
Eye tracking technology is in higher demand across a range of industries, including healthcare, market research, and gaming. Consumer and industry interest in eye tracking technology is rising, and more sophisticated and user-friendly eye tracking hardware is being created. growing need for assistive communication tools like eye-tracking software for computer control and communication among people with impairments.
• Which are the top companies to hold the market share in eye tracking market?
The Eye Tracking market key Tobii Ab, Seeing Machines, EyeTech Digital Systems, SR Research Ltd, Gaze point, Pupil Labs, iMotions, SMI, Smart Eye AB, Ergoneers GmbH.
• What is the leading type of eye tracking market?
Based on type, the top rank was held by the optical tracking category. Because optical tracking systems can record both active and passive motion of the entire body, they are increasingly in demand in VR and AR. This allows VR to learn more about the participant's position. The sub-segment for eye-attached tracking is anticipated to experience the fastest CAGR growth. Similar to contact lenses with embedded magnetic or mirror sensors, ye-attached capturing devices can continue tracking the vision even while the head is moving.
• Which is the largest regional market for eye tracking market?
North America accounts for 48% of the market for eye tracking worldwide. This can be ascribed to the fact that important players are present in the area and that eye tracking technology is widely used in a variety of fields, including healthcare, market research, and the automobile industry. The eye tracking market in North America is anticipated to continue to expand as a result of rising investments in research & development efforts linked to the technology and rising demand for assistive communication devices.
Eye Tracking Market Segment Analysis
The eye tracking market is segmented based on type, component, application and region.
Based on type, the top rank was held by the optical tracking category. Since optical tracking systems can record both active and passive motion of the entire body, they are increasingly in demand in VR and AR. This allows VR to learn more about the participant's position. The sub-segment for eye-attached tracking is anticipated to experience the fastest CAGR growth. Similar to contact lenses with embedded magnetic or mirror sensors, ye-attached capturing devices can continue tracking the vision even while the head is moving.
Based on Component, the component segment dominates by the hardware industry. Comparable hardware exists for optical or video-based trackers and an eye-attached tracing device. A desktop, an internal or external storage device, a camera to record eye movement and gaze points, and optical sensors to recognize and keep track of visual movement make up the Eye Tracking Device (ETD). The industry segment with the fastest CAGR would be software. The hardware and software components of the vision-capturing system vary depending on the tracker's features.
Based on Application, more than 25.00% of the market's revenue was controlled by the healthcare industry. Until recently, the only applications for gaze capture in healthcare were computer interfaces for patients with physical impairments and other communication challenges. The use of technology as an input method for consumer goods and gaming devices is growing quickly, nevertheless. The retail FMCG industry is seeing a rise in demand for eye-tracking technology. Retail stores use eye-tracking technology and its algorithms to analyses customer behavior.
[caption id="attachment_22471" align="aligncenter" width="1920"]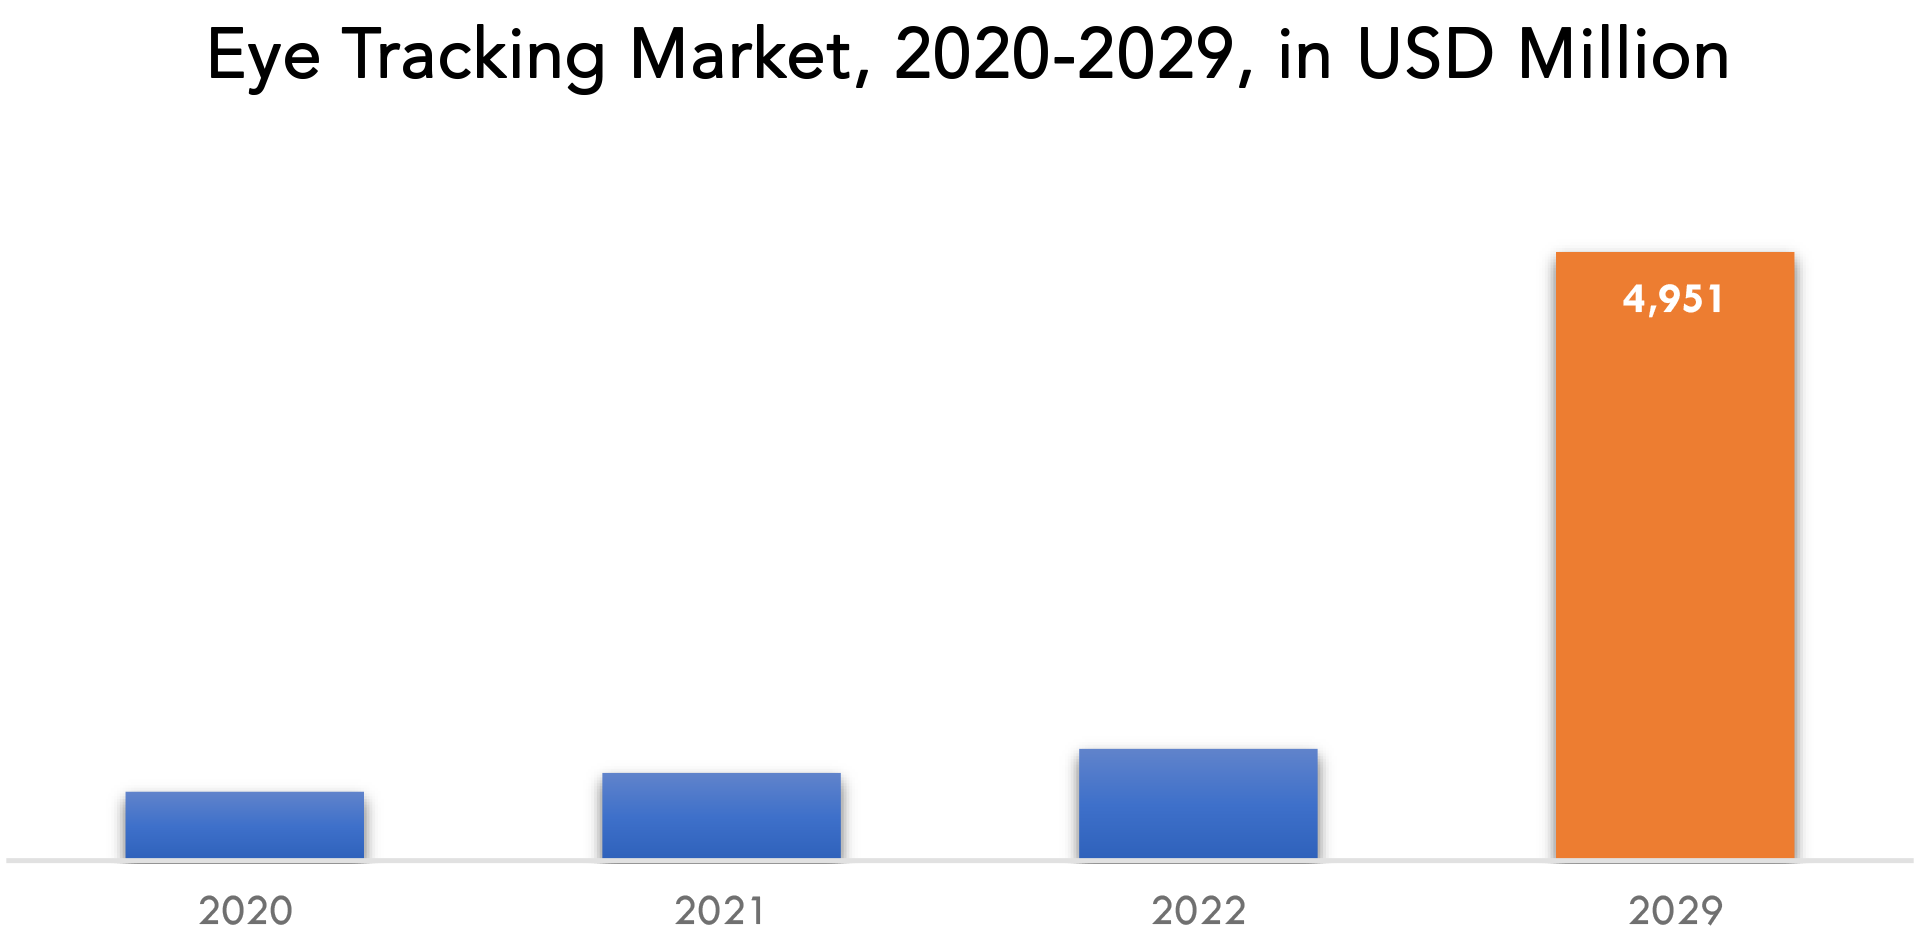
Eye Tracking Market Players
The Eye Tracking market key Tobii Ab, Seeing Machines, EyeTech Digital Systems, SR Research Ltd, Gaze point, Pupil Labs, iMotions, SMI, Smart Eye AB, Ergoneers GmbH.
Recent News 17-05-2021: - EyeTech Digital Systems announced release of its software ecosystem for the EyeOn family of eye-tracking tablets, an open platform engineered from the ground up to provide the first truly seamless eye-tracking technology experience. 16-04-2021: - SyncThink, a next gen neurotechnology company announced that it will provide the award-winning EYE-SYNC technology on the VR headset Pico Neo 2 Eye, with built-in Tobii Eye Tracking.Who Should Buy? Or Key stakeholders
- Healthcare
- Defense
- Automotive
- Medical
- Investors
- Electronics
- Others
Eye Tracking Market Regional Analysis
The Eye Tracking market by region includes North America, Asia-Pacific (APAC), Europe, South America, and Middle East & Africa (MEA).
- North America: includes the US, Canada, Mexico
- Asia Pacific: includes China, Japan, South Korea, India, Australia, ASEAN and Rest of APAC
- Europe: includes UK, Germany, France, Italy, Spain, Russia, and Rest of Europe
- South America: includes Brazil, Argentina and Rest of South America
- Middle East & Africa: includes Turkey, UAE, Saudi Arabia, South Africa, and Rest of MEA
North America accounts for 48% of the market for eye tracking worldwide. This can be ascribed to the fact that important players are present in the area and that eye tracking technology is widely used in a variety of fields, including healthcare, market research, and the automobile industry. The eye tracking market in North America is anticipated to continue to expand as a result of rising investments in research & development efforts linked to the technology and rising demand for assistive communication devices.
The automotive and aerospace sectors offer tremendous growth potential in Europe, the second-largest market for eye tracking. Due to the increasing use of eye tracking technology in healthcare, automotive, and gaming applications, as well as the rising demand for virtual and augmented reality gadgets in the region, the Asia Pacific region is anticipated to see the greatest growth rate during the projected period.
[caption id="attachment_22472" align="aligncenter" width="1920"]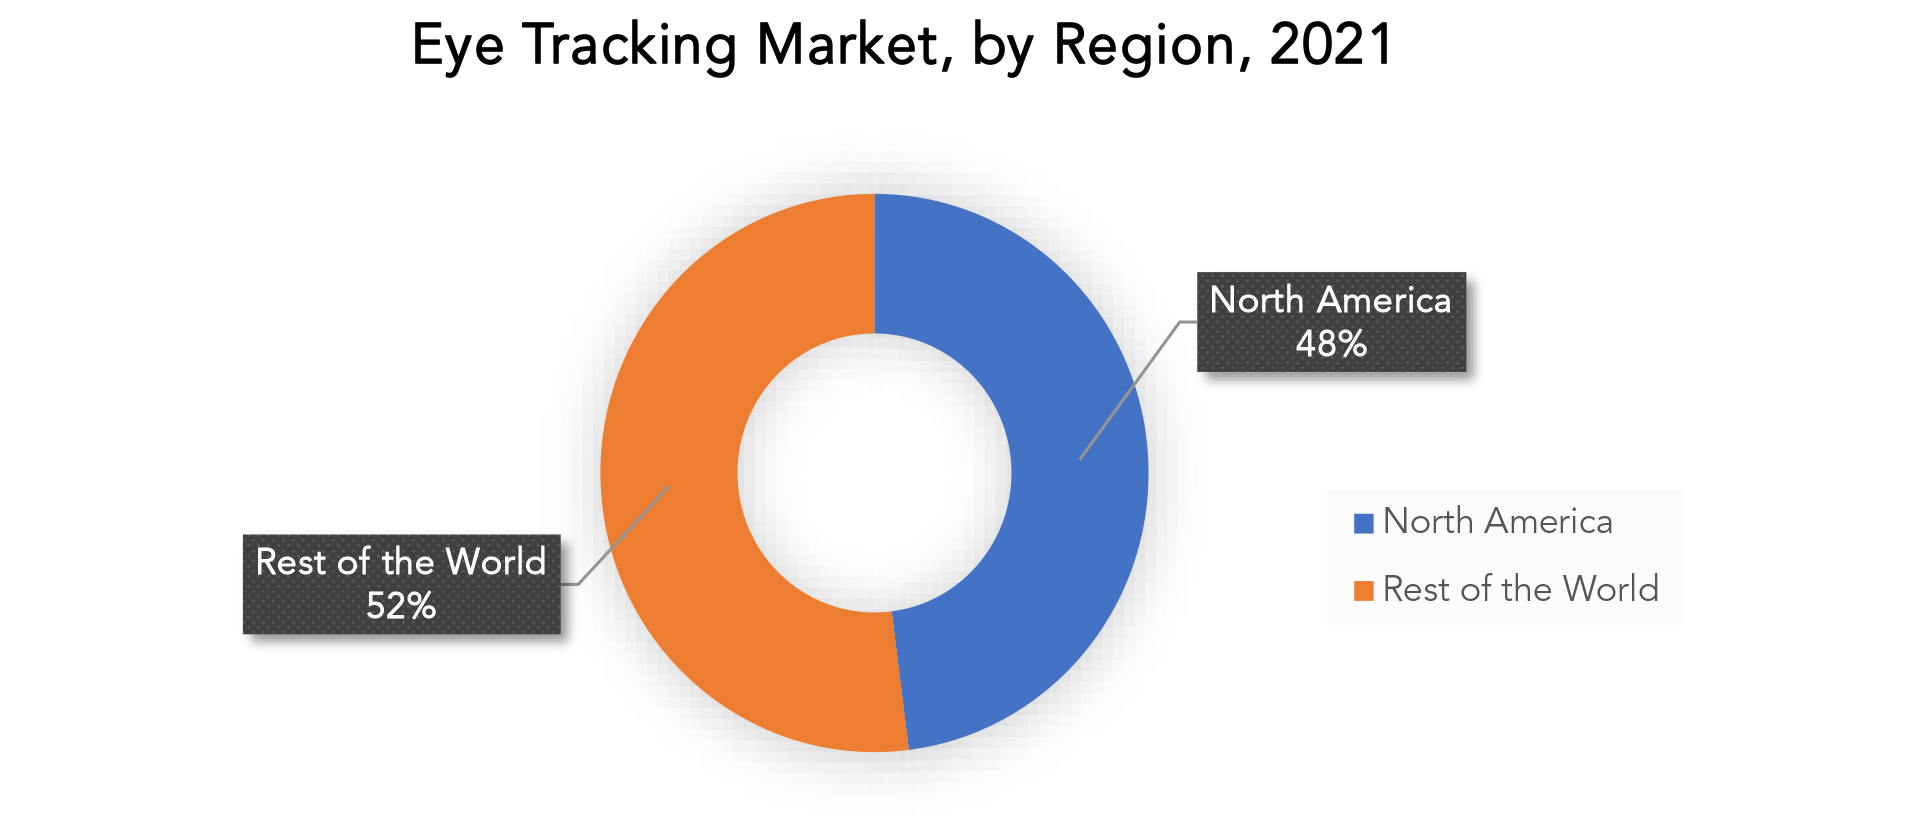
Key Market Segments: Eye Tracking Market
Eye Tracking Market by Type, 2020-2029, (USD Million) (Thousand Units)- Optical
- Eye Attached Tracking
- Hardware
- Software
- Healthcare
- Consumer Electronics
- Assistive Communication
- Human Behavior
- Usability Testing
- North America
- Asia Pacific
- Europe
- South America
- Middle East And Africa
Key Question Answered
- What is the expected growth rate of the eye tracking market over the next 7 years?
- Who are the major players in the eye tracking market and what is their market share?
- What are the pesticides type industries driving demand for market and what is their outlook?
- What are the opportunities for growth in emerging markets such as Asia-Pacific, Middle East, And Africa?
- How is the economic environment affecting the eye tracking market, including factors such as interest rates, inflation, and exchange rates?
- What is the expected impact of government policies and regulations on the eye tracking market?
- What is the current and forecasted size and growth rate of the global eye tracking market?
- What are the key drivers of growth in the eye tracking market?
- Who are the major players in the market and what is their market share?
- What are the distribution channels and supply chain dynamics in the eye tracking market?
- What are the technological advancements and innovations in the eye tracking market and their impact on type development and growth?
- What are the regulatory considerations and their impact on the market?
- What are the challenges faced by players in the eye tracking market and how are they addressing these challenges?
- What are the opportunities for growth and expansion in the eye tracking market?
- What are the service offerings and specifications of leading players in the market?
- What is the pricing trend of eye tracking in the market and what is the impact of raw process prices on the price trend?
Exactitude Consultancy Services Key Objectives
- Increasing sales and market share
- Developing new technology
- Improving profitability
- Entering new markets
- Enhancing brand reputation
- INTRODUCTION
- MARKET DEFINITION
- MARKET SEGMENTATION
- RESEARCH TIMELINES
- ASSUMPTIONS AND LIMITATIONS
- RESEARCH METHODOLOGY
- DATA MINING
- SECONDARY RESEARCH
- PRIMARY RESEARCH
- SUBJECT-MATTER EXPERTS’ ADVICE
- QUALITY CHECKS
- FINAL REVIEW
- DATA TRIANGULATION
- BOTTOM-UP APPROACH
- TOP-DOWN APPROACH
- RESEARCH FLOW
- DATA SOURCES
- DATA MINING
- EXECUTIVE SUMMARY
- MARKET OVERVIEW
- GLOBAL EYE TRACKING OUTLOOK
- MARKET DRIVERS
- MARKET RESTRAINTS
- MARKET OPPORTUNITIES
- IMPACT OF COVID-19 ON EYE TRACKING MARKET
- PORTER’S FIVE FORCES MODEL
- THREAT FROM NEW ENTRANTS
- THREAT FROM SUBSTITUTES
- BARGAINING POWER OF SUPPLIERS
- BARGAINING POWER OF CUSTOMERS
- DEGREE OF COMPETITION
- INDUSTRY VALUE CHAIN ANALYSIS
- GLOBAL EYE TRACKING OUTLOOK
- GLOBAL EYE TRACKING MARKET BY TYPE (USD MILLION) (THOUSAND UNITS) 2020-2029
- OPTICAL
- EYE ATTACHED TRACKING
- GLOBAL EYE TRACKING MARKET BY COMPONENT (USD MILLION) (THOUSAND UNITS) 2020-2029
- HARDWARE
- SOFTWARE
- GLOBAL EYE TRACKING MARKET BY APPLICATION (USD MILLION) (THOUSAND UNITS) 2020-2029
- HEALTHCARE
- CONSUMER ELECTRONICS
- ASSISTIVE COMMUNICATION
- HUMAN BEHAVIOR
- USABILITY TESTING
- GLOBAL EYE TRACKING MARKET BY REGION (USD MILLION) (THOUSAND UNITS) 2020-2029
- NORTH AMERICA
- US
- CANADA
- MEXICO
- SOUTH AMERICA
- BRAZIL
- ARGENTINA
- COLOMBIA
- REST OF SOUTH AMERICA
- EUROPE
- GERMANY
- UK
- FRANCE
- ITALY
- SPAIN
- RUSSIA
- REST OF EUROPE
- ASIA PACIFIC
- INDIA
- CHINA
- JAPAN
- SOUTH KOREA
- AUSTRALIA
- SOUTH-EAST ASIA
- REST OF ASIA PACIFIC
- MIDDLE EAST AND AFRICA
- UAE
- SAUDI ARABIA
- SOUTH AFRICA
- REST OF MIDDLE EAST AND AFRICA
- NORTH AMERICA
- COMPANY PROFILES* (BUSINESS OVERVIEW, COMPANY SNAPSHOT, PRODUCTS OFFERED, RECENT DEVELOPMENTS)
- TOBII AB
- SEEING MACHINES
- EYETECH DIGITAL SYSTEMS
- SR RESEARCH LTD
- GAZE POINT
- PUPIL LABS
- IMOTIONS
- SMI
- SMART EYE AB
- ERGONEERS GMBH *THE COMPANY LIST IS INDICATIVE
LIST OF TABLES
TABLE 1 GLOBAL EYE TRACKING MARKET BY TYPE (USD BILLION) 2022-2029
TABLE 2 GLOBAL EYE TRACKING MARKET BY TYPE (THOUSAND UNITS) 2022-2029
TABLE 3 GLOBAL EYE TRACKING MARKET BY APPLICATION (USD BILLION) 2022-2029
TABLE 4 GLOBAL EYE TRACKING MARKET BY APPLICATION (THOUSAND UNITS) 2022-2029
TABLE 5 GLOBAL EYE TRACKING MARKET BY COMPONENT (USD BILLION) 2022-2029
TABLE 6 GLOBAL EYE TRACKING MARKET BY COMPONENT (THOUSAND UNITS) 2022-2029
TABLE 7 GLOBAL EYE TRACKING MARKET BY REGION (USD BILLION) 2022-2029
TABLE 8 GLOBAL EYE TRACKING MARKET BY REGION (THOUSAND UNITS) 2022-2029
TABLE 9 NORTH AMERICA EYE TRACKING MARKET BY COUNTRY (USD BILLION) 2022-2029
TABLE 10 NORTH AMERICA EYE TRACKING MARKET BY COUNTRY (THOUSAND UNITS) 2022-2029
TABLE 11 NORTH AMERICA EYE TRACKING MARKET BY TYPE (USD BILLION) 2022-2029
TABLE 12 NORTH AMERICA EYE TRACKING MARKET BY TYPE (THOUSAND UNITS) 2022-2029
TABLE 13 NORTH AMERICA EYE TRACKING MARKET BY APPLICATION (USD BILLION) 2022-2029
TABLE 14 NORTH AMERICA EYE TRACKING MARKET BY APPLICATION (THOUSAND UNITS) 2022-2029
TABLE 15 NORTH AMERICA EYE TRACKING MARKET BY COMPONENT (USD BILLION) 2022-2029
TABLE 16 NORTH AMERICA EYE TRACKING MARKET BY COMPONENT (THOUSAND UNITS) 2022-2029
TABLE 17 US EYE TRACKING MARKET BY TYPE (USD BILLION) 2022-2029
TABLE 18 US EYE TRACKING MARKET BY TYPE (THOUSAND UNITS) 2022-2029
TABLE 19 US EYE TRACKING MARKET BY APPLICATION (USD BILLION) 2022-2029
TABLE 20 US EYE TRACKING MARKET BY APPLICATION (THOUSAND UNITS) 2022-2029
TABLE 21 US EYE TRACKING MARKET BY COMPONENT (USD BILLION) 2022-2029
TABLE 22 US EYE TRACKING MARKET BY COMPONENT (THOUSAND UNITS) 2022-2029
TABLE 23 CANADA EYE TRACKING MARKET BY TYPE (USD BILLION) 2022-2029
TABLE 24 CANADA EYE TRACKING MARKET BY TYPE (THOUSAND UNITS) 2022-2029
TABLE 25 CANADA EYE TRACKING MARKET BY APPLICATION (USD BILLION) 2022-2029
TABLE 26 CANADA EYE TRACKING MARKET BY APPLICATION (THOUSAND UNITS) 2022-2029
TABLE 27 CANADA EYE TRACKING MARKET BY COMPONENT (USD BILLION) 2022-2029
TABLE 28 CANADA EYE TRACKING MARKET BY COMPONENT (THOUSAND UNITS) 2022-2029
TABLE 29 MEXICO EYE TRACKING MARKET BY TYPE (USD BILLION) 2022-2029
TABLE 30 MEXICO EYE TRACKING MARKET BY TYPE (THOUSAND UNITS) 2022-2029
TABLE 31 MEXICO EYE TRACKING MARKET BY APPLICATION (USD BILLION) 2022-2029
TABLE 32 MEXICO EYE TRACKING MARKET BY APPLICATION (THOUSAND UNITS) 2022-2029
TABLE 33 MEXICO EYE TRACKING MARKET BY COMPONENT (USD BILLION) 2022-2029
TABLE 34 MEXICO EYE TRACKING MARKET BY COMPONENT (THOUSAND UNITS) 2022-2029
TABLE 35 SOUTH AMERICA EYE TRACKING MARKET BY COUNTRY (USD BILLION) 2022-2029
TABLE 36 SOUTH AMERICA EYE TRACKING MARKET BY COUNTRY (THOUSAND UNITS) 2022-2029
TABLE 37 SOUTH AMERICA EYE TRACKING MARKET BY TYPE (USD BILLION) 2022-2029
TABLE 38 SOUTH AMERICA EYE TRACKING MARKET BY TYPE (THOUSAND UNITS) 2022-2029
TABLE 39 SOUTH AMERICA EYE TRACKING MARKET BY APPLICATION (USD BILLION) 2022-2029
TABLE 40 SOUTH AMERICA EYE TRACKING MARKET BY APPLICATION (THOUSAND UNITS) 2022-2029
TABLE 41 SOUTH AMERICA EYE TRACKING MARKET BY COMPONENT (USD BILLION) 2022-2029
TABLE 42 SOUTH AMERICA EYE TRACKING MARKET BY COMPONENT (THOUSAND UNITS) 2022-2029
TABLE 43 BRAZIL EYE TRACKING MARKET BY TYPE (USD BILLION) 2022-2029
TABLE 44 BRAZIL EYE TRACKING MARKET BY TYPE (THOUSAND UNITS) 2022-2029
TABLE 45 BRAZIL EYE TRACKING MARKET BY APPLICATION (USD BILLION) 2022-2029
TABLE 46 BRAZIL EYE TRACKING MARKET BY APPLICATION (THOUSAND UNITS) 2022-2029
TABLE 47 BRAZIL EYE TRACKING MARKET BY COMPONENT (USD BILLION) 2022-2029
TABLE 48 BRAZIL EYE TRACKING MARKET BY COMPONENT (THOUSAND UNITS) 2022-2029
TABLE 49 ARGENTINA EYE TRACKING MARKET BY TYPE (USD BILLION) 2022-2029
TABLE 50 ARGENTINA EYE TRACKING MARKET BY TYPE (THOUSAND UNITS) 2022-2029
TABLE 51 ARGENTINA EYE TRACKING MARKET BY APPLICATION (USD BILLION) 2022-2029
TABLE 52 ARGENTINA EYE TRACKING MARKET BY APPLICATION (THOUSAND UNITS) 2022-2029
TABLE 53 ARGENTINA EYE TRACKING MARKET BY COMPONENT (USD BILLION) 2022-2029
TABLE 54 ARGENTINA EYE TRACKING MARKET BY COMPONENT (THOUSAND UNITS) 2022-2029
TABLE 55 COLOMBIA EYE TRACKING MARKET BY TYPE (USD BILLION) 2022-2029
TABLE 56 COLOMBIA EYE TRACKING MARKET BY TYPE (THOUSAND UNITS) 2022-2029
TABLE 57 COLOMBIA EYE TRACKING MARKET BY APPLICATION (USD BILLION) 2022-2029
TABLE 58 COLOMBIA EYE TRACKING MARKET BY APPLICATION (THOUSAND UNITS) 2022-2029
TABLE 59 COLOMBIA EYE TRACKING MARKET BY COMPONENT (USD BILLION) 2022-2029
TABLE 60 COLOMBIA EYE TRACKING MARKET BY COMPONENT (THOUSAND UNITS) 2022-2029
TABLE 61 REST OF SOUTH AMERICA EYE TRACKING MARKET BY TYPE (USD BILLION) 2022-2029
TABLE 62 REST OF SOUTH AMERICA EYE TRACKING MARKET BY TYPE (THOUSAND UNITS) 2022-2029
TABLE 63 REST OF SOUTH AMERICA EYE TRACKING MARKET BY APPLICATION (USD BILLION) 2022-2029
TABLE 64 REST OF SOUTH AMERICA EYE TRACKING MARKET BY APPLICATION (THOUSAND UNITS) 2022-2029
TABLE 65 REST OF SOUTH AMERICA EYE TRACKING MARKET BY COMPONENT (USD BILLION) 2022-2029
TABLE 66 REST OF SOUTH AMERICA EYE TRACKING MARKET BY COMPONENT (THOUSAND UNITS) 2022-2029
TABLE 67 ASIA-PACIFIC EYE TRACKING MARKET BY COUNTRY (USD BILLION) 2022-2029
TABLE 68 ASIA-PACIFIC EYE TRACKING MARKET BY COUNTRY (THOUSAND UNITS) 2022-2029
TABLE 69 ASIA-PACIFIC EYE TRACKING MARKET BY TYPE (USD BILLION) 2022-2029
TABLE 70 ASIA-PACIFIC EYE TRACKING MARKET BY TYPE (THOUSAND UNITS) 2022-2029
TABLE 71 ASIA-PACIFIC EYE TRACKING MARKET BY APPLICATION (USD BILLION) 2022-2029
TABLE 72 ASIA-PACIFIC EYE TRACKING MARKET BY APPLICATION (THOUSAND UNITS) 2022-2029
TABLE 73 ASIA-PACIFIC EYE TRACKING MARKET BY COMPONENT (USD BILLION) 2022-2029
TABLE 74 ASIA-PACIFIC EYE TRACKING MARKET BY COMPONENT (THOUSAND UNITS) 2022-2029
TABLE 75 INDIA EYE TRACKING MARKET BY TYPE (USD BILLION) 2022-2029
TABLE 76 INDIA EYE TRACKING MARKET BY TYPE (THOUSAND UNITS) 2022-2029
TABLE 77 INDIA EYE TRACKING MARKET BY APPLICATION (USD BILLION) 2022-2029
TABLE 78 INDIA EYE TRACKING MARKET BY APPLICATION (THOUSAND UNITS) 2022-2029
TABLE 79 INDIA EYE TRACKING MARKET BY COMPONENT (USD BILLION) 2022-2029
TABLE 80 INDIA EYE TRACKING MARKET BY COMPONENT (THOUSAND UNITS) 2022-2029
TABLE 81 CHINA EYE TRACKING MARKET BY TYPE (USD BILLION) 2022-2029
TABLE 82 CHINA EYE TRACKING MARKET BY TYPE (THOUSAND UNITS) 2022-2029
TABLE 83 CHINA EYE TRACKING MARKET BY APPLICATION (USD BILLION) 2022-2029
TABLE 84 CHINA EYE TRACKING MARKET BY APPLICATION (THOUSAND UNITS) 2022-2029
TABLE 85 CHINA EYE TRACKING MARKET BY COMPONENT (USD BILLION) 2022-2029
TABLE 86 CHINA EYE TRACKING MARKET BY COMPONENT (THOUSAND UNITS) 2022-2029
TABLE 87 JAPAN EYE TRACKING MARKET BY TYPE (USD BILLION) 2022-2029
TABLE 88 JAPAN EYE TRACKING MARKET BY TYPE (THOUSAND UNITS) 2022-2029
TABLE 89 JAPAN EYE TRACKING MARKET BY APPLICATION (USD BILLION) 2022-2029
TABLE 90 JAPAN EYE TRACKING MARKET BY APPLICATION (THOUSAND UNITS) 2022-2029
TABLE 91 JAPAN EYE TRACKING MARKET BY COMPONENT (USD BILLION) 2022-2029
TABLE 92 JAPAN EYE TRACKING MARKET BY COMPONENT (THOUSAND UNITS) 2022-2029
TABLE 93 SOUTH KOREA EYE TRACKING MARKET BY TYPE (USD BILLION) 2022-2029
TABLE 94 SOUTH KOREA EYE TRACKING MARKET BY TYPE (THOUSAND UNITS) 2022-2029
TABLE 95 SOUTH KOREA EYE TRACKING MARKET BY APPLICATION (USD BILLION) 2022-2029
TABLE 96 SOUTH KOREA EYE TRACKING MARKET BY APPLICATION (THOUSAND UNITS) 2022-2029
TABLE 97 SOUTH KOREA EYE TRACKING MARKET BY COMPONENT (USD BILLION) 2022-2029
TABLE 98 SOUTH KOREA EYE TRACKING MARKET BY COMPONENT (THOUSAND UNITS) 2022-2029
TABLE 99 AUSTRALIA EYE TRACKING MARKET BY TYPE (USD BILLION) 2022-2029
TABLE 100 AUSTRALIA EYE TRACKING MARKET BY TYPE (THOUSAND UNITS) 2022-2029
TABLE 101 AUSTRALIA EYE TRACKING MARKET BY APPLICATION (USD BILLION) 2022-2029
TABLE 102 AUSTRALIA EYE TRACKING MARKET BY APPLICATION (THOUSAND UNITS) 2022-2029
TABLE 103 AUSTRALIA EYE TRACKING MARKET BY COMPONENT (USD BILLION) 2022-2029
TABLE 104 AUSTRALIA EYE TRACKING MARKET BY COMPONENT (THOUSAND UNITS) 2022-2029
TABLE 105 SOUTH-EAST ASIA EYE TRACKING MARKET BY TYPE (USD BILLION) 2022-2029
TABLE 106 SOUTH-EAST ASIA EYE TRACKING MARKET BY TYPE (THOUSAND UNITS) 2022-2029
TABLE 107 SOUTH-EAST ASIA EYE TRACKING MARKET BY APPLICATION (USD BILLION) 2022-2029
TABLE 108 SOUTH-EAST ASIA EYE TRACKING MARKET BY APPLICATION (THOUSAND UNITS) 2022-2029
TABLE 109 SOUTH-EAST ASIA EYE TRACKING MARKET BY COMPONENT (USD BILLION) 2022-2029
TABLE 110 SOUTH-EAST ASIA EYE TRACKING MARKET BY COMPONENT (THOUSAND UNITS) 2022-2029
TABLE 111 REST OF ASIA PACIFIC EYE TRACKING MARKET BY TYPE (USD BILLION) 2022-2029
TABLE 112 REST OF ASIA PACIFIC EYE TRACKING MARKET BY TYPE (THOUSAND UNITS) 2022-2029
TABLE 113 REST OF ASIA PACIFIC EYE TRACKING MARKET BY APPLICATION (USD BILLION) 2022-2029
TABLE 114 REST OF ASIA PACIFIC EYE TRACKING MARKET BY APPLICATION (THOUSAND UNITS) 2022-2029
TABLE 115 REST OF ASIA PACIFIC EYE TRACKING MARKET BY COMPONENT (USD BILLION) 2022-2029
TABLE 116 REST OF ASIA PACIFIC EYE TRACKING MARKET BY COMPONENT (THOUSAND UNITS) 2022-2029
TABLE 117 EUROPE EYE TRACKING MARKET BY COUNTRY (USD BILLION) 2022-2029
TABLE 118 EUROPE EYE TRACKING MARKET BY COUNTRY (THOUSAND UNITS) 2022-2029
TABLE 119 EUROPE EYE TRACKING MARKET BY TYPE (USD BILLION) 2022-2029
TABLE 120 EUROPE EYE TRACKING MARKET BY TYPE (THOUSAND UNITS) 2022-2029
TABLE 121 EUROPE EYE TRACKING MARKET BY APPLICATION (USD BILLION) 2022-2029
TABLE 122 EUROPE EYE TRACKING MARKET BY APPLICATION (THOUSAND UNITS) 2022-2029
TABLE 123 EUROPE EYE TRACKING MARKET BY COMPONENT (USD BILLION) 2022-2029
TABLE 124 EUROPE EYE TRACKING MARKET BY COMPONENT (THOUSAND UNITS) 2022-2029
TABLE 125 GERMANY EYE TRACKING MARKET BY TYPE (USD BILLION) 2022-2029
TABLE 126 GERMANY EYE TRACKING MARKET BY TYPE (THOUSAND UNITS) 2022-2029
TABLE 127 GERMANY EYE TRACKING MARKET BY APPLICATION (USD BILLION) 2022-2029
TABLE 128 GERMANY EYE TRACKING MARKET BY APPLICATION (THOUSAND UNITS) 2022-2029
TABLE 129 GERMANY EYE TRACKING MARKET BY COMPONENT (USD BILLION) 2022-2029
TABLE 130 GERMANY EYE TRACKING MARKET BY COMPONENT (THOUSAND UNITS) 2022-2029
TABLE 131 UK EYE TRACKING MARKET BY TYPE (USD BILLION) 2022-2029
TABLE 132 UK EYE TRACKING MARKET BY TYPE (THOUSAND UNITS) 2022-2029
TABLE 133 UK EYE TRACKING MARKET BY APPLICATION (USD BILLION) 2022-2029
TABLE 134 UK EYE TRACKING MARKET BY APPLICATION (THOUSAND UNITS) 2022-2029
TABLE 135 UK EYE TRACKING MARKET BY COMPONENT (USD BILLION) 2022-2029
TABLE 136 UK EYE TRACKING MARKET BY COMPONENT (THOUSAND UNITS) 2022-2029
TABLE 137 FRANCE EYE TRACKING MARKET BY TYPE (USD BILLION) 2022-2029
TABLE 138 FRANCE EYE TRACKING MARKET BY TYPE (THOUSAND UNITS) 2022-2029
TABLE 139 FRANCE EYE TRACKING MARKET BY APPLICATION (USD BILLION) 2022-2029
TABLE 140 FRANCE EYE TRACKING MARKET BY APPLICATION (THOUSAND UNITS) 2022-2029
TABLE 141 FRANCE EYE TRACKING MARKET BY COMPONENT (USD BILLION) 2022-2029
TABLE 142 FRANCE EYE TRACKING MARKET BY COMPONENT (THOUSAND UNITS) 2022-2029
TABLE 143 ITALY EYE TRACKING MARKET BY TYPE (USD BILLION) 2022-2029
TABLE 144 ITALY EYE TRACKING MARKET BY TYPE (THOUSAND UNITS) 2022-2029
TABLE 145 ITALY EYE TRACKING MARKET BY APPLICATION (USD BILLION) 2022-2029
TABLE 146 ITALY EYE TRACKING MARKET BY APPLICATION (THOUSAND UNITS) 2022-2029
TABLE 147 ITALY EYE TRACKING MARKET BY COMPONENT (USD BILLION) 2022-2029
TABLE 148 ITALY EYE TRACKING MARKET BY COMPONENT (THOUSAND UNITS) 2022-2029
TABLE 149 SPAIN EYE TRACKING MARKET BY TYPE (USD BILLION) 2022-2029
TABLE 150 SPAIN EYE TRACKING MARKET BY TYPE (THOUSAND UNITS) 2022-2029
TABLE 151 SPAIN EYE TRACKING MARKET BY APPLICATION (USD BILLION) 2022-2029
TABLE 152 SPAIN EYE TRACKING MARKET BY APPLICATION (THOUSAND UNITS) 2022-2029
TABLE 153 SPAIN EYE TRACKING MARKET BY COMPONENT (USD BILLION) 2022-2029
TABLE 154 SPAIN EYE TRACKING MARKET BY COMPONENT (THOUSAND UNITS) 2022-2029
TABLE 155 RUSSIA EYE TRACKING MARKET BY TYPE (USD BILLION) 2022-2029
TABLE 156 RUSSIA EYE TRACKING MARKET BY TYPE (THOUSAND UNITS) 2022-2029
TABLE 157 RUSSIA EYE TRACKING MARKET BY APPLICATION (USD BILLION) 2022-2029
TABLE 158 RUSSIA EYE TRACKING MARKET BY APPLICATION (THOUSAND UNITS) 2022-2029
TABLE 159 RUSSIA EYE TRACKING MARKET BY COMPONENT (USD BILLION) 2022-2029
TABLE 160 RUSSIA EYE TRACKING MARKET BY COMPONENT (THOUSAND UNITS) 2022-2029
TABLE 161 REST OF EUROPE EYE TRACKING MARKET BY TYPE (USD BILLION) 2022-2029
TABLE 162 REST OF EUROPE EYE TRACKING MARKET BY TYPE (THOUSAND UNITS) 2022-2029
TABLE 163 REST OF EUROPE EYE TRACKING MARKET BY APPLICATION (USD BILLION) 2022-2029
TABLE 164 REST OF EUROPE EYE TRACKING MARKET BY APPLICATION (THOUSAND UNITS) 2022-2029
TABLE 165 REST OF EUROPE EYE TRACKING MARKET BY COMPONENT (USD BILLION) 2022-2029
TABLE 166 REST OF EUROPE EYE TRACKING MARKET BY COMPONENT (THOUSAND UNITS) 2022-2029
TABLE 167 MIDDLE EAST AND AFRICA EYE TRACKING MARKET BY COUNTRY (USD BILLION) 2022-2029
TABLE 168 MIDDLE EAST AND AFRICA EYE TRACKING MARKET BY COUNTRY (THOUSAND UNITS) 2022-2029
TABLE 169 MIDDLE EAST AND AFRICA EYE TRACKING MARKET BY TYPE (USD BILLION) 2022-2029
TABLE 170 MIDDLE EAST AND AFRICA EYE TRACKING MARKET BY TYPE (THOUSAND UNITS) 2022-2029
TABLE 171 MIDDLE EAST AND AFRICA EYE TRACKING MARKET BY APPLICATION (USD BILLION) 2022-2029
TABLE 172 MIDDLE EAST AND AFRICA EYE TRACKING MARKET BY APPLICATION (THOUSAND UNITS) 2022-2029
TABLE 173 MIDDLE EAST AND AFRICA EYE TRACKING MARKET BY COMPONENT (USD BILLION) 2022-2029
TABLE 174 MIDDLE EAST AND AFRICA EYE TRACKING MARKET BY COMPONENT (THOUSAND UNITS) 2022-2029
TABLE 175 UAE EYE TRACKING MARKET BY TYPE (USD BILLION) 2022-2029
TABLE 176 UAE EYE TRACKING MARKET BY TYPE (THOUSAND UNITS) 2022-2029
TABLE 177 UAE EYE TRACKING MARKET BY APPLICATION (USD BILLION) 2022-2029
TABLE 178 UAE EYE TRACKING MARKET BY APPLICATION (THOUSAND UNITS) 2022-2029
TABLE 179 UAE EYE TRACKING MARKET BY COMPONENT (USD BILLION) 2022-2029
TABLE 180 UAE EYE TRACKING MARKET BY COMPONENT (THOUSAND UNITS) 2022-2029
TABLE 181 SAUDI ARABIA EYE TRACKING MARKET BY TYPE (USD BILLION) 2022-2029
TABLE 182 SAUDI ARABIA EYE TRACKING MARKET BY TYPE (THOUSAND UNITS) 2022-2029
TABLE 183 SAUDI ARABIA EYE TRACKING MARKET BY APPLICATION (USD BILLION) 2022-2029
TABLE 184 SAUDI ARABIA EYE TRACKING MARKET BY APPLICATION (THOUSAND UNITS) 2022-2029
TABLE 185 SAUDI ARABIA EYE TRACKING MARKET BY COMPONENT (USD BILLION) 2022-2029
TABLE 186 SAUDI ARABIA EYE TRACKING MARKET BY COMPONENT (THOUSAND UNITS) 2022-2029
TABLE 187 SOUTH AFRICA EYE TRACKING MARKET BY TYPE (USD BILLION) 2022-2029
TABLE 188 SOUTH AFRICA EYE TRACKING MARKET BY TYPE (THOUSAND UNITS) 2022-2029
TABLE 189 SOUTH AFRICA EYE TRACKING MARKET BY APPLICATION (USD BILLION) 2022-2029
TABLE 190 SOUTH AFRICA EYE TRACKING MARKET BY APPLICATION (THOUSAND UNITS) 2022-2029
TABLE 191 SOUTH AFRICA EYE TRACKING MARKET BY COMPONENT (USD BILLION) 2022-2029
TABLE 192 SOUTH AFRICA EYE TRACKING MARKET BY COMPONENT (THOUSAND UNITS) 2022-2029
TABLE 193 REST OF MIDDLE EAST AND AFRICA EYE TRACKING MARKET BY TYPE (USD BILLION) 2022-2029
TABLE 194 REST OF MIDDLE EAST AND AFRICA EYE TRACKING MARKET BY TYPE (THOUSAND UNITS) 2022-2029
TABLE 195 REST OF MIDDLE EAST AND AFRICA EYE TRACKING MARKET BY APPLICATION (USD BILLION) 2022-2029
TABLE 196 REST OF MIDDLE EAST AND AFRICA EYE TRACKING MARKET BY APPLICATION (THOUSAND UNITS) 2022-2029
TABLE 197 REST OF MIDDLE EAST AND AFRICA EYE TRACKING MARKET BY COMPONENT (USD BILLION) 2022-2029
TABLE 198 REST OF MIDDLE EAST AND AFRICA EYE TRACKING MARKET BY COMPONENT (THOUSAND UNITS) 2022-2029
LIST OF FIGURES
FIGURE 1 MARKET DYNAMICS
FIGURE 2 MARKET SEGMENTATION
FIGURE 3 REPORT TIMELINES: YEARS CONSIDERED
FIGURE 4 DATA TRIANGULATION
FIGURE 5 BOTTOM-UP APPROACH
FIGURE 6 TOP-DOWN APPROACH
FIGURE 7 RESEARCH FLOW
FIGURE 8 GLOBAL EYE TRACKING MARKET BY TYPE, USD MILLION, 2020-2029
FIGURE 9 GLOBAL EYE TRACKING MARKET BY APPLICATION, USD MILLION, 2020-2029
FIGURE 10 GLOBAL EYE TRACKING MARKET BY COMPONENT, USD MILLION, 2020-2029
FIGURE 11 GLOBAL EYE TRACKING MARKET BY REGION, USD MILLION, 2020-2029
FIGURE 12 GLOBAL EYE TRACKING MARKET BY TYPE, USD MILLION, 2021
FIGURE 13 GLOBAL EYE TRACKING MARKET BY APPLICATION, USD MILLION, 2021
FIGURE 14 GLOBAL EYE TRACKING MARKET BY COMPONENT, USD MILLION, 2021
FIGURE 15 GLOBAL EYE TRACKING MARKET BY REGION, USD MILLION, 2021
FIGURE 16 PORTER’S FIVE FORCES MODEL
FIGURE 17 MARKET SHARE ANALYSIS
FIGURE 18 PORTER’S FIVE FORCES MODEL
FIGURE 19 MARKET SHARE ANALYSIS
FIGURE 20 TOBII AB: COMPANY SNAPSHOT
FIGURE 21 SEEING MACHINES: COMPANY SNAPSHOT
FIGURE 22 EYE TECH DIGITAL SYSTEMS: COMPANY SNAPSHOT
FIGURE 23 SR RESEARCH: COMPANY SNAPSHOT
FIGURE 24 GAZE POINT: COMPANY SNAPSHOT
FIGURE 25 PUPIL LABS: COMPANY SNAPSHOT
FIGURE 26 IMOTIONS: COMPANY SNAPSHOT
FIGURE 27 SMI: COMPANY SNAPSHOT
FIGURE 28 SMART EYE AB: COMPANY SNAPSHOT
FIGURE 29 ERGONEERS GMBH: COMPANY SNAPSHOT
DOWNLOAD FREE SAMPLE REPORT
License Type
SPEAK WITH OUR ANALYST
Want to know more about the report or any specific requirement?
WANT TO CUSTOMIZE THE REPORT?
Our Clients Speak
We asked them to research ‘ Equipment market’ all over the world, and their whole arrangement was helpful to us. thehealthanalytics.com insightful analysis and reports contributed to our current analysis and in creating a future strategy. Besides, the te
Yosuke Mitsui
Senior Associate Construction Equipment Sales & Marketing
We asked them to research ‘Equipment market’ all over the world, and their whole arrangement was helpful to us. thehealthanalytics.com insightful analysis and reports contributed to our current analysis and in creating a future strategy. Besides, the te


