

Base Year Value ()
x.x %
x.x %
CAGR ()
x.x %
x.x %
Forecast Year Value ()
x.x %
x.x %
Historical Data Period
Largest Region
Forecast Period
Low Noise Amplifier Market by Type (Silicon LNA, Gallium Arsenide LNA, Silicon Germanium), By Frequency (Microwave, Radio Frequency, Intermediate Frequency, Millimeter Wave), by Application (Wireless Communication, Aerospace and Defense, Consumer Electronics, Automotive, Medical) and Region, Global trends and forecast from 2022 to 2029.
Instant access to hundreds of data points and trends
- Market estimates from 2014-2029
- Competitive analysis, industry segmentation, financial benchmarks
- Incorporates SWOT, Porter's Five Forces and risk management frameworks
- PDF report or online database with Word, Excel and PowerPoint export options
- 100% money back guarantee
Low Noise Amplifier Market Overview
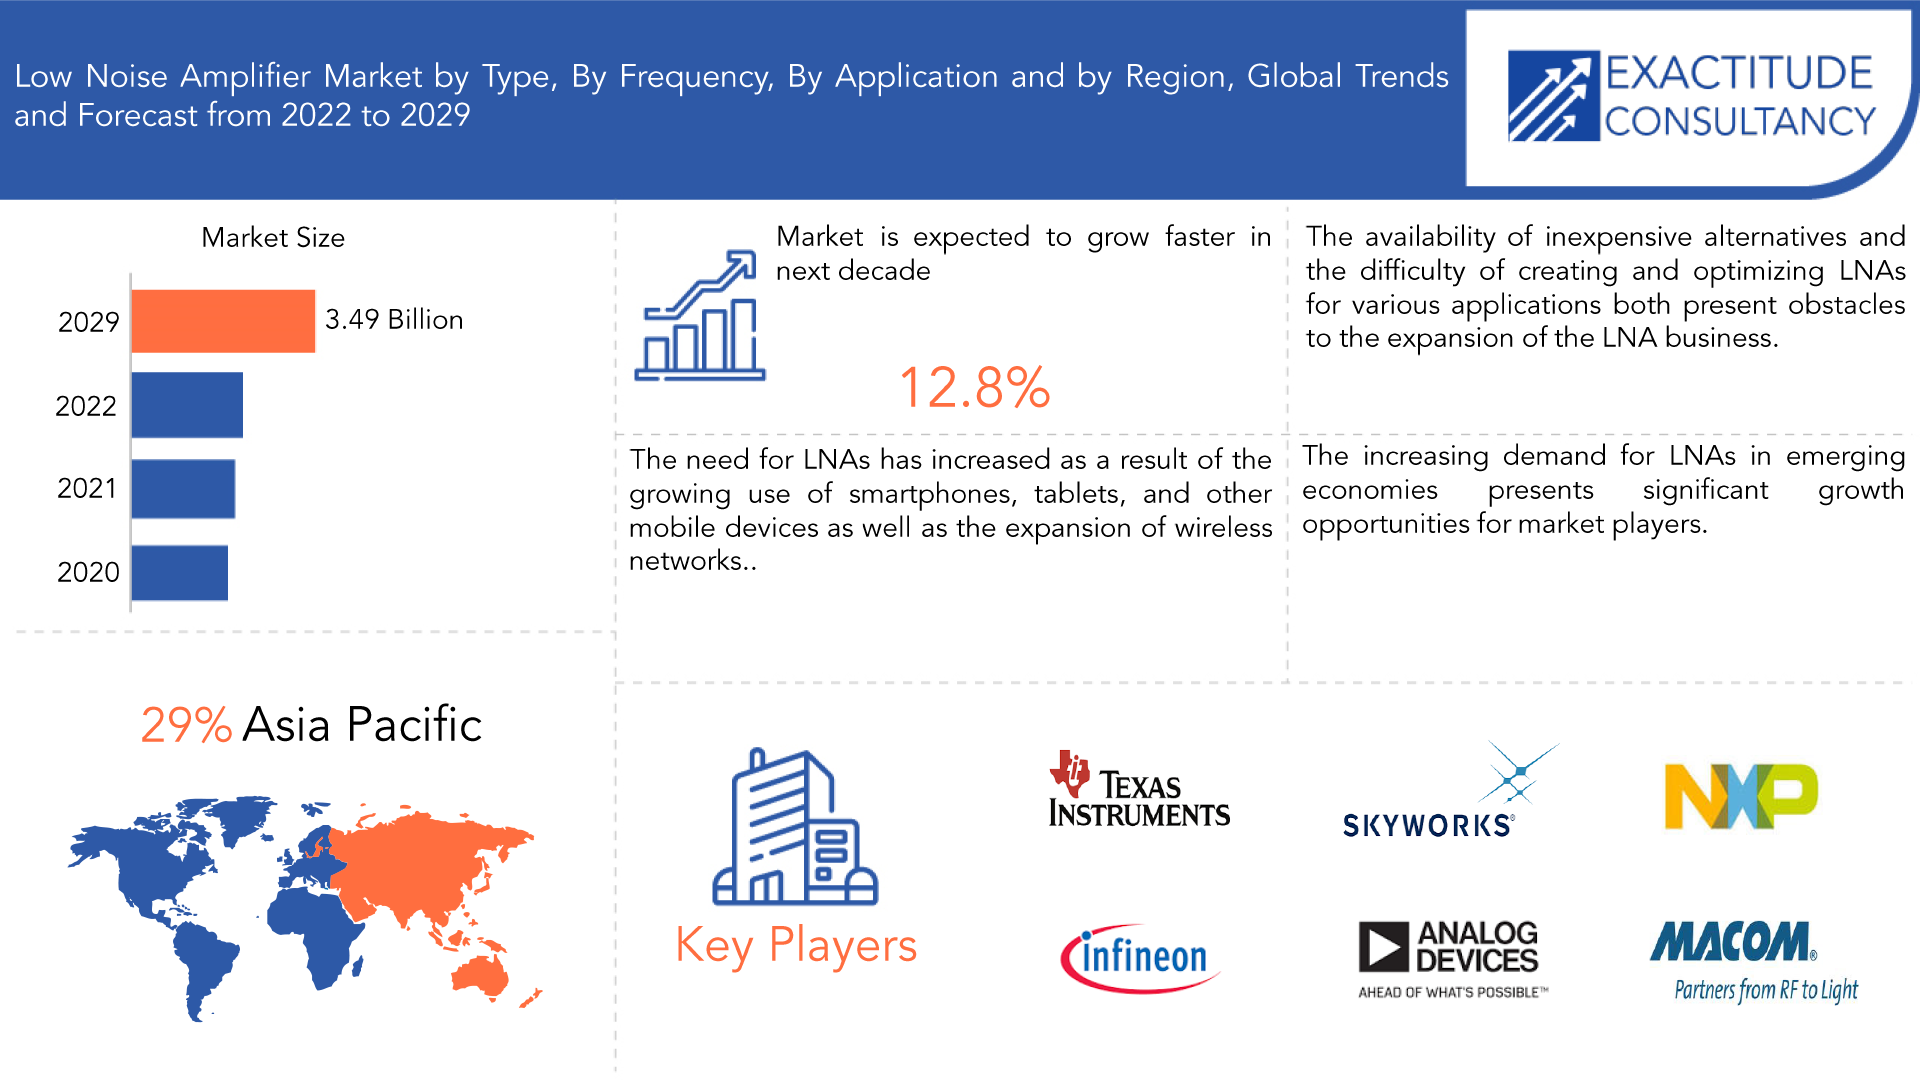
The low noise amplifier market is expected to grow at 12.8 % CAGR from 2020 to 2029. It is expected to reach above USD 3.49 billion by 2029 from USD 1.18 billion in 2020.
An electronic device called a low noise amplifier (LNA) amplifies weak signals while adding the least amount of noise possible. A signal that is too faint to be processed by other electronic components in a system needs to be amplified with the help of an LNA. LNAs are frequently utilized in a variety of devices, including radar systems, medical imaging equipment, and wireless communication systems.
An LNA's low noise figure, which measures the amount of noise the amplifier adds to the signal, is one of its major characteristics. The signal-to-noise ratio (SNR) is improved by an LNA with a low noise figure since it can amplify weak signals without adding much noise. This is crucial for applications like wireless communication, where effective communication depends on a strong, clear signal. LNAs are frequently incorporated into bigger systems or devices and are normally created to function over a specified frequency range.
| ATTRIBUTE | DETAILS |
| Study period | 2020-2029 |
| Base year | 2021 |
| Estimated year | 2022 |
| Forecasted year | 2022-2029 |
| Historical period | 2018-2020 |
| Unit | Value (USD Billion) (Thousand Units) |
| Segmentation | By Type, By Frequency, By Application, By Region |
| By Type |
|
| By Frequency |
|
| By Application |
|
| By Region |
|
The market for low noise amplifiers (LNAs) is primarily driven by the rising demand for wireless communication equipment and services. The need for LNAs has increased as a result of the growing use of smartphones, tablets, and other mobile devices as well as the expansion of wireless networks. High-performance LNAs are more essential as consumers expect connectivity that is quicker and more dependable. LNA demand is also being fueled by the continuing transition to 5G technology, which requires more sophisticated and high-frequency LNAs to enable larger data rates and lower latency.
LNA market refers to the expanding use of LNAs across a range of sectors, including consumer electronics, healthcare, aerospace and defence, and automobiles. LNAs are utilized in radar systems, satellite communication, and electronic warfare systems, among other things, in the aerospace and defence sector. The demand for LNAs in the automobile industry is being driven by the rising demand for advanced driver assistance systems (ADAS) and infotainment systems. LNAs are employed in the medical sector for a variety of purposes, including patient monitoring systems, diagnostic tools, and medical imaging.
The high cost of development and production is one of the primary barriers to the growth of the low noise amplifier (LNA) market. LNAs call very accurate and specialized technology, which can drastically raise the cost of production. Alternative technologies like software-defined radios and digital signal processing also compete with LNAs. The availability of inexpensive alternatives and the difficulty of creating and optimizing LNAs for various applications both present obstacles to the expansion of the LNA business.
The low noise amplifier (LNA) market has been influenced by the COVID-19 epidemic in a number of ways. Due to the disturbance in the worldwide supply chain, there have been delays in delivery dates and price increases in the production and shipment of LNAs. Due to the move towards remote work and growing use of wireless communication devices, the pandemic has also led to a fall in demand for some types of LNAs and an increase in demand for others. Overall, COVID-19 has had a mixed effect on the LNA market, having both good and negative impacts.
[caption id="attachment_23070" align="aligncenter" width="1920"]
Frequently Asked Questions
• What is the worth of low noise amplifier market?
The low noise amplifier market is expected to grow at 12.8 % CAGR from 2020 to 2029. It is expected to reach above USD 3.49 billion by 2029 from USD 1.18 billion in 2020.
• What is the size of the North America low noise amplifier industry?
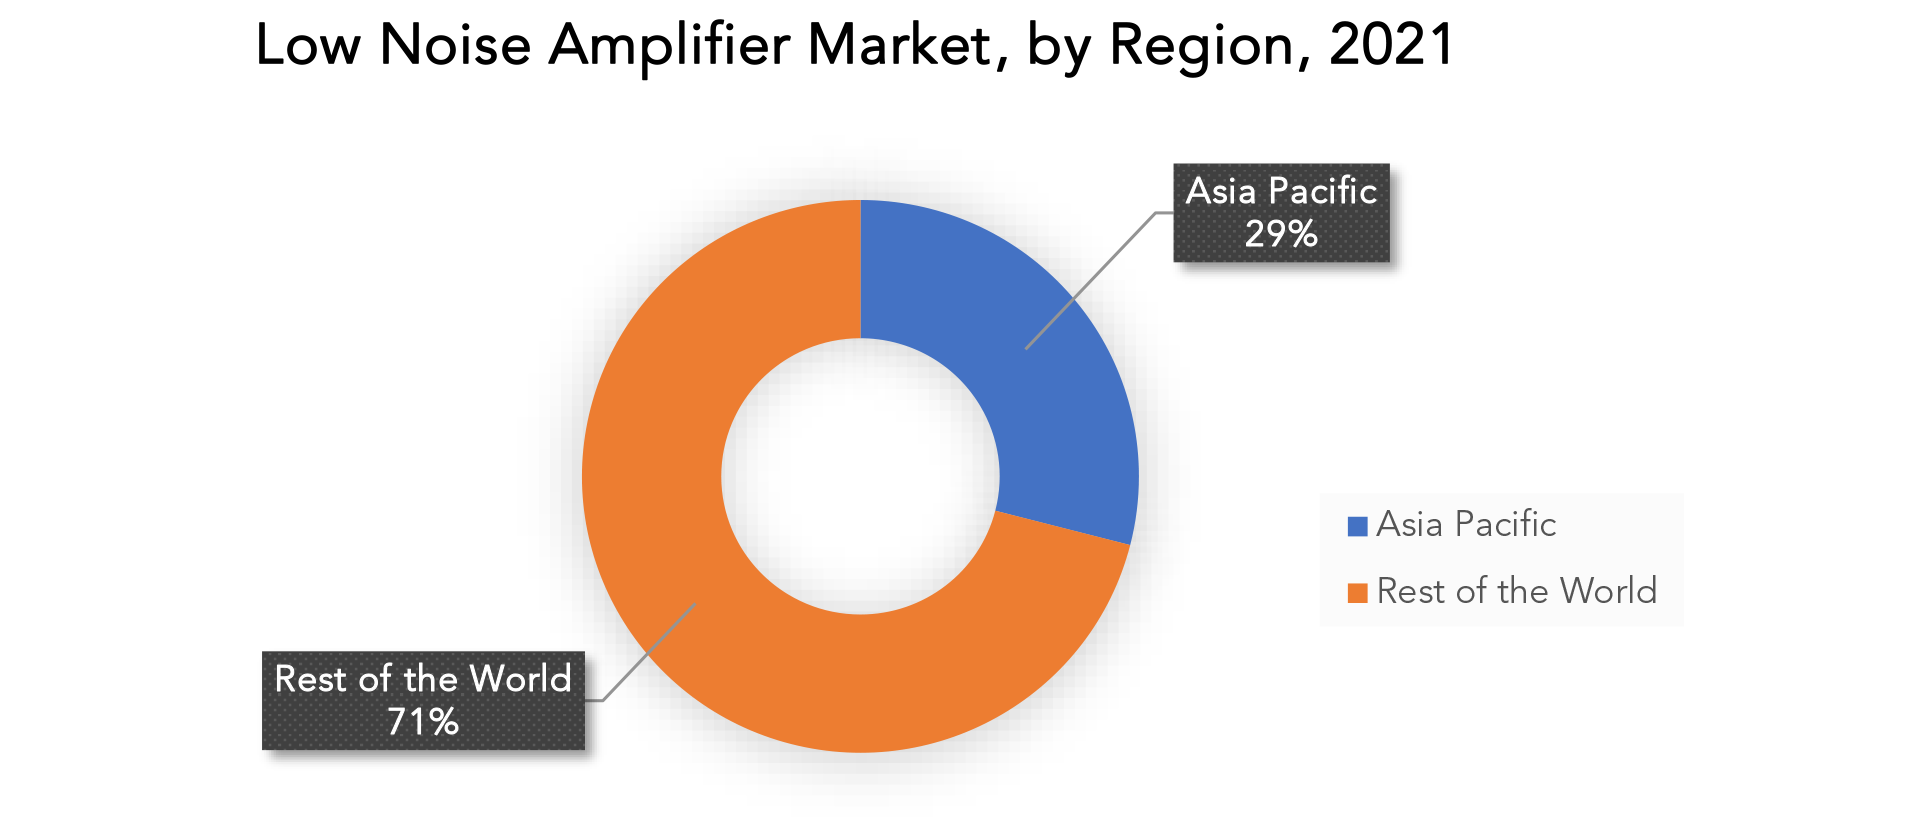
Asia Pacific held more than 29% of the low noise amplifier market revenue share in 2021 and will witness expansion in the forecast period.
• What are some of the market's driving forces?
The market for low noise amplifiers (LNAs) is primarily driven by the rising demand for wireless communication equipment and services. The need for LNAs has increased as a result of the growing use of smartphones, tablets, and other mobile devices as well as the expansion of wireless networks. High-performance LNAs are more essential as consumers expect connectivity that is quicker and more dependable. LNA demand is also being fueled by the continuing transition to 5G technology, which requires more sophisticated and high-frequency LNAs to enable larger data rates and lower latency.
• Which are the top companies to hold the market share in low noise amplifier market?
The Low Noise Amplifier market key Analog Devices Inc, Infineon Technologies AG, Texas Instruments Inc, NXP Semiconductors Inc, MACOM Technology Solutions Inc, Skyworks Solutions Inc, Broadcom Inc, ON Semiconductor Corporation, Toshiba Electronic Devices 7 Storage Corporation, microchip Technology Inc.
• What is the leading type of low noise amplifier market?
Based on Type, Silicon LNAs are the most widely used and are found in a wide range of applications, including satellite communication, wireless communication, and navigation systems. LNAs made of gallium arsenide (GaAs) are utilized in high-frequency applications and perform better than silicon LNAs.
• Which is the largest regional market for low noise amplifier market?
Asia Pacific accounts for 29% of the market for low noise amplifier worldwide. The low noise amplifier (LNA) market in the Asia Pacific region is expected to grow significantly in the coming years, driven by increasing demand for wireless communication devices and the deployment of 5G technology. The region has witnessed rapid technological advancements in countries such as China, Japan, South Korea, and India, which are major contributors to the growth of the LNA market. Additionally, the increasing adoption of Internet of Things (IoT) devices and smart home appliances is further expected to boost the demand for LNAs in the region.
Low Noise Amplifier Market Segment Analysis
The low noise amplifier market is segmented based on type, frequency, application and region, Based on Type, Silicon LNAs are the most widely used and are found in a wide range of applications, including satellite communication, wireless communication, and navigation systems. LNAs made of gallium arsenide (GaAs) are utilized in high-frequency applications and perform better than silicon LNAs. Based on Frequency, RF LNAs operate in the frequency range of 3 kHz to 3 GHz and are widely used in wireless communication systems such as mobile phones, satellite communications, and wireless local area networks (WLANs). F LNAs operate in the frequency range of 10 kHz to 1 GHz and are primarily used in radio and television receivers, as well as in military and defense applications. Microwave LNAs operate in the frequency range of 1 GHz to 100 GHz and are used in radar systems, satellite communication, and microwave ovens. Based on Application, the low noise amplifier (LNA) market is segmented based on application into various industries such as telecommunications, consumer electronics, aerospace and defense, medical devices, and others. In the telecommunications industry, LNAs are used in cellular base stations, satellite communication systems, and radio and television broadcasting. In the consumer electronics industry, LNAs are used in smartphones, laptops, and Wi-Fi routers. In the aerospace and defense industry, LNAs are used in radar systems and military communication devices. [caption id="attachment_23079" align="aligncenter" width="1920"]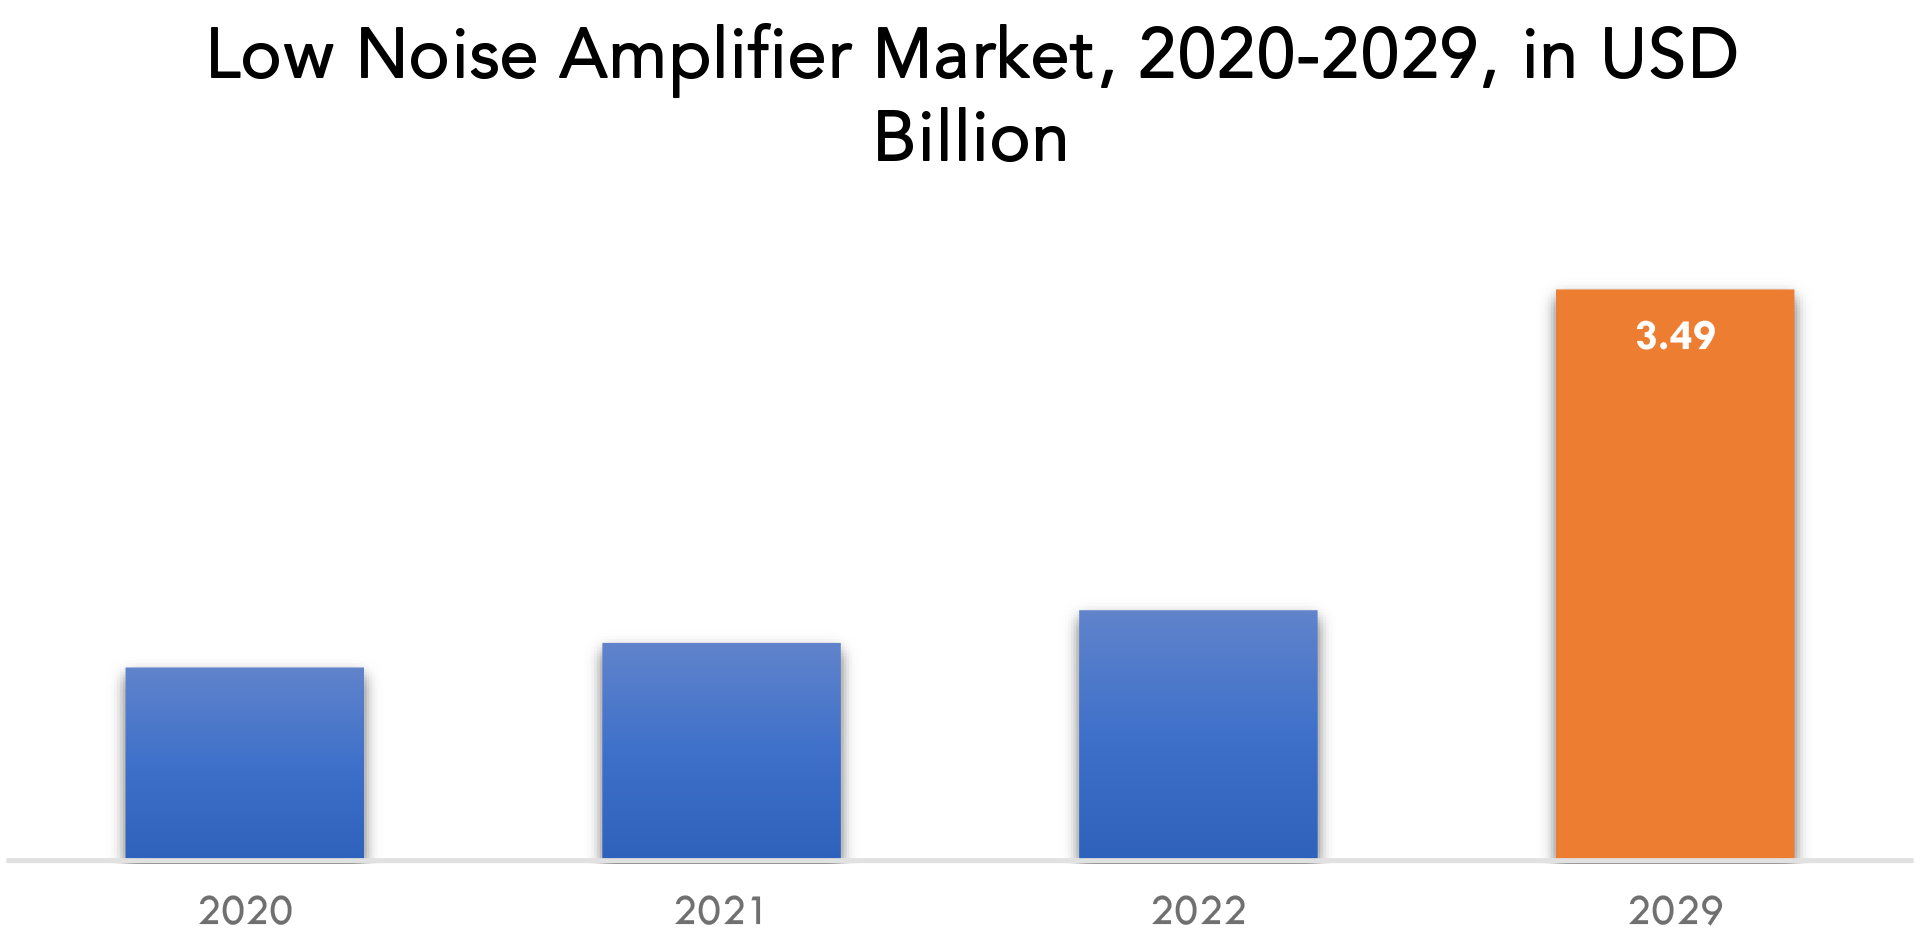
Low Noise Amplifier Market Players
The Low Noise Amplifier market key Analog Devices Inc, Infineon Technologies AG, Texas Instruments Inc, NXP Semiconductors Inc, MACOM Technology Solutions Inc, Skyworks Solutions Inc, Broadcom Inc, ON Semiconductor Corporation, Toshiba Electronic Devices & Storage Corporation, microchip Technology Inc. Industry Developments 07-03-2023: - Analog Devices, Inc. (ADI) introduced the first in a new series of iCoupler® analog amplifier isolators that offer very low offset and gain error, making them ideal for many isolated voltage sensing applications such as Inverters, DC/DC Converters, and On-Board Chargers. 27-10-2021: - Semiconductors are at the core of emerging technologies that enable digital transformation. To amplify startup engagement Infineon Technologies AG (FSE: IFX / OTCQX: IFNNY) had signed a memorandum of understanding with Hyundai Motor Group (Hyundai). Under this agreement, Infineon will support startups with product level technical expertise to enhance their success-rate and offer them the opportunity for closer collaboration within Infineon’s Co-Innovation Space in Singapore.Who Should Buy? Or Key stakeholders
- Medical
- Defense
- Aerospace
- Automotive
- Electronics
- Others
Low Noise Amplifier Market Regional Analysis
The low noise amplifier market by region includes North America, Asia-Pacific (APAC), Europe, South America, and Middle East & Africa (MEA).- North America: includes the US, Canada, Mexico
- Asia Pacific: includes China, Japan, South Korea, India, Australia, ASEAN and Rest of APAC
- Europe: includes UK, Germany, France, Italy, Spain, Russia, and Rest of Europe
- South America: includes Brazil, Argentina and Rest of South America
- Middle East & Africa: includes Turkey, UAE, Saudi Arabia, South Africa, and Rest of MEA
Key Market Segments: Low Noise Amplifier Market
Low Noise Amplifier Market by Type, 2020-2029, (USD Billion) (Thousand Units)- Silicon LNA
- Gallium Arsenide LNA
- Silicon Germanium
- Microwave
- Radio Frequency
- Intermediate Frequency
- Millimeter Wave
- Wireless Communication
- Aerospace and Defense
- Consumer Electronics
- Automotive
- Medical
- North America
- Asia Pacific
- Europe
- South America
- Middle East and Africa
Exactitude Consultancy Services Key Objectives:
- Increasing sales and market share
- Developing new technology
- Improving profitability
- Entering new markets
- Enhancing brand reputation
Key Question Answered
- What is the expected growth rate of the low noise amplifier market over the next 7 years?
- Who are the major players in the low noise amplifier market and what is their market share?
- What are the application industries driving demand for market and what is their outlook?
- What are the opportunities for growth in emerging markets such as Asia-Pacific, Middle East, And Africa?
- How is the economic environment affecting the low noise amplifier market, including factors such as interest rates, inflation, and exchange rates?
- What is the expected impact of government policies and regulations on the low noise amplifier market?
- What is the current and forecasted size and growth rate of the global low noise amplifier market?
- What are the key drivers of growth in the low noise amplifier market?
- Who are the major players in the market and what is their market share?
- What are the distribution channels and supply chain dynamics in the low noise amplifier market?
- What are the technological advancements and innovations in the low noise amplifier market and their impact on type development and growth?
- What are the regulatory considerations and their impact on the market?
- What are the challenges faced by players in the low noise amplifier market and how are they addressing these challenges?
- What are the opportunities for growth and expansion in the low noise amplifier market?
- What are the service offerings and specifications of leading players in the market?
- What is the pricing trend of low noise amplifier in the market and what is the impact of raw process prices on the price trend?
- INTRODUCTION
- MARKET DEFINITION
- MARKET SEGMENTATION
- RESEARCH TIMELINES
- ASSUMPTIONS AND LIMITATIONS
- RESEARCH METHODOLOGY
- DATA MINING
- SECONDARY RESEARCH
- PRIMARY RESEARCH
- SUBJECT-MATTER EXPERTS’ ADVICE
- QUALITY CHECKS
- FINAL REVIEW
- DATA TRIANGULATION
- BOTTOM-UP APPROACH
- TOP-DOWN APPROACH
- RESEARCH FLOW
- DATA SOURCES
- DATA MINING
- EXECUTIVE SUMMARY
- MARKET OVERVIEW
- GLOBAL LOW NOISE AMPLIFIER MARKET OUTLOOK
- MARKET DRIVERS
- MARKET RESTRAINTS
- MARKET OPPORTUNITIES
- IMPACT OF COVID-19 ON LOW NOISE AMPLIFIER MARKET
- PORTER’S FIVE FORCES MODEL
- THREAT FROM NEW ENTRANTS
- THREAT FROM SUBSTITUTES
- BARGAINING POWER OF SUPPLIERS
- BARGAINING POWER OF CUSTOMERS
- DEGREE OF COMPETITION
- INDUSTRY VALUE CHAIN ANALYSIS
- GLOBAL LOW NOISE AMPLIFIER MARKET OUTLOOK
- GLOBAL LOW NOISE AMPLIFIER MARKET BY TYPE (USD BILLION, THOUSAND UNITS), 2020-2029
- SILICON LNA
- GALLIUM ARSENIDE LNA
- SILICON GERMANIUM
- GLOBAL LOW NOISE AMPLIFIER MARKET BY FREQUENCY (USD BILLION, THOUSAND UNITS), 2020-2029
- MICROWAVE
- RADIO FREQUENCY
- INTERMEDIATE FREQUENCY
- MILLIMETER WAVE
- GLOBAL LOW NOISE AMPLIFIER MARKET BY APPLICATION (USD BILLION, THOUSAND UNITS), 2020-2029
- WIRELESS COMMUNICATION
- AEROSPACE AND DEFENSE
- CONSUMER ELECTRONICS
- AUTOMOTIVE
- MEDICAL
- GLOBAL LOW NOISE AMPLIFIER MARKET BY REGION (USD BILLION, THOUSAND UNITS), 2020-2029
- NORTH AMERICA
- US
- CANADA
- MEXICO
- SOUTH AMERICA
- BRAZIL
- ARGENTINA
- COLOMBIA
- REST OF SOUTH AMERICA
- EUROPE
- GERMANY
- UK
- FRANCE
- ITALY
- SPAIN
- RUSSIA
- REST OF EUROPE
- ASIA PACIFIC
- INDIA
- CHINA
- JAPAN
- SOUTH KOREA
- AUSTRALIA
- SOUTH-EAST ASIA
- REST OF ASIA PACIFIC
- MIDDLE EAST AND AFRICA
- UAE
- SAUDI ARABIA
- SOUTH AFRICA
- REST OF MIDDLE EAST AND AFRICA
- NORTH AMERICA
-
COMPANY PROFILES*
(BUSINESS OVERVIEW, COMPANY SNAPSHOT, PRODUCTS OFFERED, RECENT DEVELOPMENTS)
- ANALOG DEVICES INC
- INFINEON TECHNOLOGIES AG
- TEXAS INSTRUMENTS INC
- NXP SEMICONDUCTORS INC
- MACOM TECHNOLOGY SOLUTIONS INC
- SKYWORKS INC
- BROADCOM INC
- ON SEMICONDUCTOR CORPORATION
- TOSHIBA ELECTRONIC DEVICES & STORAGE CORPORATION
- MICROCHIP TECHNOLOGY INC
*THE COMPANY LIST IS INDICATIVE
LIST OF TABLES
TABLE 1 GLOBAL LOW NOISE AMPLIFIER MARKET BY TYPE (USD BILLION) 2020-2029
TABLE 2 GLOBAL LOW NOISE AMPLIFIER MARKET BY TYPE (THOUSAND UNITS) 2020-2029
TABLE 3 GLOBAL LOW NOISE AMPLIFIER MARKET BY FREQUENCY (USD BILLION) 2020-2029
TABLE 4 GLOBAL LOW NOISE AMPLIFIER MARKET BY FREQUENCY (THOUSAND UNITS) 2020-2029
TABLE 5 GLOBAL LOW NOISE AMPLIFIER MARKET BY APPLICATION (USD BILLION) 2020-2029
TABLE 6 GLOBAL LOW NOISE AMPLIFIER MARKET BY APPLICATION (THOUSAND UNITS) 2020-2029
TABLE 7 GLOBAL LOW NOISE AMPLIFIER MARKET BY REGION (USD BILLION) 2020-2029
TABLE 8 GLOBAL LOW NOISE AMPLIFIER MARKET BY REGION (THOUSAND UNITS) 2020-2029
TABLE 9 NORTH AMERICA LOW NOISE AMPLIFIER MARKET BY COUNTRY (USD BILLION) 2020-2029
TABLE 10 NORTH AMERICA LOW NOISE AMPLIFIER MARKET BY COUNTRY (THOUSAND UNITS) 2020-2029
TABLE 11 NORTH AMERICA LOW NOISE AMPLIFIER MARKET BY TYPE (USD BILLION) 2020-2029
TABLE 12 NORTH AMERICA LOW NOISE AMPLIFIER MARKET BY TYPE (THOUSAND UNITS) 2020-2029
TABLE 13 NORTH AMERICA LOW NOISE AMPLIFIER MARKET BY FREQUENCY (USD BILLION) 2020-2029
TABLE 14 NORTH AMERICA LOW NOISE AMPLIFIER MARKET BY FREQUENCY (THOUSAND UNITS) 2020-2029
TABLE 15 NORTH AMERICA LOW NOISE AMPLIFIER MARKET BY APPLICATION (USD BILLION) 2020-2029
TABLE 16 NORTH AMERICA LOW NOISE AMPLIFIER MARKET BY APPLICATION (THOUSAND UNITS) 2020-2029
TABLE 17 US LOW NOISE AMPLIFIER MARKET BY TYPE (USD BILLION) 2020-2029
TABLE 18 US LOW NOISE AMPLIFIER MARKET BY TYPE (THOUSAND UNITS) 2020-2029
TABLE 19 US LOW NOISE AMPLIFIER MARKET BY FREQUENCY (USD BILLION) 2020-2029
TABLE 20 US LOW NOISE AMPLIFIER MARKET BY FREQUENCY (THOUSAND UNITS) 2020-2029
TABLE 21 US LOW NOISE AMPLIFIER MARKET BY APPLICATION (USD BILLION) 2020-2029
TABLE 22 US LOW NOISE AMPLIFIER MARKET BY APPLICATION (THOUSAND UNITS) 2020-2029
TABLE 23 CANADA LOW NOISE AMPLIFIER MARKET BY TYPE (USD BILLION) 2020-2029
TABLE 24 CANADA LOW NOISE AMPLIFIER MARKET BY TYPE (THOUSAND UNITS) 2020-2029
TABLE 25 CANADA LOW NOISE AMPLIFIER MARKET BY FREQUENCY (USD BILLION) 2020-2029
TABLE 26 CANADA LOW NOISE AMPLIFIER MARKET BY FREQUENCY (THOUSAND UNITS) 2020-2029
TABLE 27 CANADA LOW NOISE AMPLIFIER MARKET BY APPLICATION (USD BILLION) 2020-2029
TABLE 28 CANADA LOW NOISE AMPLIFIER MARKET BY APPLICATION (THOUSAND UNITS) 2020-2029
TABLE 29 MEXICO LOW NOISE AMPLIFIER MARKET BY TYPE (USD BILLION) 2020-2029
TABLE 30 MEXICO LOW NOISE AMPLIFIER MARKET BY TYPE (THOUSAND UNITS) 2020-2029
TABLE 31 MEXICO LOW NOISE AMPLIFIER MARKET BY FREQUENCY (USD BILLION) 2020-2029
TABLE 32 MEXICO LOW NOISE AMPLIFIER MARKET BY FREQUENCY (THOUSAND UNITS) 2020-2029
TABLE 33 MEXICO LOW NOISE AMPLIFIER MARKET BY APPLICATION (USD BILLION) 2020-2029
TABLE 34 MEXICO LOW NOISE AMPLIFIER MARKET BY APPLICATION (THOUSAND UNITS) 2020-2029
TABLE 35 SOUTH AMERICA LOW NOISE AMPLIFIER MARKET BY COUNTRY (USD BILLION) 2020-2029
TABLE 36 SOUTH AMERICA LOW NOISE AMPLIFIER MARKET BY COUNTRY (THOUSAND UNITS) 2020-2029
TABLE 37 SOUTH AMERICA LOW NOISE AMPLIFIER MARKET BY TYPE (USD BILLION) 2020-2029
TABLE 38 SOUTH AMERICA LOW NOISE AMPLIFIER MARKET BY TYPE (THOUSAND UNITS) 2020-2029
TABLE 39 SOUTH AMERICA LOW NOISE AMPLIFIER MARKET BY FREQUENCY (USD BILLION) 2020-2029
TABLE 40 SOUTH AMERICA LOW NOISE AMPLIFIER MARKET BY FREQUENCY (THOUSAND UNITS) 2020-2029
TABLE 41 SOUTH AMERICA LOW NOISE AMPLIFIER MARKET BY APPLICATION (USD BILLION) 2020-2029
TABLE 42 SOUTH AMERICA LOW NOISE AMPLIFIER MARKET BY APPLICATION (THOUSAND UNITS) 2020-2029
TABLE 43 BRAZIL LOW NOISE AMPLIFIER MARKET BY TYPE (USD BILLION) 2020-2029
TABLE 44 BRAZIL LOW NOISE AMPLIFIER MARKET BY TYPE (THOUSAND UNITS) 2020-2029
TABLE 45 BRAZIL LOW NOISE AMPLIFIER MARKET BY FREQUENCY (USD BILLION) 2020-2029
TABLE 46 BRAZIL LOW NOISE AMPLIFIER MARKET BY FREQUENCY (THOUSAND UNITS) 2020-2029
TABLE 47 BRAZIL LOW NOISE AMPLIFIER MARKET BY APPLICATION (USD BILLION) 2020-2029
TABLE 48 BRAZIL LOW NOISE AMPLIFIER MARKET BY APPLICATION (THOUSAND UNITS) 2020-2029
TABLE 49 ARGENTINA LOW NOISE AMPLIFIER MARKET BY TYPE (USD BILLION) 2020-2029
TABLE 50 ARGENTINA LOW NOISE AMPLIFIER MARKET BY TYPE (THOUSAND UNITS) 2020-2029
TABLE 51 ARGENTINA LOW NOISE AMPLIFIER MARKET BY FREQUENCY (USD BILLION) 2020-2029
TABLE 52 ARGENTINA LOW NOISE AMPLIFIER MARKET BY FREQUENCY (THOUSAND UNITS) 2020-2029
TABLE 53 ARGENTINA LOW NOISE AMPLIFIER MARKET BY APPLICATION (USD BILLION) 2020-2029
TABLE 54 ARGENTINA LOW NOISE AMPLIFIER MARKET BY APPLICATION (THOUSAND UNITS) 2020-2029
TABLE 55 COLOMBIA LOW NOISE AMPLIFIER MARKET BY TYPE (USD BILLION) 2020-2029
TABLE 56 COLOMBIA LOW NOISE AMPLIFIER MARKET BY TYPE (THOUSAND UNITS) 2020-2029
TABLE 57 COLOMBIA LOW NOISE AMPLIFIER MARKET BY FREQUENCY (USD BILLION) 2020-2029
TABLE 58 COLOMBIA LOW NOISE AMPLIFIER MARKET BY FREQUENCY (THOUSAND UNITS) 2020-2029
TABLE 59 COLOMBIA LOW NOISE AMPLIFIER MARKET BY APPLICATION (USD BILLION) 2020-2029
TABLE 60 COLOMBIA LOW NOISE AMPLIFIER MARKET BY APPLICATION (THOUSAND UNITS) 2020-2029
TABLE 61 REST OF SOUTH AMERICA LOW NOISE AMPLIFIER MARKET BY TYPE (USD BILLION) 2020-2029
TABLE 62 REST OF SOUTH AMERICA LOW NOISE AMPLIFIER MARKET BY TYPE (THOUSAND UNITS) 2020-2029
TABLE 63 REST OF SOUTH AMERICA LOW NOISE AMPLIFIER MARKET BY FREQUENCY (USD BILLION) 2020-2029
TABLE 64 REST OF SOUTH AMERICA LOW NOISE AMPLIFIER MARKET BY FREQUENCY (THOUSAND UNITS) 2020-2029
TABLE 65 REST OF SOUTH AMERICA LOW NOISE AMPLIFIER MARKET BY APPLICATION (USD BILLION) 2020-2029
TABLE 66 REST OF SOUTH AMERICA LOW NOISE AMPLIFIER MARKET BY APPLICATION (THOUSAND UNITS) 2020-2029
TABLE 67 ASIA-PACIFIC LOW NOISE AMPLIFIER MARKET BY COUNTRY (USD BILLION) 2020-2029
TABLE 68 ASIA-PACIFIC LOW NOISE AMPLIFIER MARKET BY COUNTRY (THOUSAND UNITS) 2020-2029
TABLE 69 ASIA-PACIFIC LOW NOISE AMPLIFIER MARKET BY TYPE (USD BILLION) 2020-2029
TABLE 70 ASIA-PACIFIC LOW NOISE AMPLIFIER MARKET BY TYPE (THOUSAND UNITS) 2020-2029
TABLE 71 ASIA-PACIFIC LOW NOISE AMPLIFIER MARKET BY FREQUENCY (USD BILLION) 2020-2029
TABLE 72 ASIA-PACIFIC LOW NOISE AMPLIFIER MARKET BY FREQUENCY (THOUSAND UNITS) 2020-2029
TABLE 73 ASIA-PACIFIC LOW NOISE AMPLIFIER MARKET BY APPLICATION (USD BILLION) 2020-2029
TABLE 74 ASIA-PACIFIC LOW NOISE AMPLIFIER MARKET BY APPLICATION (THOUSAND UNITS) 2020-2029
TABLE 75 INDIA LOW NOISE AMPLIFIER MARKET BY TYPE (USD BILLION) 2020-2029
TABLE 76 INDIA LOW NOISE AMPLIFIER MARKET BY TYPE (THOUSAND UNITS) 2020-2029
TABLE 77 INDIA LOW NOISE AMPLIFIER MARKET BY FREQUENCY (USD BILLION) 2020-2029
TABLE 78 INDIA LOW NOISE AMPLIFIER MARKET BY FREQUENCY (THOUSAND UNITS) 2020-2029
TABLE 79 INDIA LOW NOISE AMPLIFIER MARKET BY APPLICATION (USD BILLION) 2020-2029
TABLE 80 INDIA LOW NOISE AMPLIFIER MARKET BY APPLICATION (THOUSAND UNITS) 2020-2029
TABLE 81 CHINA LOW NOISE AMPLIFIER MARKET BY TYPE (USD BILLION) 2020-2029
TABLE 82 CHINA LOW NOISE AMPLIFIER MARKET BY TYPE (THOUSAND UNITS) 2020-2029
TABLE 83 CHINA LOW NOISE AMPLIFIER MARKET BY FREQUENCY (USD BILLION) 2020-2029
TABLE 84 CHINA LOW NOISE AMPLIFIER MARKET BY FREQUENCY (THOUSAND UNITS) 2020-2029
TABLE 85 CHINA LOW NOISE AMPLIFIER MARKET BY APPLICATION (USD BILLION) 2020-2029
TABLE 86 CHINA LOW NOISE AMPLIFIER MARKET BY APPLICATION (THOUSAND UNITS) 2020-2029
TABLE 87 JAPAN LOW NOISE AMPLIFIER MARKET BY TYPE (USD BILLION) 2020-2029
TABLE 88 JAPAN LOW NOISE AMPLIFIER MARKET BY TYPE (THOUSAND UNITS) 2020-2029
TABLE 89 JAPAN LOW NOISE AMPLIFIER MARKET BY FREQUENCY (USD BILLION) 2020-2029
TABLE 90 JAPAN LOW NOISE AMPLIFIER MARKET BY FREQUENCY (THOUSAND UNITS) 2020-2029
TABLE 91 JAPAN LOW NOISE AMPLIFIER MARKET BY APPLICATION (USD BILLION) 2020-2029
TABLE 92 JAPAN LOW NOISE AMPLIFIER MARKET BY APPLICATION (THOUSAND UNITS) 2020-2029
TABLE 93 SOUTH KOREA LOW NOISE AMPLIFIER MARKET BY TYPE (USD BILLION) 2020-2029
TABLE 94 SOUTH KOREA LOW NOISE AMPLIFIER MARKET BY TYPE (THOUSAND UNITS) 2020-2029
TABLE 95 SOUTH KOREA LOW NOISE AMPLIFIER MARKET BY FREQUENCY (USD BILLION) 2020-2029
TABLE 96 SOUTH KOREA LOW NOISE AMPLIFIER MARKET BY FREQUENCY (THOUSAND UNITS) 2020-2029
TABLE 97 SOUTH KOREA LOW NOISE AMPLIFIER MARKET BY APPLICATION (USD BILLION) 2020-2029
TABLE 98 SOUTH KOREA LOW NOISE AMPLIFIER MARKET BY APPLICATION (THOUSAND UNITS) 2020-2029
TABLE 99 AUSTRALIA LOW NOISE AMPLIFIER MARKET BY TYPE (USD BILLION) 2020-2029
TABLE 100 AUSTRALIA LOW NOISE AMPLIFIER MARKET BY TYPE (THOUSAND UNITS) 2020-2029
TABLE 101 AUSTRALIA LOW NOISE AMPLIFIER MARKET BY FREQUENCY (USD BILLION) 2020-2029
TABLE 102 AUSTRALIA LOW NOISE AMPLIFIER MARKET BY FREQUENCY (THOUSAND UNITS) 2020-2029
TABLE 103 AUSTRALIA LOW NOISE AMPLIFIER MARKET BY APPLICATION (USD BILLION) 2020-2029
TABLE 104 AUSTRALIA LOW NOISE AMPLIFIER MARKET BY APPLICATION (THOUSAND UNITS) 2020-2029
TABLE 105 SOUTH-EAST ASIA LOW NOISE AMPLIFIER MARKET BY TYPE (USD BILLION) 2020-2029
TABLE 106 SOUTH-EAST ASIA LOW NOISE AMPLIFIER MARKET BY TYPE (THOUSAND UNITS) 2020-2029
TABLE 107 SOUTH-EAST ASIA LOW NOISE AMPLIFIER MARKET BY FREQUENCY (USD BILLION) 2020-2029
TABLE 108 SOUTH-EAST ASIA LOW NOISE AMPLIFIER MARKET BY FREQUENCY (THOUSAND UNITS) 2020-2029
TABLE 109 SOUTH-EAST ASIA LOW NOISE AMPLIFIER MARKET BY APPLICATION (USD BILLION) 2020-2029
TABLE 110 SOUTH-EAST ASIA LOW NOISE AMPLIFIER MARKET BY APPLICATION (THOUSAND UNITS) 2020-2029
TABLE 111 REST OF ASIA PACIFIC LOW NOISE AMPLIFIER MARKET BY TYPE (USD BILLION) 2020-2029
TABLE 112 REST OF ASIA PACIFIC LOW NOISE AMPLIFIER MARKET BY TYPE (THOUSAND UNITS) 2020-2029
TABLE 113 REST OF ASIA PACIFIC LOW NOISE AMPLIFIER MARKET BY FREQUENCY (USD BILLION) 2020-2029
TABLE 114 REST OF ASIA PACIFIC LOW NOISE AMPLIFIER MARKET BY FREQUENCY (THOUSAND UNITS) 2020-2029
TABLE 115 REST OF ASIA PACIFIC LOW NOISE AMPLIFIER MARKET BY APPLICATION (USD BILLION) 2020-2029
TABLE 116 REST OF ASIA PACIFIC LOW NOISE AMPLIFIER MARKET BY APPLICATION (THOUSAND UNITS) 2020-2029
TABLE 117 EUROPE LOW NOISE AMPLIFIER MARKET BY COUNTRY (USD BILLION) 2020-2029
TABLE 118 EUROPE LOW NOISE AMPLIFIER MARKET BY COUNTRY (THOUSAND UNITS) 2020-2029
TABLE 119 EUROPE LOW NOISE AMPLIFIER MARKET BY TYPE (USD BILLION) 2020-2029
TABLE 120 EUROPE LOW NOISE AMPLIFIER MARKET BY TYPE (THOUSAND UNITS) 2020-2029
TABLE 121 EUROPE LOW NOISE AMPLIFIER MARKET BY FREQUENCY (USD BILLION) 2020-2029
TABLE 122 EUROPE LOW NOISE AMPLIFIER MARKET BY FREQUENCY (THOUSAND UNITS) 2020-2029
TABLE 123 EUROPE LOW NOISE AMPLIFIER MARKET BY APPLICATION (USD BILLION) 2020-2029
TABLE 124 EUROPE LOW NOISE AMPLIFIER MARKET BY APPLICATION (THOUSAND UNITS) 2020-2029
TABLE 125 GERMANY LOW NOISE AMPLIFIER MARKET BY TYPE (USD BILLION) 2020-2029
TABLE 126 GERMANY LOW NOISE AMPLIFIER MARKET BY TYPE (THOUSAND UNITS) 2020-2029
TABLE 127 GERMANY LOW NOISE AMPLIFIER MARKET BY FREQUENCY (USD BILLION) 2020-2029
TABLE 128 GERMANY LOW NOISE AMPLIFIER MARKET BY FREQUENCY (THOUSAND UNITS) 2020-2029
TABLE 129 GERMANY LOW NOISE AMPLIFIER MARKET BY APPLICATION (USD BILLION) 2020-2029
TABLE 130 GERMANY LOW NOISE AMPLIFIER MARKET BY APPLICATION (THOUSAND UNITS) 2020-2029
TABLE 131 UK LOW NOISE AMPLIFIER MARKET BY TYPE (USD BILLION) 2020-2029
TABLE 132 UK LOW NOISE AMPLIFIER MARKET BY TYPE (THOUSAND UNITS) 2020-2029
TABLE 133 UK LOW NOISE AMPLIFIER MARKET BY FREQUENCY (USD BILLION) 2020-2029
TABLE 134 UK LOW NOISE AMPLIFIER MARKET BY FREQUENCY (THOUSAND UNITS) 2020-2029
TABLE 135 UK LOW NOISE AMPLIFIER MARKET BY APPLICATION (USD BILLION) 2020-2029
TABLE 136 UK LOW NOISE AMPLIFIER MARKET BY APPLICATION (THOUSAND UNITS) 2020-2029
TABLE 137 FRANCE LOW NOISE AMPLIFIER MARKET BY TYPE (USD BILLION) 2020-2029
TABLE 138 FRANCE LOW NOISE AMPLIFIER MARKET BY TYPE (THOUSAND UNITS) 2020-2029
TABLE 139 FRANCE LOW NOISE AMPLIFIER MARKET BY FREQUENCY (USD BILLION) 2020-2029
TABLE 140 FRANCE LOW NOISE AMPLIFIER MARKET BY FREQUENCY (THOUSAND UNITS) 2020-2029
TABLE 141 FRANCE LOW NOISE AMPLIFIER MARKET BY APPLICATION (USD BILLION) 2020-2029
TABLE 142 FRANCE LOW NOISE AMPLIFIER MARKET BY APPLICATION (THOUSAND UNITS) 2020-2029
TABLE 143 ITALY LOW NOISE AMPLIFIER MARKET BY TYPE (USD BILLION) 2020-2029
TABLE 144 ITALY LOW NOISE AMPLIFIER MARKET BY TYPE (THOUSAND UNITS) 2020-2029
TABLE 145 ITALY LOW NOISE AMPLIFIER MARKET BY FREQUENCY (USD BILLION) 2020-2029
TABLE 146 ITALY LOW NOISE AMPLIFIER MARKET BY FREQUENCY (THOUSAND UNITS) 2020-2029
TABLE 147 ITALY LOW NOISE AMPLIFIER MARKET BY APPLICATION (USD BILLION) 2020-2029
TABLE 148 ITALY LOW NOISE AMPLIFIER MARKET BY APPLICATION (THOUSAND UNITS) 2020-2029
TABLE 149 SPAIN LOW NOISE AMPLIFIER MARKET BY TYPE (USD BILLION) 2020-2029
TABLE 150 SPAIN LOW NOISE AMPLIFIER MARKET BY TYPE (THOUSAND UNITS) 2020-2029
TABLE 151 SPAIN LOW NOISE AMPLIFIER MARKET BY FREQUENCY (USD BILLION) 2020-2029
TABLE 152 SPAIN LOW NOISE AMPLIFIER MARKET BY FREQUENCY (THOUSAND UNITS) 2020-2029
TABLE 153 SPAIN LOW NOISE AMPLIFIER MARKET BY APPLICATION (USD BILLION) 2020-2029
TABLE 154 SPAIN LOW NOISE AMPLIFIER MARKET BY APPLICATION (THOUSAND UNITS) 2020-2029
TABLE 155 RUSSIA LOW NOISE AMPLIFIER MARKET BY TYPE (USD BILLION) 2020-2029
TABLE 156 RUSSIA LOW NOISE AMPLIFIER MARKET BY TYPE (THOUSAND UNITS) 2020-2029
TABLE 157 RUSSIA LOW NOISE AMPLIFIER MARKET BY FREQUENCY (USD BILLION) 2020-2029
TABLE 158 RUSSIA LOW NOISE AMPLIFIER MARKET BY FREQUENCY (THOUSAND UNITS) 2020-2029
TABLE 159 RUSSIA LOW NOISE AMPLIFIER MARKET BY APPLICATION (USD BILLION) 2020-2029
TABLE 160 RUSSIA LOW NOISE AMPLIFIER MARKET BY APPLICATION (THOUSAND UNITS) 2020-2029
TABLE 161 REST OF EUROPE LOW NOISE AMPLIFIER MARKET BY TYPE (USD BILLION) 2020-2029
TABLE 162 REST OF EUROPE LOW NOISE AMPLIFIER MARKET BY TYPE (THOUSAND UNITS) 2020-2029
TABLE 163 REST OF EUROPE LOW NOISE AMPLIFIER MARKET BY FREQUENCY (USD BILLION) 2020-2029
TABLE 164 REST OF EUROPE LOW NOISE AMPLIFIER MARKET BY FREQUENCY (THOUSAND UNITS) 2020-2029
TABLE 165 REST OF EUROPE LOW NOISE AMPLIFIER MARKET BY APPLICATION (USD BILLION) 2020-2029
TABLE 166 REST OF EUROPE LOW NOISE AMPLIFIER MARKET BY APPLICATION (THOUSAND UNITS) 2020-2029
TABLE 167 MIDDLE EAST AND AFRICA LOW NOISE AMPLIFIER MARKET BY COUNTRY (USD BILLION) 2020-2029
TABLE 168 MIDDLE EAST AND AFRICA LOW NOISE AMPLIFIER MARKET BY COUNTRY (THOUSAND UNITS) 2020-2029
TABLE 169 MIDDLE EAST AND AFRICA LOW NOISE AMPLIFIER MARKET BY TYPE (USD BILLION) 2020-2029
TABLE 170 MIDDLE EAST AND AFRICA LOW NOISE AMPLIFIER MARKET BY TYPE (THOUSAND UNITS) 2020-2029
TABLE 171 MIDDLE EAST AND AFRICA LOW NOISE AMPLIFIER MARKET BY FREQUENCY (USD BILLION) 2020-2029
TABLE 172 MIDDLE EAST AND AFRICA LOW NOISE AMPLIFIER MARKET BY FREQUENCY (THOUSAND UNITS) 2020-2029
TABLE 173 MIDDLE EAST AND AFRICA LOW NOISE AMPLIFIER MARKET BY APPLICATION (USD BILLION) 2020-2029
TABLE 174 MIDDLE EAST AND AFRICA LOW NOISE AMPLIFIER MARKET BY APPLICATION (THOUSAND UNITS) 2020-2029
TABLE 175 UAE LOW NOISE AMPLIFIER MARKET BY TYPE (USD BILLION) 2020-2029
TABLE 176 UAE LOW NOISE AMPLIFIER MARKET BY TYPE (THOUSAND UNITS) 2020-2029
TABLE 177 UAE LOW NOISE AMPLIFIER MARKET BY FREQUENCY (USD BILLION) 2020-2029
TABLE 178 UAE LOW NOISE AMPLIFIER MARKET BY FREQUENCY (THOUSAND UNITS) 2020-2029
TABLE 179 UAE LOW NOISE AMPLIFIER MARKET BY APPLICATION (USD BILLION) 2020-2029
TABLE 180 UAE LOW NOISE AMPLIFIER MARKET BY APPLICATION (THOUSAND UNITS) 2020-2029
TABLE 181 SAUDI ARABIA LOW NOISE AMPLIFIER MARKET BY TYPE (USD BILLION) 2020-2029
TABLE 182 SAUDI ARABIA LOW NOISE AMPLIFIER MARKET BY TYPE (THOUSAND UNITS) 2020-2029
TABLE 183 SAUDI ARABIA LOW NOISE AMPLIFIER MARKET BY FREQUENCY (USD BILLION) 2020-2029
TABLE 184 SAUDI ARABIA LOW NOISE AMPLIFIER MARKET BY FREQUENCY (THOUSAND UNITS) 2020-2029
TABLE 185 SAUDI ARABIA LOW NOISE AMPLIFIER MARKET BY APPLICATION (USD BILLION) 2020-2029
TABLE 186 SAUDI ARABIA LOW NOISE AMPLIFIER MARKET BY APPLICATION (THOUSAND UNITS) 2020-2029
TABLE 187 SOUTH AFRICA LOW NOISE AMPLIFIER MARKET BY TYPE (USD BILLION) 2020-2029
TABLE 188 SOUTH AFRICA LOW NOISE AMPLIFIER MARKET BY TYPE (THOUSAND UNITS) 2020-2029
TABLE 189 SOUTH AFRICA LOW NOISE AMPLIFIER MARKET BY FREQUENCY (USD BILLION) 2020-2029
TABLE 190 SOUTH AFRICA LOW NOISE AMPLIFIER MARKET BY FREQUENCY (THOUSAND UNITS) 2020-2029
TABLE 191 SOUTH AFRICA LOW NOISE AMPLIFIER MARKET BY APPLICATION (USD BILLION) 2020-2029
TABLE 192 SOUTH AFRICA LOW NOISE AMPLIFIER MARKET BY APPLICATION (THOUSAND UNITS) 2020-2029
TABLE 193 REST OF MIDDLE EAST AND AFRICA LOW NOISE AMPLIFIER MARKET BY TYPE (USD BILLION) 2020-2029
TABLE 194 REST OF MIDDLE EAST AND AFRICA LOW NOISE AMPLIFIER MARKET BY TYPE (THOUSAND UNITS) 2020-2029
TABLE 195 REST OF MIDDLE EAST AND AFRICA LOW NOISE AMPLIFIER MARKET BY FREQUENCY (USD BILLION) 2020-2029
TABLE 196 REST OF MIDDLE EAST AND AFRICA LOW NOISE AMPLIFIER MARKET BY FREQUENCY (THOUSAND UNITS) 2020-2029
TABLE 197 REST OF MIDDLE EAST AND AFRICA LOW NOISE AMPLIFIER MARKET BY APPLICATION (USD BILLION) 2020-2029
TABLE 198 REST OF MIDDLE EAST AND AFRICA LOW NOISE AMPLIFIER MARKET BY APPLICATION (THOUSAND UNITS) 2020-2029
LIST OF FIGURES
FIGURE 1 MARKET DYNAMICS
FIGURE 2 REPORT TIMELINES: YEARS CONSIDERED
FIGURE 3 BOTTOM-UP APPROACH
FIGURE 4 RESEARCH FLOW
FIGURE 5 GLOBAL LOW NOISE AMPLIFIER MARKET BY TYPE, USD BILLION, 2020-2029
FIGURE 6 GLOBAL LOW NOISE AMPLIFIER MARKET BY FREQUENCY, USD BILLION, 2020-2029
FIGURE 7 GLOBAL LOW NOISE AMPLIFIER MARKET BY APPLICATION, USD BILLION, 2020-2029
FIGURE 8 GLOBAL LOW NOISE AMPLIFIER MARKET BY REGION, USD BILLION, 2020-2029
FIGURE 9 PORTER’S FIVE FORCES MODEL
FIGURE 10 GLOBAL LOW NOISE AMPLIFIER MARKET BY TYPE, USD BILLION, 2021
FIGURE 11 GLOBAL LOW NOISE AMPLIFIER MARKET BY FREQUENCY, USD BILLION, 2021
FIGURE 12 GLOBAL LOW NOISE AMPLIFIER MARKET BY APPLICATION, USD BILLION, 2021
FIGURE 13 GLOBAL LOW NOISE AMPLIFIER MARKET BY REGION, USD BILLION, 2021
FIGURE 14 MARKET SHARE ANALYSIS
FIGURE 15 ANALOG DEVICES INC: COMPANY SNAPSHOT
FIGURE 16 INFINEON TECHNOLOGIES AG: COMPANY SNAPSHOT
FIGURE 17 TEXAS INSTRUMENTS INC.: COMPANY SNAPSHOT
FIGURE 18 NXP SEMICONDUCTORS INC COMPANY SNAPSHOT
FIGURE 19 MACOM TECHNOLOGY SOLUTIONS INC.: COMPANY SNAPSHOT
FIGURE 20 SKYWORKS SOLUTIONS INC: COMPANY SNAPSHOT
FIGURE 21 BROADCOM INC.: COMPANY SNAPSHOT
FIGURE 22 ON SEMICONDUCTOR CORPORATION: COMPANY SNAPSHOT
FIGURE 23 TOHIBA ELECTRONIC DEVICES & STORAGE CORPORATION: COMPANY SNAPSHOT
FIGURE 24 MICROCHIP TECHNOLOGY INC: COMPANY SNAPSHOT
DOWNLOAD FREE SAMPLE REPORT
License Type
SPEAK WITH OUR ANALYST
Want to know more about the report or any specific requirement?
WANT TO CUSTOMIZE THE REPORT?
Our Clients Speak
We asked them to research ‘ Equipment market’ all over the world, and their whole arrangement was helpful to us. thehealthanalytics.com insightful analysis and reports contributed to our current analysis and in creating a future strategy. Besides, the te
Yosuke Mitsui
Senior Associate Construction Equipment Sales & Marketing
We asked them to research ‘Equipment market’ all over the world, and their whole arrangement was helpful to us. thehealthanalytics.com insightful analysis and reports contributed to our current analysis and in creating a future strategy. Besides, the te


