

Base Year Value ()
x.x %
x.x %
CAGR ()
x.x %
x.x %
Forecast Year Value ()
x.x %
x.x %
Historical Data Period
Largest Region
Forecast Period
Nuclear Decommissioning Services Market By Service Type (Immediate Dismantling, Safe Enclosure, Entombment), By Reactor Type (Pressurized Water Reactor, Boiling Water Reactor) and Region, Global Trends and Forecast From 2022 To 2029
Instant access to hundreds of data points and trends
- Market estimates from 2014-2029
- Competitive analysis, industry segmentation, financial benchmarks
- Incorporates SWOT, Porter's Five Forces and risk management frameworks
- PDF report or online database with Word, Excel and PowerPoint export options
- 100% money back guarantee
Nuclear Decommissioning Services Market Overview
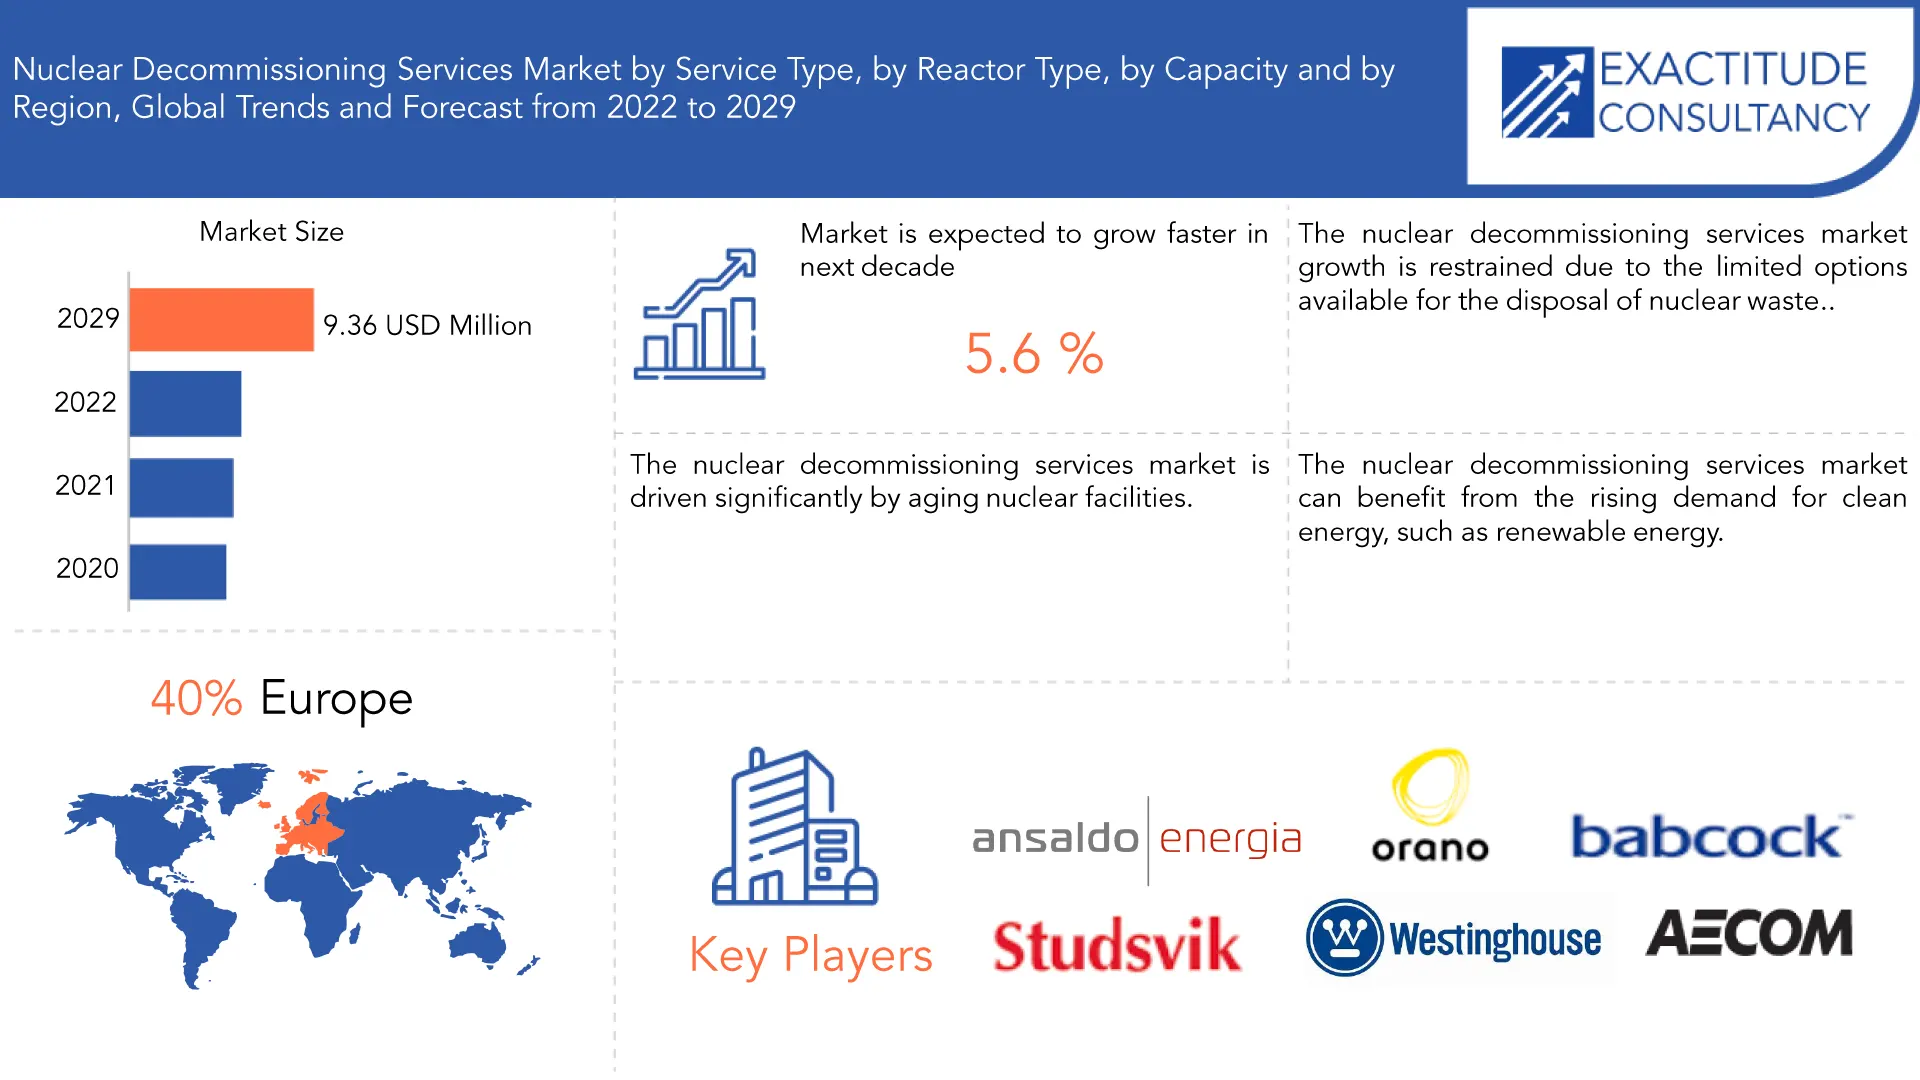
The nuclear decommissioning services market is expected to grow at 5.6 % CAGR from 2022 to 2029. It is expected to reach above USD 9.36 Billion by 2029 from USD 4.1 Billion in 2020.
Nuclear decommissioning services involve the safe dismantling and decontamination of nuclear installations that have completed their operational life. This process includes the removal of equipment, nuclear waste, and other materials while ensuring the secure disposal or storage of radioactive substances.
Expert companies that possess the necessary technology and equipment provide nuclear decommissioning services. These companies work with regulatory authorities to ensure that the decommissioning process adheres to safety and environmental standards.
| ATTRIBUTE | DETAILS |
| Study period | 2020-2029 |
| Base year | 2021 |
| Estimated year | 2022 |
| Forecasted year | 2022-2029 |
| Historical period | 2018-2020 |
| Unit | Value (USD Billion) |
| Segmentation | by Service Type, Reactor type, Capacity |
| By Service Type
|
|
| By Reactor type
|
|
| By Capacity
|
|
| By Region
|
|
The nuclear decommissioning services market has grown in recent years due to the rising number of nuclear power plants that have reached the end of their operational life. The market includes various services such as project management, engineering, decontamination, dismantling, waste management, and site restoration, to safely and securely manage nuclear waste.
The nuclear decommissioning services market is driven significantly by aging nuclear facilities. Many nuclear power plants were constructed decades ago and are now approaching the end of their operational lifespan. These facilities become increasingly inefficient, costly to maintain and upgrade, and present higher risks to public safety as they age. As a result, they must undergo safe decommissioning processes. Safe decommissioning of aging nuclear facilities is a challenging and time-consuming task, necessitating specialized knowledge, equipment, and expertise. Companies offering nuclear decommissioning services have the necessary capabilities to safely dismantle and decontaminate these facilities while ensuring appropriate disposal or storage of radioactive materials.
The nuclear decommissioning services market growth is restrained due to the limited options available for the disposal of nuclear waste. When a nuclear facility is decommissioned, it generates a large amount of radioactive waste that must be safely and securely disposed of in accordance with regulatory requirements. However, finding suitable disposal sites for this waste is a difficult task, and there are only limited options available. This limitation in disposal options can cause significant delays in the decommissioning process and result in higher costs. In some cases, the radioactive waste may have to be stored on-site in specialized containers until appropriate disposal options become available. This storage can be expensive and can also pose risks to public safety, highlighting the critical need for suitable waste disposal options.
The nuclear decommissioning services market can benefit from the rising demand for clean energy, such as renewable energy. Countries worldwide are striving to lower their carbon emissions, leading to a surge in demand for clean energy. Consequently, nuclear power usage is decreasing, and many nuclear facilities are approaching their end-of-life phase. The decommissioning of these facilities offers nuclear decommissioning services providers an opportunity to extend their services. These providers have the knowledge, equipment, and expertise to safely and efficiently dismantle and decontaminate nuclear facilities and ensure the proper disposal of radioactive waste.
In the early stages of the pandemic, many decommissioning projects were delayed or postponed due to supply chain disruptions and workforce shortages. The lockdowns and travel restrictions imposed in many countries affected the movement of personnel and equipment, causing further delays. However, as the pandemic continued, there was a shift towards remote work and virtual inspections, which helped to mitigate some of the delays. The pandemic also led to increased investment in decommissioning and waste management projects as governments sought to stimulate economic recovery.
[caption id="attachment_23750" align="aligncenter" width="1920"]
Frequently Asked Questions
• What is the worth of nuclear decommissioning services market?
The nuclear decommissioning services market size was USD 6.05 billion in the year 2021.
• What is the size of the Europe nuclear decommissioning services market industry?
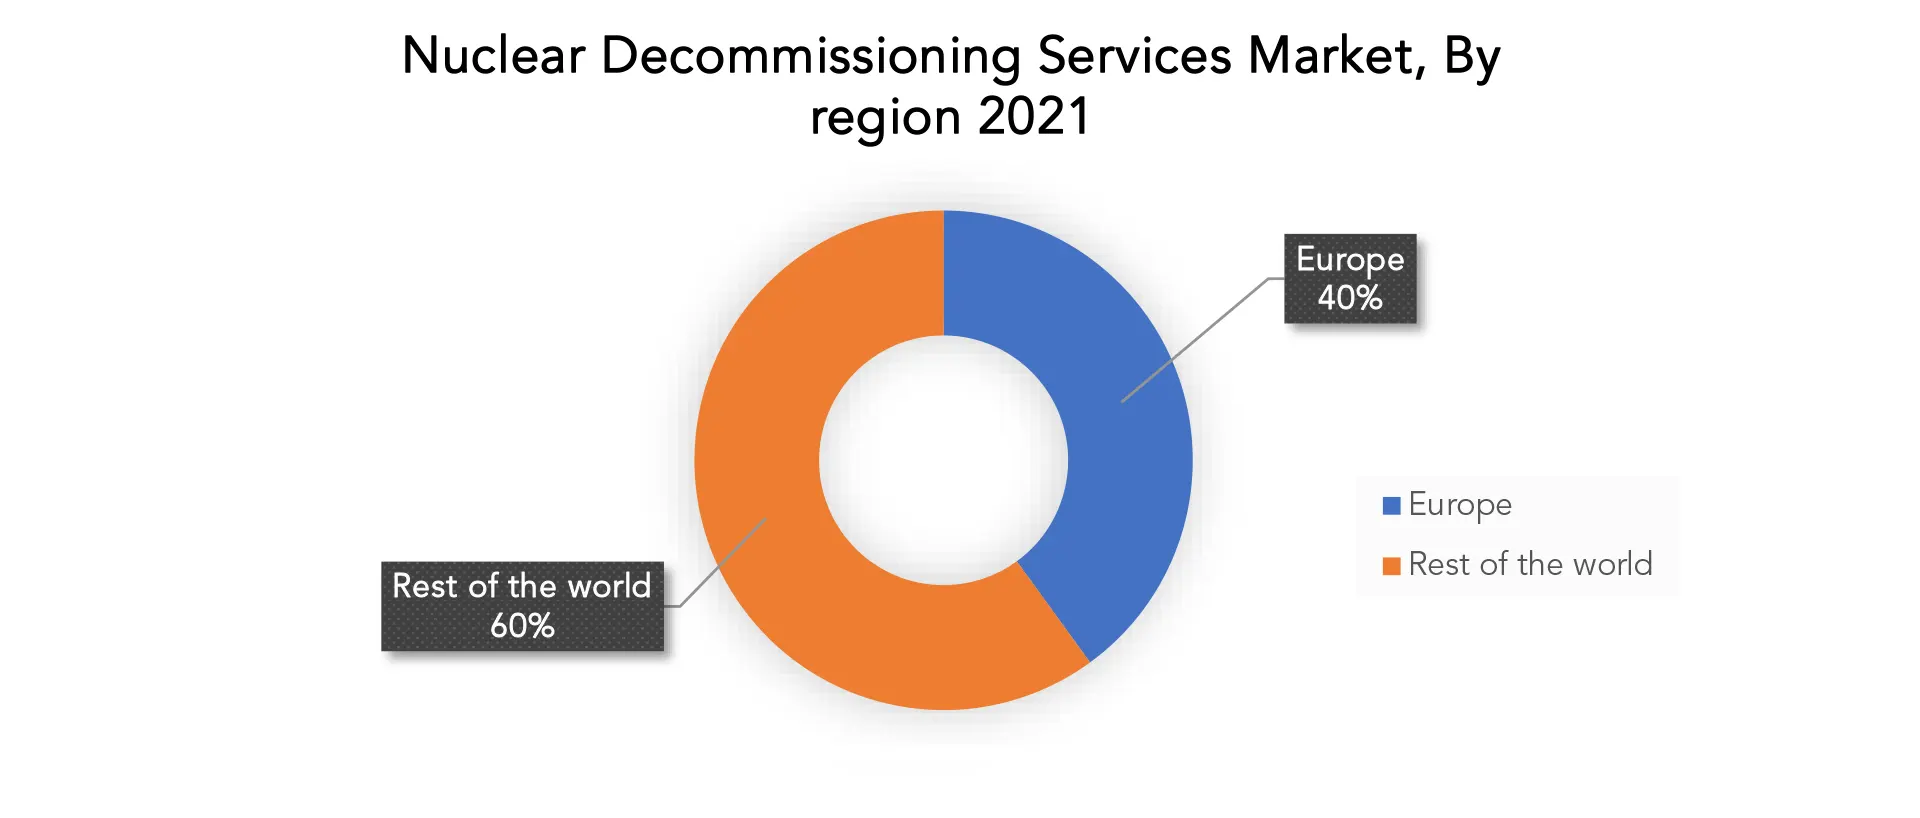
Europe held more than 40 % of the nuclear decommissioning services market revenue share in 2021 and will witness expansion in the forecast period.
• What are some of the market's driving forces?
The nuclear decommissioning services market is driven significantly by aging nuclear facilities.
• Which are the top companies to hold the market share in Nuclear Decommissioning Services Market?
The nuclear decommissioning services market key players include AECOM.; Orano USA.; Babcock International Group PLC; Studsvik AB; Westinghouse Electric Company LLC; Ansaldo Energia; Enercon.; EnergySolutions; The State Atomic Energy Corporation ROSATOM; KDC (Veolia); NUVIA.
• Which segment of the capacity accounts for highest share of Nuclear Decommissioning Services Market?
Based on capacity, the largest share for the nuclear decommissioning services market is above 1000 MW. Nuclear power plants with a capacity of above 1000 MW are considered to be large-scale power plants and require specialized expertise, equipment, and resources to safely decommission.
• Which is the largest regional market for Nuclear Decommissioning Services Market?
In Europe, the nuclear decommissioning market has experienced growth in recent years, driven by the aging nuclear facilities, increased demand for clean energy, and strict regulations on safe nuclear waste disposal.
Nuclear Decommissioning Services Market Segment Analysis
The nuclear decommissioning services market is segmented based service type, reactor type and capacity.In the market for nuclear decommissioning services, immediate dismantling has taken over as the key decommissioning method. This is to ensure that the site may be restored more quickly and there are fewer risks involved with keeping a decommissioned plant in place for a long time. Additionally, the increased emphasis on safety and environmental issues has fueled a need for fast dismantling.
In the global nuclear decommissioning services market, pressurized water reactors (PWRs), pressurized heavy water reactors, and boiling water reactors are included in the category of water-cooled reactors. Among these, pressurized water reactors held the largest market share in 2021.Industry operators highly favor PWRs due to their high level of stability and ease of operation. This segment is expected to grow at a strong rate during the forecast period, mainly due to its widespread use and installation.
[caption id="attachment_23756" align="aligncenter" width="1920"]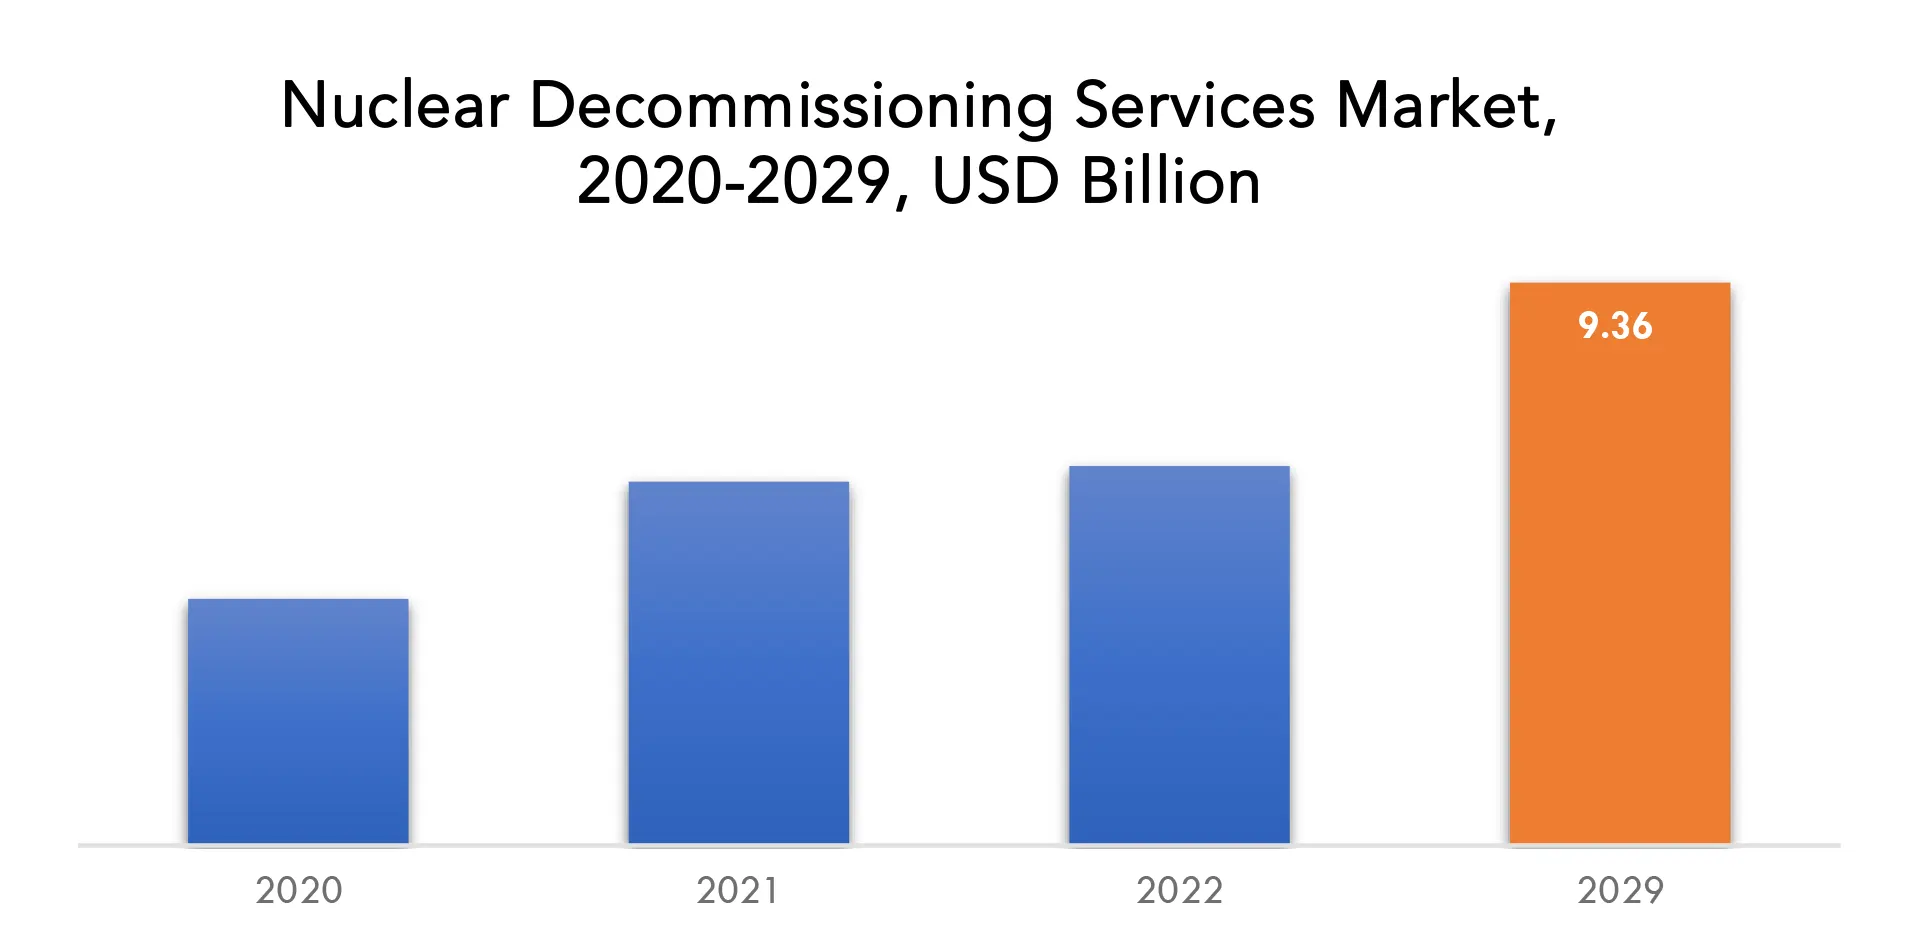
Based on capacity, the largest share for the nuclear decommissioning services market is above 1000 MW. Nuclear power plants with a capacity of above 1000 MW are considered to be large-scale power plants and require specialized expertise, equipment, and resources to safely decommission. Due to the high capacity, these power plants generate a large quantity of radioactive waste, which requires safe disposal.
Nuclear Decommissioning Services Market Players
The nuclear decommissioning services market key players include AECOM.; Orano USA.; Babcock International Group PLC; Studsvik AB; Westinghouse Electric Company LLC; Ansaldo Energia; Enercon.; EnergySolutions; The State Atomic Energy Corporation ROSATOM; KDC (Veolia); NUVIA February 28, 2023: Orano Implemented patented new method for dismantling and segmenting shutdown U.S. nuclear reactors. The new “Optimized Segmentation” process cuts up and removes everything inside the reactor vessel (RV) and then precisely repacks the low-level radioactive waste into the RV before cutting the massive component, minus the reactor vessel closure head (RVCH), and its shielded contents into three large pieces sized for transportation and disposal. June 29, 2021 : Studsvik signed strategic agreements for dismantling of nuclear power plants in Germany with a total order value of SEK 135 million. The agreements signed created the foundation for long-term business relations. The services was to be evenly distributed over a three-year period.Who Should Buy? Or Key stakeholders
- Nuclear Decommissioning Services Market Suppliers
- IT and Telecom Companies
- Hardware and software companies
- Research Organizations
- Investors
- Regulatory Authorities
- Others
Nuclear Decommissioning Services Market Regional Analysis
The nuclear decommissioning services market by region includes North America, Asia-Pacific (APAC), Europe, South America, and Middle East & Africa (MEA).
Nuclear Decommissioning Services Market | Exactitude Consultancy [/caption]
In Europe, the nuclear decommissioning market has experienced growth in recent years, driven by the aging nuclear facilities, increased demand for clean energy, and strict regulations on safe nuclear waste disposal. This market includes various services, such as project management, engineering, decontamination, dismantling, waste management, and site restoration. The immediate dismantling segment holds the largest market share in Europe, involving complete dismantling and decontamination of a nuclear facility soon after its shutdown. The PWR reactor type dominates the market due to its widespread use and ease of operation. However, limited nuclear waste disposal options are a significant restraint for the market, resulting in delays and increased costs. The COVID-19 pandemic had a moderate impact, causing supply chain disruptions and reduced demand.
In North America, there are currently 94 commercial nuclear reactors in operation across the United States and Canada. These reactors generate a significant amount of electricity, but they also have a finite operational life. As such, many of these reactors are reaching the end of their service life and will require decommissioning in the coming years. The North American nuclear decommissioning market is expected to grow in the coming years as more reactors reach the end of their operational life. The market is also being driven by increasing concerns about nuclear safety and the need to manage nuclear waste.
- North America: includes the US, Canada, Mexico
- Asia Pacific: includes China, Japan, South Korea, India, Australia, ASEAN and Rest of APAC
- Europe: includes UK, Germany, France, Italy, Spain, Russia, and Rest of Europe
- South America: includes Brazil, Argentina and Rest of South America
- Middle East & Africa: includes Turkey, UAE, Saudi Arabia, South Africa, and Rest of MEA
Key Market Segments: Nuclear Decommissioning Services Market
Nuclear Decommissioning Services Market By Service Type, 2020-2029, (USD Billion)- Immediate Dismantling
- Safe Enclosure
- Entombment
- Pressurized Water Reactor
- Boiling Water Reactor
- Gas-Cooled Reactor
- Below 100 MW
- 100 MW - 1000 MW
- Above 1000 MW
- North America
- Asia Pacific
- Europe
- South America
- Middle East And Africa
Exactitude Consultancy Services Key Objectives:
- Increasing sales and market share
- Developing new technology
- Improving profitability
- Entering new markets
- Enhancing brand reputation
Key Questions Answered: -
- What is the expected growth rate of the nuclear decommissioning services market over the next 7 years?
- Who are the major players in the nuclear decommissioning services market and what is their market share?
- What are the end-user industries driving demand for market and what is their outlook?
- What are the opportunities for growth in emerging markets such as Asia-Pacific, Middle East, and Africa?
- How is the economic environment affecting the nuclear decommissioning services market, including factors such as interest rates, inflation, and exchange rates?
- What is the expected impact of government policies and regulations on the nuclear decommissioning services market?
- What is the current and forecasted size and growth rate of the global nuclear decommissioning services market?
- What are the key drivers of growth in the nuclear decommissioning services market?
- Who are the major players in the market and what is their market share?
- What are the distribution channels and supply chain dynamics in the nuclear decommissioning services market?
- What are the technological advancements and innovations in the nuclear decommissioning services market and their impact on product development and growth?
- What are the regulatory considerations and their impact on the market?
- What are the challenges faced by players in the nuclear decommissioning services market and how are they addressing these challenges?
- What are the opportunities for growth and expansion in the nuclear decommissioning services market?
- What are the service offerings and specifications of leading players in the market?
TABLE OF CONTENTS
COMPANY PROFILES* (BUSINESS OVERVIEW, COMPANY SNAPSHOT, PRODUCTS OFFERED, RECENT DEVELOPMENTS)
*THE COMPANY LIST IS INDICATIVE
TABLE 1 GLOBAL NUCLEAR DECOMMISSIONING SERVICES MARKET BY SERVICE TYPE (USD BILLION), 2020-2029
TABLE 2 GLOBAL NUCLEAR DECOMMISSIONING SERVICES MARKET BY REACTOR TYPE (USD BILLION), 2020-2029
TABLE 3 GLOBAL NUCLEAR DECOMMISSIONING SERVICES MARKET BY CAPACITY (USD BILLION), 2020-2029
TABLE 4 GLOBAL NUCLEAR DECOMMISSIONING SERVICES MARKET BY REGION (USD BILLION), 2020-2029
TABLE 5 NORTH AMERICA NUCLEAR DECOMMISSIONING SERVICES MARKET BY SERVICE TYPE (USD BILLION), 2020-2029
TABLE 6 NORTH AMERICA NUCLEAR DECOMMISSIONING SERVICES MARKET BY REACTOR TYPE (USD BILLION), 2020-2029
TABLE 7 NORTH AMERICA NUCLEAR DECOMMISSIONING SERVICES MARKET BY CAPACITY (USD BILLION), 2020-2029
TABLE 8 NORTH AMERICA NUCLEAR DECOMMISSIONING SERVICES MARKET BY COUNTRY (USD BILLION), 2020-2029
TABLE 9 US NUCLEAR DECOMMISSIONING SERVICES MARKET BY SERVICE TYPE (USD BILLION), 2020-2029
TABLE 10 US NUCLEAR DECOMMISSIONING SERVICES MARKET BY REACTOR TYPE (USD BILLION), 2020-2029
TABLE 11 US NUCLEAR DECOMMISSIONING SERVICES MARKET BY CAPACITY (USD BILLION), 2020-2029
TABLE 12 CANADA NUCLEAR DECOMMISSIONING SERVICES MARKET BY SERVICE TYPE (BILLION), 2020-2029
TABLE 13 CANADA NUCLEAR DECOMMISSIONING SERVICES MARKET BY REACTOR TYPE (USD BILLION), 2020-2029
TABLE 14 CANADA NUCLEAR DECOMMISSIONING SERVICES MARKET BY CAPACITY (USD BILLION), 2020-2029
TABLE 15 MEXICO NUCLEAR DECOMMISSIONING SERVICES MARKET BY SERVICE TYPE (USD BILLION), 2020-2029
TABLE 16 MEXICO NUCLEAR DECOMMISSIONING SERVICES MARKET BY REACTOR TYPE (USD BILLION), 2020-2029
TABLE 17 MEXICO NUCLEAR DECOMMISSIONING SERVICES MARKET BY CAPACITY (USD BILLION), 2020-2029
TABLE 18 SOUTH AMERICA NUCLEAR DECOMMISSIONING SERVICES MARKET BY SERVICE TYPE (USD BILLION), 2020-2029
TABLE 19 SOUTH AMERICA NUCLEAR DECOMMISSIONING SERVICES MARKET BY REACTOR TYPE (USD BILLION), 2020-2029
TABLE 20 SOUTH AMERICA NUCLEAR DECOMMISSIONING SERVICES MARKET BY CAPACITY (USD BILLION), 2020-2029
TABLE 21 SOUTH AMERICA NUCLEAR DECOMMISSIONING SERVICES MARKET BY COUNTRY (USD BILLION), 2020-2029
TABLE 22 BRAZIL NUCLEAR DECOMMISSIONING SERVICES MARKET BY SERVICE TYPE (USD BILLION), 2020-2029
TABLE 23 BRAZIL NUCLEAR DECOMMISSIONING SERVICES MARKET BY REACTOR TYPE (USD BILLION), 2020-2029
TABLE 24 BRAZIL NUCLEAR DECOMMISSIONING SERVICES MARKET BY CAPACITY (USD BILLION), 2020-2029
TABLE 25 ARGENTINA NUCLEAR DECOMMISSIONING SERVICES MARKET BY SERVICE TYPE (USD BILLION), 2020-2029
TABLE 26 ARGENTINA NUCLEAR DECOMMISSIONING SERVICES MARKET BY REACTOR TYPE (USD BILLION), 2020- 2029
TABLE 27 ARGENTINA NUCLEAR DECOMMISSIONING SERVICES MARKET BY CAPACITY (USD BILLION), 2020-2029
TABLE 28 COLOMBIA NUCLEAR DECOMMISSIONING SERVICES MARKET BY SERVICE TYPE (USD BILLION), 2020-2029
TABLE 29 COLOMBIA NUCLEAR DECOMMISSIONING SERVICES MARKET BY REACTOR TYPE (USD BILLION), 2020-2029
TABLE 30 COLOMBIA NUCLEAR DECOMMISSIONING SERVICES MARKET BY CAPACITY (USD BILLION), 2020-2029
TABLE 31 REST OF SOUTH AMERICA NUCLEAR DECOMMISSIONING SERVICES MARKET BY SERVICE TYPE (USD BILLION), 2020-2029
TABLE 32 REST OF SOUTH AMERICA NUCLEAR DECOMMISSIONING SERVICES MARKET BY REACTOR TYPE (USD BILLION), 2020-2029
TABLE 33 REST OF SOUTH AMERICA NUCLEAR DECOMMISSIONING SERVICES MARKET BY CAPACITY (USD BILLION), 2020-2029
TABLE 34 ASIA-PACIFIC NUCLEAR DECOMMISSIONING SERVICES MARKET BY SERVICE TYPE (USD BILLION), 2020-2029
TABLE 35 ASIA-PACIFIC NUCLEAR DECOMMISSIONING SERVICES MARKET BY REACTOR TYPE (USD BILLION), 2020-2029
TABLE 36 ASIA-PACIFIC NUCLEAR DECOMMISSIONING SERVICES MARKET BY CAPACITY (USD BILLION), 2020-2029
TABLE 37 ASIA-PACIFIC NUCLEAR DECOMMISSIONING SERVICES MARKET BY COUNTRY (USD BILLION), 2020-2029
TABLE 38 INDIA NUCLEAR DECOMMISSIONING SERVICES MARKET BY SERVICE TYPE (USD BILLION), 2020-2029
TABLE 39 INDIA NUCLEAR DECOMMISSIONING SERVICES MARKET BY REACTOR TYPE (USD BILLION), 2020-2029
TABLE 40 INDIA NUCLEAR DECOMMISSIONING SERVICES MARKET BY CAPACITY (USD BILLION), 2020-2029
TABLE 41 CHINA NUCLEAR DECOMMISSIONING SERVICES MARKET BY SERVICE TYPE (USD BILLION), 2020-2029
TABLE 42 CHINA NUCLEAR DECOMMISSIONING SERVICES MARKET BY REACTOR TYPE (USD BILLION), 2020-2029
TABLE 43 CHINA NUCLEAR DECOMMISSIONING SERVICES MARKET BY CAPACITY (USD BILLION), 2020-2029
TABLE 44 JAPAN NUCLEAR DECOMMISSIONING SERVICES MARKET BY SERVICE TYPE (USD BILLION), 2020-2029
TABLE 45 JAPAN NUCLEAR DECOMMISSIONING SERVICES MARKET BY REACTOR TYPE (USD BILLION), 2020-2029
TABLE 46 JAPAN NUCLEAR DECOMMISSIONING SERVICES MARKET BY CAPACITY (USD BILLION), 2020-2029
TABLE 47 SOUTH KOREA NUCLEAR DECOMMISSIONING SERVICES MARKET BY SERVICE TYPE (USD BILLION), 2020-2029
TABLE 48 SOUTH KOREA NUCLEAR DECOMMISSIONING SERVICES MARKET BY REACTOR TYPE (USD BILLION), 2020-2029
TABLE 49 SOUTH KOREA NUCLEAR DECOMMISSIONING SERVICES MARKET BY CAPACITY (USD BILLION), 2020-2029
TABLE 50 AUSTRALIA NUCLEAR DECOMMISSIONING SERVICES MARKET BY SERVICE TYPE (USD BILLION), 2020-2029
TABLE 51 AUSTRALIA NUCLEAR DECOMMISSIONING SERVICES MARKET BY REACTOR TYPE (USD BILLION), 2020-2029
TABLE 52 AUSTRALIA NUCLEAR DECOMMISSIONING SERVICES MARKET BY CAPACITY (USD BILLION), 2020-2029
TABLE 53 SOUTH EAST ASIA NUCLEAR DECOMMISSIONING SERVICES MARKET BY SERVICE TYPE (USD BILLION), 2020-2029
TABLE 54 SOUTH EAST ASIA NUCLEAR DECOMMISSIONING SERVICES MARKET BY REACTOR TYPE (USD BILLION), 2020-2029
TABLE 55 SOUTH EAST ASIA NUCLEAR DECOMMISSIONING SERVICES MARKET BY CAPACITY (USD BILLION), 2020-2029
TABLE 56 REST OF ASIA PACIFIC NUCLEAR DECOMMISSIONING SERVICES MARKET BY SERVICE TYPE (USD BILLION), 2020-2029
TABLE 57 REST OF ASIA PACIFIC NUCLEAR DECOMMISSIONING SERVICES MARKET BY REACTOR TYPE (USD BILLION), 2020-2029
TABLE 58 REST OF ASIA PACIFIC NUCLEAR DECOMMISSIONING SERVICES MARKET BY CAPACITY (USD BILLION), 2020-2029
TABLE 59 EUROPE NUCLEAR DECOMMISSIONING SERVICES MARKET BY SERVICE TYPE (USD BILLION), 2020-2029
TABLE 60 EUROPE NUCLEAR DECOMMISSIONING SERVICES MARKET BY REACTOR TYPE (USD BILLION), 2020-2029
TABLE 61 EUROPE NUCLEAR DECOMMISSIONING SERVICES MARKET BY CAPACITY (USD BILLION), 2020-2029
TABLE 62 EUROPE NUCLEAR DECOMMISSIONING SERVICES MARKET BY COUNTRY (USD BILLION), 2020-2029
TABLE 63 GERMANY NUCLEAR DECOMMISSIONING SERVICES MARKET BY SERVICE TYPE (USD BILLION), 2020-2029
TABLE 64 GERMANY NUCLEAR DECOMMISSIONING SERVICES MARKET BY REACTOR TYPE (USD BILLION), 2020-2029
TABLE 65 GERMANY NUCLEAR DECOMMISSIONING SERVICES MARKET BY CAPACITY (USD BILLION), 2020-2029
TABLE 66 UK NUCLEAR DECOMMISSIONING SERVICES MARKET BY SERVICE TYPE (USD BILLION), 2020-2029
TABLE 67 UK NUCLEAR DECOMMISSIONING SERVICES MARKET BY REACTOR TYPE (USD BILLION), 2020-2029
TABLE 68 UK NUCLEAR DECOMMISSIONING SERVICES MARKET BY CAPACITY (USD BILLION), 2020-2029
TABLE 69 FRANCE NUCLEAR DECOMMISSIONING SERVICES MARKET BY SERVICE TYPE (USD BILLION), 2020-2029
TABLE 70 FRANCE NUCLEAR DECOMMISSIONING SERVICES MARKET BY REACTOR TYPE (USD BILLION), 2020-2029
TABLE 71 FRANCE NUCLEAR DECOMMISSIONING SERVICES MARKET BY CAPACITY (USD BILLION), 2020-2029
TABLE 72 ITALY NUCLEAR DECOMMISSIONING SERVICES MARKET BY SERVICE TYPE (USD BILLION), 2020-2029
TABLE 73 ITALY NUCLEAR DECOMMISSIONING SERVICES MARKET BY REACTOR TYPE (USD BILLION), 2020-2029
TABLE 74 ITALY NUCLEAR DECOMMISSIONING SERVICES MARKET BY CAPACITY (USD BILLION), 2020-2029
TABLE 75 SPAIN NUCLEAR DECOMMISSIONING SERVICES MARKET BY SERVICE TYPE (USD BILLION), 2020-2029
TABLE 76 SPAIN NUCLEAR DECOMMISSIONING SERVICES MARKET BY REACTOR TYPE (USD BILLION), 2020-2029
TABLE 77 SPAIN NUCLEAR DECOMMISSIONING SERVICES MARKET BY CAPACITY (USD BILLION), 2020-2029
TABLE 78 RUSSIA NUCLEAR DECOMMISSIONING SERVICES MARKET BY SERVICE TYPE (USD BILLION), 2020-2029
TABLE 79 RUSSIA NUCLEAR DECOMMISSIONING SERVICES MARKET BY REACTOR TYPE (USD BILLION), 2020-2029
TABLE 80 RUSSIA NUCLEAR DECOMMISSIONING SERVICES MARKET BY CAPACITY (USD BILLION), 2020-2029
TABLE 81 REST OF EUROPE NUCLEAR DECOMMISSIONING SERVICES MARKET BY SERVICE TYPE (USD BILLION), 2020-2029
TABLE 82 REST OF EUROPE NUCLEAR DECOMMISSIONING SERVICES MARKET BY REACTOR TYPE (USD BILLION), 2020-2029
TABLE 83 REST OF EUROPE NUCLEAR DECOMMISSIONING SERVICES MARKET BY CAPACITY (USD BILLION), 2020-2029
TABLE 84 MIDDLE EAST AND AFRICA NUCLEAR DECOMMISSIONING SERVICES MARKET BY SERVICE TYPE (USD BILLION), 2020-2029
TABLE 85 MIDDLE EAST AND AFRICA NUCLEAR DECOMMISSIONING SERVICES MARKET BY REACTOR TYPE (USD BILLION), 2020-2029
TABLE 86 MIDDLE EAST AND AFRICA NUCLEAR DECOMMISSIONING SERVICES MARKET BY CAPACITY (USD BILLION), 2020-2029
TABLE 87 MIDDLE EAST AND AFRICA NUCLEAR DECOMMISSIONING SERVICES MARKET BY COUNTRY (USD BILLION), 2020-2029
TABLE 88 UAE NUCLEAR DECOMMISSIONING SERVICES MARKET BY SERVICE TYPE (USD BILLION), 2020-2029
TABLE 89 UAE NUCLEAR DECOMMISSIONING SERVICES MARKET BY REACTOR TYPE (USD BILLION), 2020-2029
TABLE 90 UAE NUCLEAR DECOMMISSIONING SERVICES MARKET BY CAPACITY (USD BILLION), 2020-2029
TABLE 91 SAUDI ARABIA NUCLEAR DECOMMISSIONING SERVICES MARKET BY SERVICE TYPE (USD BILLION), 2020-2029
TABLE 92 SAUDI ARABIA NUCLEAR DECOMMISSIONING SERVICES MARKET BY REACTOR TYPE (USD BILLION), 2020-2029
TABLE 93 SAUDI ARABIA NUCLEAR DECOMMISSIONING SERVICES MARKET BY CAPACITY (USD BILLION), 2020-2029
TABLE 94 SOUTH AFRICA NUCLEAR DECOMMISSIONING SERVICES MARKET BY SERVICE TYPE (USD BILLION), 2020-2029
TABLE 95 SOUTH AFRICA NUCLEAR DECOMMISSIONING SERVICES MARKET BY REACTOR TYPE (USD BILLION), 2020-2029
TABLE 96 SOUTH AFRICA NUCLEAR DECOMMISSIONING SERVICES MARKET BY CAPACITY (USD BILLION), 2020-2029
TABLE 97 REST OF MIDDLE EAST AND AFRICA NUCLEAR DECOMMISSIONING SERVICES MARKET BY SERVICE TYPE (USD BILLION), 2020-2029
TABLE 98 REST OF MIDDLE EAST AND AFRICA NUCLEAR DECOMMISSIONING SERVICES MARKET BY REACTOR TYPE (USD BILLION), 2020-2029
TABLE 99 REST OF MIDDLE EAST AND AFRICA NUCLEAR DECOMMISSIONING SERVICES MARKET BY CAPACITY (USD BILLION), 2020-2029
LIST OF FIGURES
FIGURE 1 MARKET DYNAMICS
FIGURE 2 MARKET SEGMENTATION
FIGURE 3 REPORT TIMELINES: YEARS CONSIDERED
FIGURE 4 DATA TRIANGULATION
FIGURE 5 BOTTOM-UP APPROACH
FIGURE 6 TOP-DOWN APPROACH
FIGURE 7 RESEARCH FLOW
FIGURE 8 GLOBAL NUCLEAR DECOMMISSIONING SERVICES BY SERVICE TYPE, USD BILLION, 2020-2029
FIGURE 9 GLOBAL NUCLEAR DECOMMISSIONING SERVICES BY REACTOR TYPE, USD BILLION, 2020-2029
FIGURE 10 GLOBAL NUCLEAR DECOMMISSIONING SERVICES BY CAPACITY, USD BILLION, 2020-2029
FIGURE 11 GLOBAL NUCLEAR DECOMMISSIONING SERVICES BY REGION, USD BILLION, 2020-2029
FIGURE 12 PORTER’S FIVE FORCES MODEL
FIGURE 13 GLOBAL NUCLEAR DECOMMISSIONING SERVICES MARKET BY REGION , USD BILLION, 2021
FIGURE 14 GLOBAL NUCLEAR DECOMMISSIONING SERVICES MARKET BY REACTOR TYPE, USD BILLION, 2021
FIGURE 15 GLOBAL NUCLEAR DECOMMISSIONING SERVICES MARKET BY SERVICE TYPE, USD BILLION, 2021
FIGURE 16 GLOBAL NUCLEAR DECOMMISSIONING SERVICES MARKET BY CAPACITY , USD BILLION, 2021
FIGURE 17 MARKET SHARE ANALYSIS
FIGURE 18 AECOM: COMPANY SNAPSHOT
FIGURE 19 ORANO USA: COMPANY SNAPSHOT
FIGURE 20 BABCOCK INTERNATIONAL GROUP PLC: COMPANY SNAPSHOT
FIGURE 21 STUDSVIK AB: COMPANY SNAPSHOT
FIGURE 22 WESTINGHOUSE ELECTRIC COMPANY LLC: COMPANY SNAPSHOT
FIGURE 23 ANSALDO ENERGIA: COMPANY SNAPSHOT
FIGURE 24 ENERCON: COMPANY SNAPSHOT
FIGURE 25 ENERGYSOLUTIONS: COMPANY SNAPSHOT
FIGURE 26 THE STATE ATOMIC ENERGY CORPORATION ROSATOM: COMPANY SNAPSHOT
FIGURE 27 KDC (VEOLIA): COMPANY SNAPSHOT
FIGURE 28 NUVIA: COMPANY SNAPSHOT
- INTRODUCTION
- MARKET DEFINITION
- MARKET SEGMENTATION
- RESEARCH TIMELINES
- ASSUMPTIONS AND LIMITATIONS
- RESEARCH METHODOLOGY
- DATA MINING
- SECONDARY RESEARCH
- PRIMARY RESEARCH
- SUBJECT-MATTER EXPERTS’ ADVICE
- QUALITY CHECKS
- FINAL REVIEW
- DATA TRIANGULATION
- BOTTOM-UP APPROACH
- TOP-DOWN APPROACH
- RESEARCH FLOW
- DATA SOURCES
- DATA MINING
- EXECUTIVE SUMMARY
- MARKET OVERVIEW
- GLOBAL NUCLEAR DECOMMISSIONING SERVICES MARKET OUTLOOK
- MARKET DRIVERS
- MARKET RESTRAINTS
- MARKET OPPORTUNITIES
- IMPACT OF COVID-19 ON NUCLEAR DECOMMISSIONING SERVICES MARKET
- PORTER’S FIVE FORCES MODEL
- THREAT FROM NEW ENTRANTS
- THREAT FROM SUBSTITUTES
- BARGAINING POWER OF SUPPLIERS
- BARGAINING POWER OF CUSTOMERS
- DEGREE OF COMPETITION
- INDUSTRY VALUE CHAIN ANALYSIS
- GLOBAL NUCLEAR DECOMMISSIONING SERVICES MARKET OUTLOOK
- GLOBAL NUCLEAR DECOMMISSIONING SERVICES MARKET BY SERVICE TYPE, (USD BILLION), 2020-2029
- IMMEDIATE DISMANTLING
- SAFE ENCLOSURE
- ENTOMBMENT
- GLOBAL NUCLEAR DECOMMISSIONING SERVICES MARKET BY REACTOR TYPE, (USD BILLION) , 2020-2029
- PRESSURIZED WATER REACTOR
- BOILING WATER REACTOR
- GAS-COOLED REACTOR
- GLOBAL NUCLEAR DECOMMISSIONING SERVICES MARKET BY CAPACITY, (USD BILLION) , 2020-2029
- BELOW 100 MW
- 100 MW - 1000 MW
- ABOVE 1000 MW
- GLOBAL NUCLEAR DECOMMISSIONING SERVICES MARKET BY REGION, (USD BILLION) , 2020-2029
- NORTH AMERICA
- US
- CANADA
- MEXICO
- SOUTH AMERICA
- BRAZIL
- ARGENTINA
- COLOMBIA
- REST OF SOUTH AMERICA
- EUROPE
- GERMANY
- UK
- FRANCE
- ITALY
- SPAIN
- RUSSIA
- REST OF EUROPE
- ASIA PACIFIC
- INDIA
- CHINA
- JAPAN
- SOUTH KOREA
- AUSTRALIA
- SOUTH-EAST ASIA
- REST OF ASIA PACIFIC
- MIDDLE EAST AND AFRICA
- UAE
- SAUDI ARABIA
- SOUTH AFRICA
- REST OF MIDDLE EAST AND AFRICA
- NORTH AMERICA
COMPANY PROFILES* (BUSINESS OVERVIEW, COMPANY SNAPSHOT, PRODUCTS OFFERED, RECENT DEVELOPMENTS)
- ORANO USA.
- BABCOCK INTERNATIONAL GROUP PLC
- STUDSVIK AB
- WESTINGHOUSE ELECTRIC COMPANY LLC
- ANSALDO ENERGIA
- ENERGYSOLUTIONS
- THE STATE ATOMIC ENERGY CORPORATION ROSATOM
- KDC (VEOLIA)
- NUVIA
*THE COMPANY LIST IS INDICATIVE
LIST OF TABLES
TABLE 1 GLOBAL NUCLEAR DECOMMISSIONING SERVICES MARKET BY SERVICE TYPE (USD BILLION), 2020-2029
TABLE 2 GLOBAL NUCLEAR DECOMMISSIONING SERVICES MARKET BY REACTOR TYPE (USD BILLION), 2020-2029
TABLE 3 GLOBAL NUCLEAR DECOMMISSIONING SERVICES MARKET BY CAPACITY (USD BILLION), 2020-2029
TABLE 4 GLOBAL NUCLEAR DECOMMISSIONING SERVICES MARKET BY REGION (USD BILLION), 2020-2029
TABLE 5 NORTH AMERICA NUCLEAR DECOMMISSIONING SERVICES MARKET BY SERVICE TYPE (USD BILLION), 2020-2029
TABLE 6 NORTH AMERICA NUCLEAR DECOMMISSIONING SERVICES MARKET BY REACTOR TYPE (USD BILLION), 2020-2029
TABLE 7 NORTH AMERICA NUCLEAR DECOMMISSIONING SERVICES MARKET BY CAPACITY (USD BILLION), 2020-2029
TABLE 8 NORTH AMERICA NUCLEAR DECOMMISSIONING SERVICES MARKET BY COUNTRY (USD BILLION), 2020-2029
TABLE 9 US NUCLEAR DECOMMISSIONING SERVICES MARKET BY SERVICE TYPE (USD BILLION), 2020-2029
TABLE 10 US NUCLEAR DECOMMISSIONING SERVICES MARKET BY REACTOR TYPE (USD BILLION), 2020-2029
TABLE 11 US NUCLEAR DECOMMISSIONING SERVICES MARKET BY CAPACITY (USD BILLION), 2020-2029
TABLE 12 CANADA NUCLEAR DECOMMISSIONING SERVICES MARKET BY SERVICE TYPE (BILLION), 2020-2029
TABLE 13 CANADA NUCLEAR DECOMMISSIONING SERVICES MARKET BY REACTOR TYPE (USD BILLION), 2020-2029
TABLE 14 CANADA NUCLEAR DECOMMISSIONING SERVICES MARKET BY CAPACITY (USD BILLION), 2020-2029
TABLE 15 MEXICO NUCLEAR DECOMMISSIONING SERVICES MARKET BY SERVICE TYPE (USD BILLION), 2020-2029
TABLE 16 MEXICO NUCLEAR DECOMMISSIONING SERVICES MARKET BY REACTOR TYPE (USD BILLION), 2020-2029
TABLE 17 MEXICO NUCLEAR DECOMMISSIONING SERVICES MARKET BY CAPACITY (USD BILLION), 2020-2029
TABLE 18 SOUTH AMERICA NUCLEAR DECOMMISSIONING SERVICES MARKET BY SERVICE TYPE (USD BILLION), 2020-2029
TABLE 19 SOUTH AMERICA NUCLEAR DECOMMISSIONING SERVICES MARKET BY REACTOR TYPE (USD BILLION), 2020-2029
TABLE 20 SOUTH AMERICA NUCLEAR DECOMMISSIONING SERVICES MARKET BY CAPACITY (USD BILLION), 2020-2029
TABLE 21 SOUTH AMERICA NUCLEAR DECOMMISSIONING SERVICES MARKET BY COUNTRY (USD BILLION), 2020-2029
TABLE 22 BRAZIL NUCLEAR DECOMMISSIONING SERVICES MARKET BY SERVICE TYPE (USD BILLION), 2020-2029
TABLE 23 BRAZIL NUCLEAR DECOMMISSIONING SERVICES MARKET BY REACTOR TYPE (USD BILLION), 2020-2029
TABLE 24 BRAZIL NUCLEAR DECOMMISSIONING SERVICES MARKET BY CAPACITY (USD BILLION), 2020-2029
TABLE 25 ARGENTINA NUCLEAR DECOMMISSIONING SERVICES MARKET BY SERVICE TYPE (USD BILLION), 2020-2029
TABLE 26 ARGENTINA NUCLEAR DECOMMISSIONING SERVICES MARKET BY REACTOR TYPE (USD BILLION), 2020- 2029
TABLE 27 ARGENTINA NUCLEAR DECOMMISSIONING SERVICES MARKET BY CAPACITY (USD BILLION), 2020-2029
TABLE 28 COLOMBIA NUCLEAR DECOMMISSIONING SERVICES MARKET BY SERVICE TYPE (USD BILLION), 2020-2029
TABLE 29 COLOMBIA NUCLEAR DECOMMISSIONING SERVICES MARKET BY REACTOR TYPE (USD BILLION), 2020-2029
TABLE 30 COLOMBIA NUCLEAR DECOMMISSIONING SERVICES MARKET BY CAPACITY (USD BILLION), 2020-2029
TABLE 31 REST OF SOUTH AMERICA NUCLEAR DECOMMISSIONING SERVICES MARKET BY SERVICE TYPE (USD BILLION), 2020-2029
TABLE 32 REST OF SOUTH AMERICA NUCLEAR DECOMMISSIONING SERVICES MARKET BY REACTOR TYPE (USD BILLION), 2020-2029
TABLE 33 REST OF SOUTH AMERICA NUCLEAR DECOMMISSIONING SERVICES MARKET BY CAPACITY (USD BILLION), 2020-2029
TABLE 34 ASIA-PACIFIC NUCLEAR DECOMMISSIONING SERVICES MARKET BY SERVICE TYPE (USD BILLION), 2020-2029
TABLE 35 ASIA-PACIFIC NUCLEAR DECOMMISSIONING SERVICES MARKET BY REACTOR TYPE (USD BILLION), 2020-2029
TABLE 36 ASIA-PACIFIC NUCLEAR DECOMMISSIONING SERVICES MARKET BY CAPACITY (USD BILLION), 2020-2029
TABLE 37 ASIA-PACIFIC NUCLEAR DECOMMISSIONING SERVICES MARKET BY COUNTRY (USD BILLION), 2020-2029
TABLE 38 INDIA NUCLEAR DECOMMISSIONING SERVICES MARKET BY SERVICE TYPE (USD BILLION), 2020-2029
TABLE 39 INDIA NUCLEAR DECOMMISSIONING SERVICES MARKET BY REACTOR TYPE (USD BILLION), 2020-2029
TABLE 40 INDIA NUCLEAR DECOMMISSIONING SERVICES MARKET BY CAPACITY (USD BILLION), 2020-2029
TABLE 41 CHINA NUCLEAR DECOMMISSIONING SERVICES MARKET BY SERVICE TYPE (USD BILLION), 2020-2029
TABLE 42 CHINA NUCLEAR DECOMMISSIONING SERVICES MARKET BY REACTOR TYPE (USD BILLION), 2020-2029
TABLE 43 CHINA NUCLEAR DECOMMISSIONING SERVICES MARKET BY CAPACITY (USD BILLION), 2020-2029
TABLE 44 JAPAN NUCLEAR DECOMMISSIONING SERVICES MARKET BY SERVICE TYPE (USD BILLION), 2020-2029
TABLE 45 JAPAN NUCLEAR DECOMMISSIONING SERVICES MARKET BY REACTOR TYPE (USD BILLION), 2020-2029
TABLE 46 JAPAN NUCLEAR DECOMMISSIONING SERVICES MARKET BY CAPACITY (USD BILLION), 2020-2029
TABLE 47 SOUTH KOREA NUCLEAR DECOMMISSIONING SERVICES MARKET BY SERVICE TYPE (USD BILLION), 2020-2029
TABLE 48 SOUTH KOREA NUCLEAR DECOMMISSIONING SERVICES MARKET BY REACTOR TYPE (USD BILLION), 2020-2029
TABLE 49 SOUTH KOREA NUCLEAR DECOMMISSIONING SERVICES MARKET BY CAPACITY (USD BILLION), 2020-2029
TABLE 50 AUSTRALIA NUCLEAR DECOMMISSIONING SERVICES MARKET BY SERVICE TYPE (USD BILLION), 2020-2029
TABLE 51 AUSTRALIA NUCLEAR DECOMMISSIONING SERVICES MARKET BY REACTOR TYPE (USD BILLION), 2020-2029
TABLE 52 AUSTRALIA NUCLEAR DECOMMISSIONING SERVICES MARKET BY CAPACITY (USD BILLION), 2020-2029
TABLE 53 SOUTH EAST ASIA NUCLEAR DECOMMISSIONING SERVICES MARKET BY SERVICE TYPE (USD BILLION), 2020-2029
TABLE 54 SOUTH EAST ASIA NUCLEAR DECOMMISSIONING SERVICES MARKET BY REACTOR TYPE (USD BILLION), 2020-2029
TABLE 55 SOUTH EAST ASIA NUCLEAR DECOMMISSIONING SERVICES MARKET BY CAPACITY (USD BILLION), 2020-2029
TABLE 56 REST OF ASIA PACIFIC NUCLEAR DECOMMISSIONING SERVICES MARKET BY SERVICE TYPE (USD BILLION), 2020-2029
TABLE 57 REST OF ASIA PACIFIC NUCLEAR DECOMMISSIONING SERVICES MARKET BY REACTOR TYPE (USD BILLION), 2020-2029
TABLE 58 REST OF ASIA PACIFIC NUCLEAR DECOMMISSIONING SERVICES MARKET BY CAPACITY (USD BILLION), 2020-2029
TABLE 59 EUROPE NUCLEAR DECOMMISSIONING SERVICES MARKET BY SERVICE TYPE (USD BILLION), 2020-2029
TABLE 60 EUROPE NUCLEAR DECOMMISSIONING SERVICES MARKET BY REACTOR TYPE (USD BILLION), 2020-2029
TABLE 61 EUROPE NUCLEAR DECOMMISSIONING SERVICES MARKET BY CAPACITY (USD BILLION), 2020-2029
TABLE 62 EUROPE NUCLEAR DECOMMISSIONING SERVICES MARKET BY COUNTRY (USD BILLION), 2020-2029
TABLE 63 GERMANY NUCLEAR DECOMMISSIONING SERVICES MARKET BY SERVICE TYPE (USD BILLION), 2020-2029
TABLE 64 GERMANY NUCLEAR DECOMMISSIONING SERVICES MARKET BY REACTOR TYPE (USD BILLION), 2020-2029
TABLE 65 GERMANY NUCLEAR DECOMMISSIONING SERVICES MARKET BY CAPACITY (USD BILLION), 2020-2029
TABLE 66 UK NUCLEAR DECOMMISSIONING SERVICES MARKET BY SERVICE TYPE (USD BILLION), 2020-2029
TABLE 67 UK NUCLEAR DECOMMISSIONING SERVICES MARKET BY REACTOR TYPE (USD BILLION), 2020-2029
TABLE 68 UK NUCLEAR DECOMMISSIONING SERVICES MARKET BY CAPACITY (USD BILLION), 2020-2029
TABLE 69 FRANCE NUCLEAR DECOMMISSIONING SERVICES MARKET BY SERVICE TYPE (USD BILLION), 2020-2029
TABLE 70 FRANCE NUCLEAR DECOMMISSIONING SERVICES MARKET BY REACTOR TYPE (USD BILLION), 2020-2029
TABLE 71 FRANCE NUCLEAR DECOMMISSIONING SERVICES MARKET BY CAPACITY (USD BILLION), 2020-2029
TABLE 72 ITALY NUCLEAR DECOMMISSIONING SERVICES MARKET BY SERVICE TYPE (USD BILLION), 2020-2029
TABLE 73 ITALY NUCLEAR DECOMMISSIONING SERVICES MARKET BY REACTOR TYPE (USD BILLION), 2020-2029
TABLE 74 ITALY NUCLEAR DECOMMISSIONING SERVICES MARKET BY CAPACITY (USD BILLION), 2020-2029
TABLE 75 SPAIN NUCLEAR DECOMMISSIONING SERVICES MARKET BY SERVICE TYPE (USD BILLION), 2020-2029
TABLE 76 SPAIN NUCLEAR DECOMMISSIONING SERVICES MARKET BY REACTOR TYPE (USD BILLION), 2020-2029
TABLE 77 SPAIN NUCLEAR DECOMMISSIONING SERVICES MARKET BY CAPACITY (USD BILLION), 2020-2029
TABLE 78 RUSSIA NUCLEAR DECOMMISSIONING SERVICES MARKET BY SERVICE TYPE (USD BILLION), 2020-2029
TABLE 79 RUSSIA NUCLEAR DECOMMISSIONING SERVICES MARKET BY REACTOR TYPE (USD BILLION), 2020-2029
TABLE 80 RUSSIA NUCLEAR DECOMMISSIONING SERVICES MARKET BY CAPACITY (USD BILLION), 2020-2029
TABLE 81 REST OF EUROPE NUCLEAR DECOMMISSIONING SERVICES MARKET BY SERVICE TYPE (USD BILLION), 2020-2029
TABLE 82 REST OF EUROPE NUCLEAR DECOMMISSIONING SERVICES MARKET BY REACTOR TYPE (USD BILLION), 2020-2029
TABLE 83 REST OF EUROPE NUCLEAR DECOMMISSIONING SERVICES MARKET BY CAPACITY (USD BILLION), 2020-2029
TABLE 84 MIDDLE EAST AND AFRICA NUCLEAR DECOMMISSIONING SERVICES MARKET BY SERVICE TYPE (USD BILLION), 2020-2029
TABLE 85 MIDDLE EAST AND AFRICA NUCLEAR DECOMMISSIONING SERVICES MARKET BY REACTOR TYPE (USD BILLION), 2020-2029
TABLE 86 MIDDLE EAST AND AFRICA NUCLEAR DECOMMISSIONING SERVICES MARKET BY CAPACITY (USD BILLION), 2020-2029
TABLE 87 MIDDLE EAST AND AFRICA NUCLEAR DECOMMISSIONING SERVICES MARKET BY COUNTRY (USD BILLION), 2020-2029
TABLE 88 UAE NUCLEAR DECOMMISSIONING SERVICES MARKET BY SERVICE TYPE (USD BILLION), 2020-2029
TABLE 89 UAE NUCLEAR DECOMMISSIONING SERVICES MARKET BY REACTOR TYPE (USD BILLION), 2020-2029
TABLE 90 UAE NUCLEAR DECOMMISSIONING SERVICES MARKET BY CAPACITY (USD BILLION), 2020-2029
TABLE 91 SAUDI ARABIA NUCLEAR DECOMMISSIONING SERVICES MARKET BY SERVICE TYPE (USD BILLION), 2020-2029
TABLE 92 SAUDI ARABIA NUCLEAR DECOMMISSIONING SERVICES MARKET BY REACTOR TYPE (USD BILLION), 2020-2029
TABLE 93 SAUDI ARABIA NUCLEAR DECOMMISSIONING SERVICES MARKET BY CAPACITY (USD BILLION), 2020-2029
TABLE 94 SOUTH AFRICA NUCLEAR DECOMMISSIONING SERVICES MARKET BY SERVICE TYPE (USD BILLION), 2020-2029
TABLE 95 SOUTH AFRICA NUCLEAR DECOMMISSIONING SERVICES MARKET BY REACTOR TYPE (USD BILLION), 2020-2029
TABLE 96 SOUTH AFRICA NUCLEAR DECOMMISSIONING SERVICES MARKET BY CAPACITY (USD BILLION), 2020-2029
TABLE 97 REST OF MIDDLE EAST AND AFRICA NUCLEAR DECOMMISSIONING SERVICES MARKET BY SERVICE TYPE (USD BILLION), 2020-2029
TABLE 98 REST OF MIDDLE EAST AND AFRICA NUCLEAR DECOMMISSIONING SERVICES MARKET BY REACTOR TYPE (USD BILLION), 2020-2029
TABLE 99 REST OF MIDDLE EAST AND AFRICA NUCLEAR DECOMMISSIONING SERVICES MARKET BY CAPACITY (USD BILLION), 2020-2029
LIST OF FIGURES
FIGURE 1 MARKET DYNAMICS
FIGURE 2 MARKET SEGMENTATION
FIGURE 3 REPORT TIMELINES: YEARS CONSIDERED
FIGURE 4 DATA TRIANGULATION
FIGURE 5 BOTTOM-UP APPROACH
FIGURE 6 TOP-DOWN APPROACH
FIGURE 7 RESEARCH FLOW
FIGURE 8 GLOBAL NUCLEAR DECOMMISSIONING SERVICES BY SERVICE TYPE, USD BILLION, 2020-2029
FIGURE 9 GLOBAL NUCLEAR DECOMMISSIONING SERVICES BY REACTOR TYPE, USD BILLION, 2020-2029
FIGURE 10 GLOBAL NUCLEAR DECOMMISSIONING SERVICES BY CAPACITY, USD BILLION, 2020-2029
FIGURE 11 GLOBAL NUCLEAR DECOMMISSIONING SERVICES BY REGION, USD BILLION, 2020-2029
FIGURE 12 PORTER’S FIVE FORCES MODEL
FIGURE 13 GLOBAL NUCLEAR DECOMMISSIONING SERVICES MARKET BY REGION , USD BILLION, 2021
FIGURE 14 GLOBAL NUCLEAR DECOMMISSIONING SERVICES MARKET BY REACTOR TYPE, USD BILLION, 2021
FIGURE 15 GLOBAL NUCLEAR DECOMMISSIONING SERVICES MARKET BY SERVICE TYPE, USD BILLION, 2021
FIGURE 16 GLOBAL NUCLEAR DECOMMISSIONING SERVICES MARKET BY CAPACITY , USD BILLION, 2021
FIGURE 17 MARKET SHARE ANALYSIS
FIGURE 18 AECOM: COMPANY SNAPSHOT
FIGURE 19 ORANO USA: COMPANY SNAPSHOT
FIGURE 20 BABCOCK INTERNATIONAL GROUP PLC: COMPANY SNAPSHOT
FIGURE 21 STUDSVIK AB: COMPANY SNAPSHOT
FIGURE 22 WESTINGHOUSE ELECTRIC COMPANY LLC: COMPANY SNAPSHOT
FIGURE 23 ANSALDO ENERGIA: COMPANY SNAPSHOT
FIGURE 24 ENERCON: COMPANY SNAPSHOT
FIGURE 25 ENERGYSOLUTIONS: COMPANY SNAPSHOT
FIGURE 26 THE STATE ATOMIC ENERGY CORPORATION ROSATOM: COMPANY SNAPSHOT
FIGURE 27 KDC (VEOLIA): COMPANY SNAPSHOT
FIGURE 28 NUVIA: COMPANY SNAPSHOT
DOWNLOAD FREE SAMPLE REPORT
License Type
SPEAK WITH OUR ANALYST
Want to know more about the report or any specific requirement?
WANT TO CUSTOMIZE THE REPORT?
Our Clients Speak
We asked them to research ‘ Equipment market’ all over the world, and their whole arrangement was helpful to us. thehealthanalytics.com insightful analysis and reports contributed to our current analysis and in creating a future strategy. Besides, the te
Yosuke Mitsui
Senior Associate Construction Equipment Sales & Marketing
We asked them to research ‘Equipment market’ all over the world, and their whole arrangement was helpful to us. thehealthanalytics.com insightful analysis and reports contributed to our current analysis and in creating a future strategy. Besides, the te


