

Base Year Value ()
x.x %
x.x %
CAGR ()
x.x %
x.x %
Forecast Year Value ()
x.x %
x.x %
Historical Data Period
Largest Region
Forecast Period
PET Foam Market by By Raw Material (Virgin Pet, Recycled Pet), By Grade (Low-Density, High-Density), By Application (Wind Energy, Transportation, Marine) and Region, Global trends and forecast from 2023 to 2029
Instant access to hundreds of data points and trends
- Market estimates from 2014-2029
- Competitive analysis, industry segmentation, financial benchmarks
- Incorporates SWOT, Porter's Five Forces and risk management frameworks
- PDF report or online database with Word, Excel and PowerPoint export options
- 100% money back guarantee
PET Foam Market Overview
The PET foam market is expected to grow at 7.6% CAGR from 2022 to 2029. It is expected to reach above USD 646.8 million by 2029 from USD 360 million in 2021.
PET foam is a particular kind of foam made from the polymer poly (ethylene terephthalate). It is a versatile material that can be used for insulation, packaging, and cushioning. It is lightweight, strong, and flexible. PET resin is heated to a high temperature and pressure, which causes it to expand and form foam, to create PET foam. Due to its closed-cell structure and light weight, the resulting foam is a superior insulator. It is a solid option for packaging and cushioning applications due to its strength and durability. Since it is made from recycled PET bottles and can be recycled once more at the end of its useful life, PET foam is regarded as an environmentally friendly material. It is also non-toxic and doesn't contain any substances that harm the ozone, making it a healthy and environmentally friendly choice.
| ATTRIBUTE | DETAILS |
| Study period | 2020-2029 |
| Base year | 2021 |
| Estimated year | 2022 |
| Forecasted year | 2022-2029 |
| Historical period | 2018-2020 |
| Unit | Value (USD Million), Value (tons) |
| Segmentation | By Raw Material, By Grade, By Application, By Region |
| By Raw Material
|
|
| By Grade
|
|
| By Application
|
|
| By Region
|
|
PET foam is a flexible material that can be applied in a variety of ways. One of its most popular applications is in the construction sector, where it is used as a core material in sandwich panels and for insulation. Additionally, it is employed in the transportation sector for light weighting purposes in the creation of automobile interiors, aerospace components, and marine applications. In order to safeguard delicate items during transportation, PET foam is also used in packaging and cushioning materials. Additionally, it has uses in wind energy, athletic equipment, and medical devices. It is a well-liked option across industries due to its excellent insulation qualities, toughness, and sustainability.
Some of the main factors anticipated to significantly influence the demand for PET foams from the automotive industry during the forecast period include rising demand for lightweight vehicles and improved fuel efficiency. To reduce the overall weight of the vehicle, advanced materials and thermoplastics are replacing the metals currently used in these vehicles. Due to their ease of mass production and molding, PET foams are being used as an ideal solution for reducing vehicle weight and replacing metal parts in the automotive industry.
The PET foam market faces some challenges despite its many benefits, such as its relatively high cost when compared to other foam materials. Additionally, the manufacturing of PET foam requires specialized equipment, which can raise the cost of production. Additionally, the primary raw material for PET foam, recycled PET bottles, may not always be readily available. Other foam products with comparable properties are also a threat to the market, including polyurethane (PU) and expanded polystyrene (EPS) foam.
[caption id="attachment_23806" align="aligncenter" width="1920"]
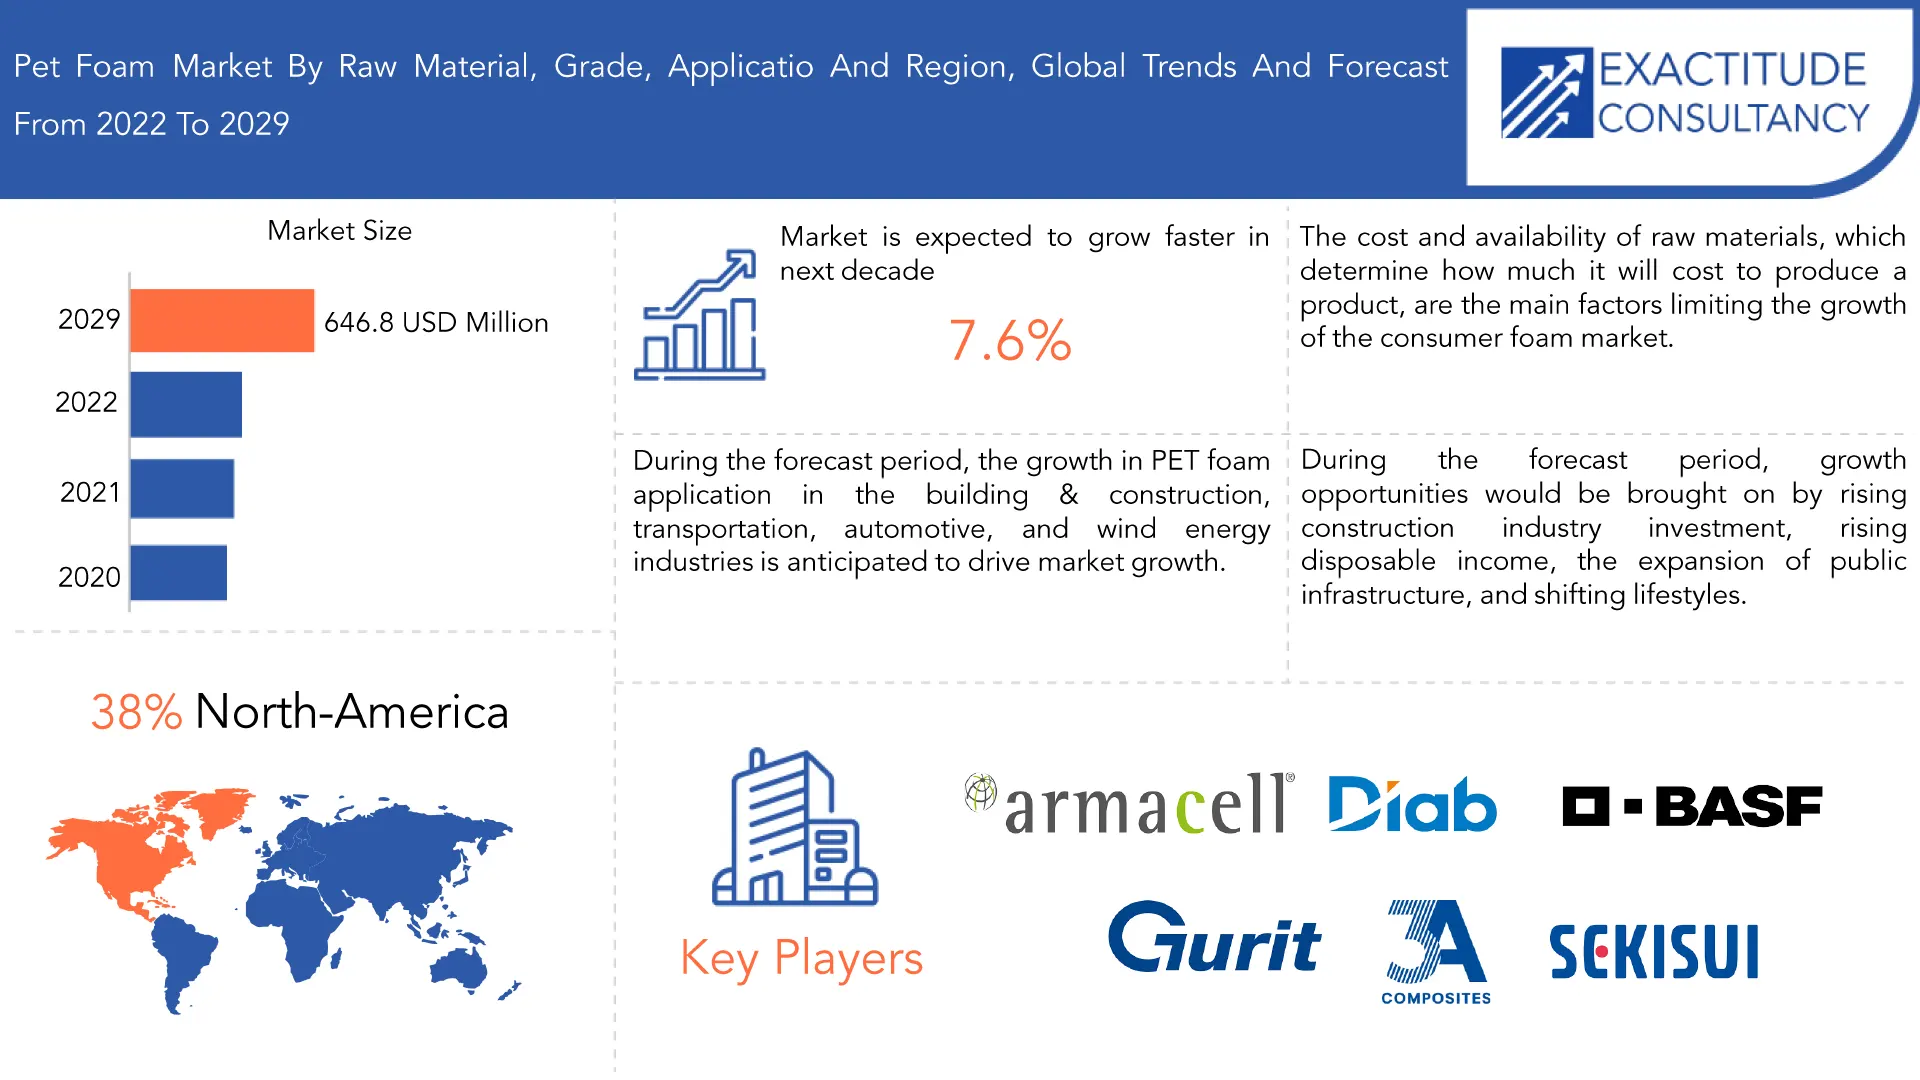
Consumer foam industry continues to adopt sustainable business practices as a result of growing concerns about the use of fossil fuels and the effects of plastics on the environment. In terms of sustainability, bio-derived materials, such as soy-based polyols, offer sizable advantages over traditional polyols. They also rely less on raw materials with a petroleum base. These elements present an opportunity for polyurethane producers to lessen their reliance on petroleum-based raw materials for the creation of consumer foam and to lower the price of producing these foams.
The majority of the industry where PET foam is used as a component in manufacturing nearly came to a standstill as a result of the COVID-19 outbreak globally. The expansion of the PET form market has been impacted. Multiple PET form manufacturing facilities had to close due to the lockdown situation, which had a negative impact on sales and the supply chain. The pandemic had a negative impact on the wind energy and marine industries, which led to lower PET foam consumption in these sectors. This, in turn, had a negative impact on the PET form market.
Frequently Asked Questions
• What is the projected market size & growth rate of the PET foam market?
PET foam market was valued at USD 387.4 million in 2022 and is projected to reach USD 646.8 million by 2029, growing at a CAGR of 7.6% from 2022 to 2029.
• What are the key drivers of the PET foam market?
Rise in demand for PET foam in building & construction industry and growth in wind energy market are the key drivers for PET foam market.
• What are the top players operating in the PET foam market?
The major players are Armacell International S.A., 3A Composites, Gurit Holding AG, DIAB Group, BASF SE, Sekisui Plastics Co. Ltd., Huntsman International LLC, CoreLite Inc., Changzhou Tiansheng New Materials Co. Ltd., Carbon-Core Corporation.
• What segments are covered in the PET foam market report?
The global PET foam market is segmented on the basis of raw material, grade, application, and geography.
• Which region held the largest share of PET foam market in 2021?
Asia-Pacific held the largest share of PET foam market in 2021.
PET Foam Market Segment Analysis
The pet foam market is segmented based on raw material, source, application and region. by raw material market is segmented into virgin PET and recycled PET; by grade market is segmented into low-density and high-density; by application market is segmented into wind energy, transportation, marine, building & construction, packaging, and others; and region.
The term "Virgin PET" refers to PET foam made from raw materials rather than recycled ones. PET that has been recycled comes from recycled materials. The market for recycled PET foam is the one that is expanding the quickest. Governments have passed laws and regulations to encourage recycling in response to growing public demand for recycling and waste reduction. The market's demand for recycled PET foam is anticipated to rise as a result of PET's recyclable nature. Vendors of PET foam are also making significant investments in developing recyclable PET foams and waste-minimizing manufacturing techniques.
[caption id="attachment_23812" align="aligncenter" width="1920"]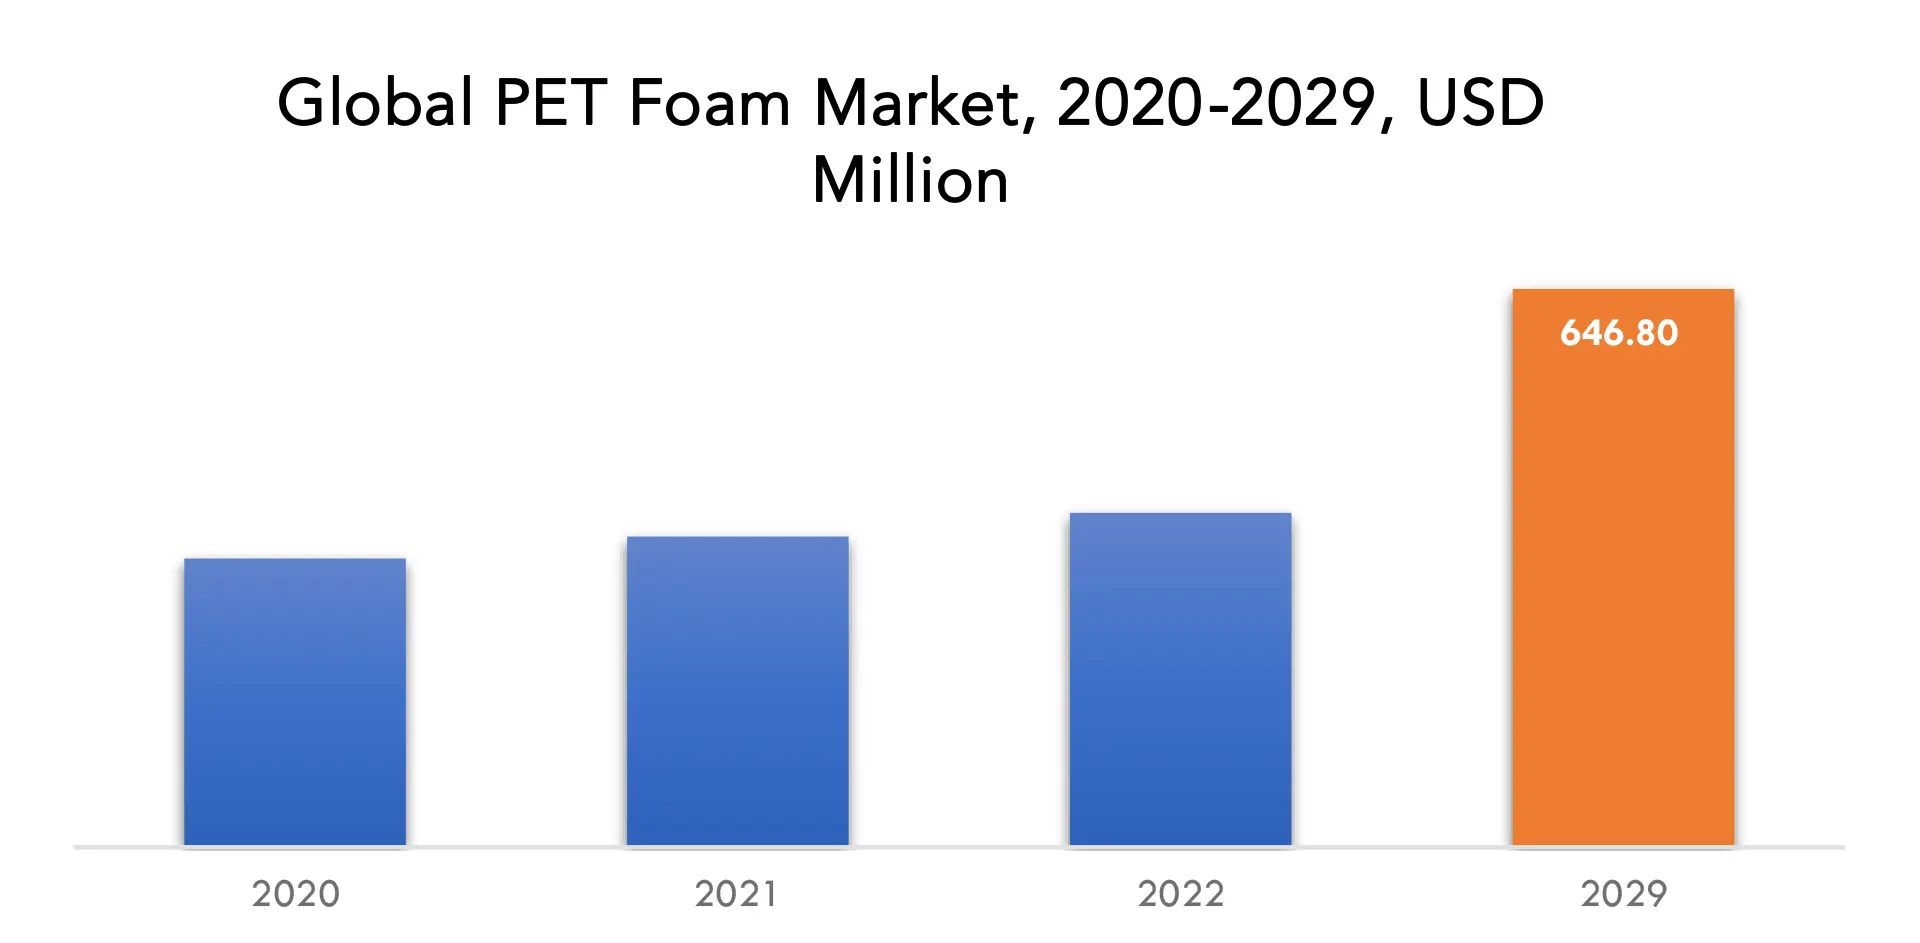
The segment with the largest market share is low-density PET foam, which is projected to expand at a CAGR of 7.8% during the forecast period. Low-density PET foam is preferred, particularly for commercial container applications due to it performs better at low temperatures and has the necessary stiffness for deeply formed containers. Low-density PET foams are being driven by the rapid expansion of the construction, building, and packaging industries, as well as the widespread use of this material in these sectors and its distinct advantages over other primary materials.
During the forecast period, the market for wind energy is anticipated to grow at a faster rate than any other. A rise in the demand for wind energy has contributed to the rising demand for clean fuels. The blades of the turbines that transform wind energy into electrical energy are made largely of PET foam in the wind energy sector. PET foam is used in the wind energy sector to create spinners, nacelles, casings, and rotor blades in addition to turbine blades. PET foam is used due to it has a high strength to weight ratio, is lightweight, compressive, and shear-resistant.
Competitive Landscape
The competitive landscape of the PET Foam market was dynamic, with several prominent companies competing to provide innovative and advanced PET Foam solutions.
- Armacell international s.a.
- 3a composites
- Gurit holding ag
- Diab group
- Basf se
- Sekisui plastics co. Ltd.
- Huntsman international llc
- Corelite inc.
- Changzhou tiansheng new materials co. Ltd.
- Carbon-core corporation
April 17, 2024 - Automotive experts from Huntsman have added a series of new lightweight, durable polyurethane foam technologies to the company’s battery solutions portfolio that have been developed for the potting and fixation of cells mounted in electric vehicle (EV) batteries. The new range also includes products that can be used as a moldable encapsulant in battery modules or packs.
April 24, 2024 – BASF has signed a Letter of Intent (LoI) with Youyi Group (Youyi) on April 22, 2024. This agreement marks a significant step to further strengthen the strategic partnership between the two companies, focusing on the supply of butyl acrylate (BA) and 2-ethylhexyl acrylate (2-EHA) from BASF’s Zhanjiang Verbund site to meet the growing demand in China’s adhesive materials industry.
Who Should Buy? Or Key stakeholders
- Manufacturers
- Traders and distributors
- Government organizations
- Research organizations
- Investment research firms
- Others
PET Foam Market Regional Analysis
The PET foam market by region includes North America, Asia-Pacific (APAC), Europe, South America, and Middle East & Africa (MEA).
- North America: includes the US, Canada, Mexico, Rest of North America
- Asia Pacific: includes China, Japan, South Korea, India, Australia, and Rest of APAC
- Europe: includes UK, Germany, France, Italy, Russia, Spain, and Rest of Europe
- South America: includes Brazil, Argentina, Colombia and Rest of South America
- Middle East & Africa: includes UAE, Saudi Arabia, South Africa, and Rest of MEA
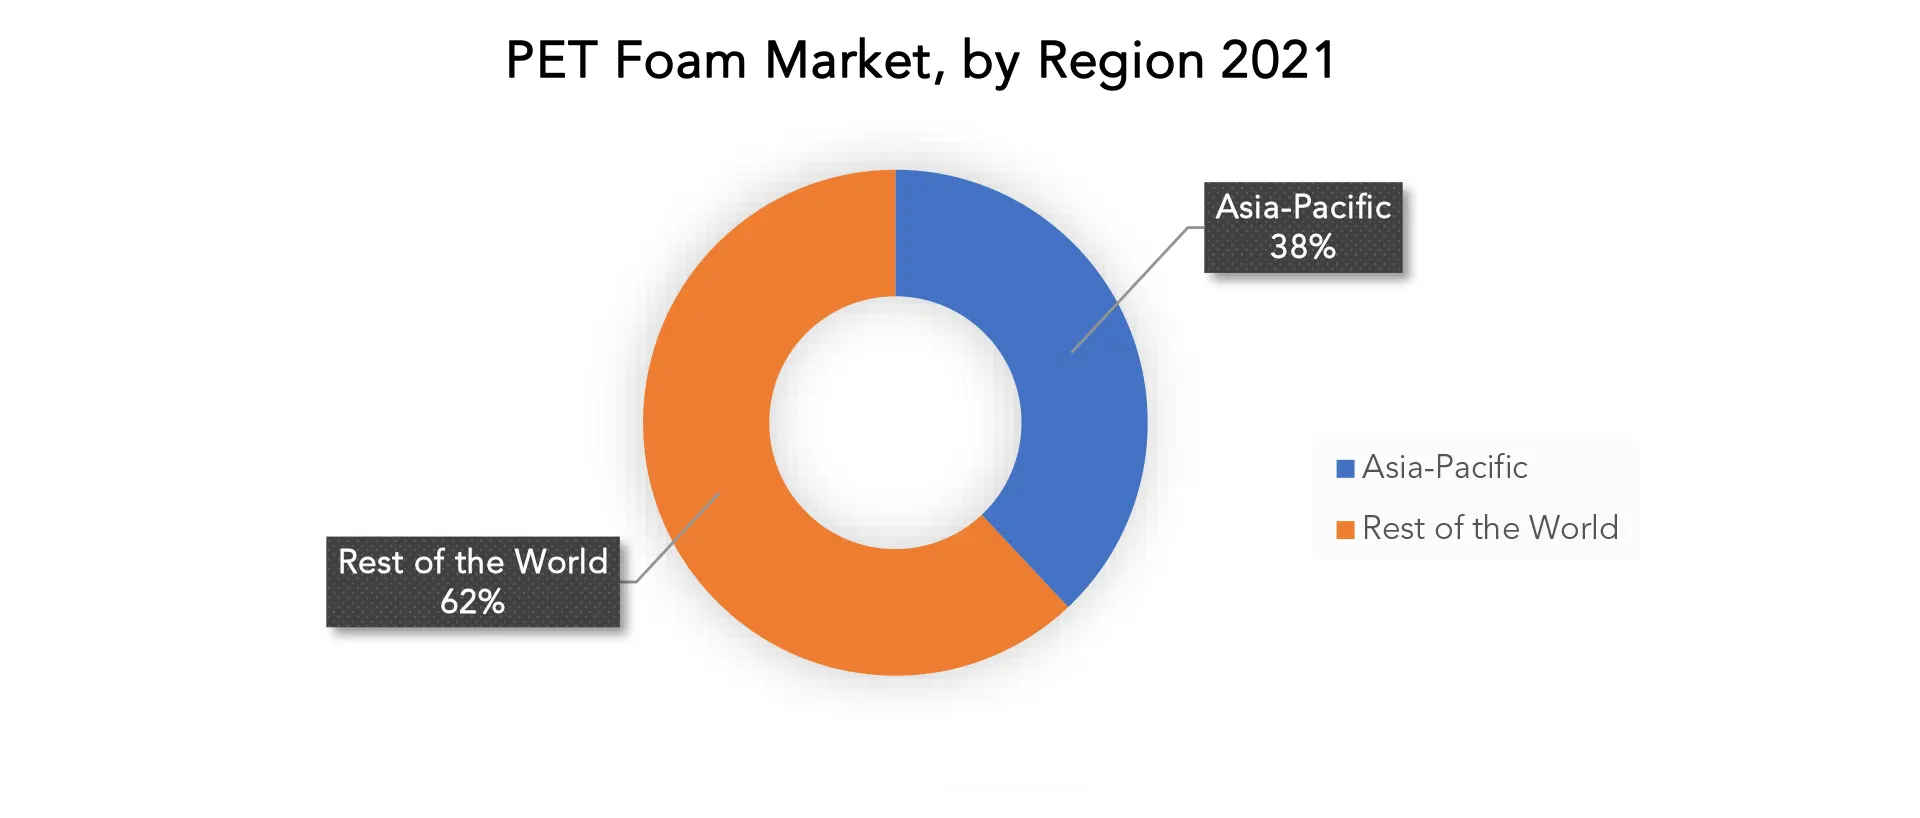
The largest market share belongs to Asia Pacific. Some factors contributing to this region's growth include rising urbanization, a booming automotive industry, technological advancements, and the expansion of foreign players in this region. The market for PET foam is expanding as a result of rising energy conservation awareness in the construction industry and initiatives to encourage the use of electric vehicles in developing nations. PET foam is in higher demand as a result of expanding economies in places like China, India, and Japan, as well as the established electronics sector. During the forecast period, expanding applications in wind energy and packaging are anticipated to present growth opportunities.
Key Market Segments: Pet Foam Market
Pet Foam Market By Raw Material, 2020-2029, (USD Million, Tons)- Virgin Pet
- Recycled Pet
- Low-Density
- High-Density
- Wind Energy
- Transportation
- Marine
- Building & Construction
- Packaging
- Others
- North America
- Asia Pacific
- Europe
- South America
- Middle East And Africa
Exactitude Consultancy Services Key Objectives:
- Increasing sales and market share
- Developing new technology
- Improving profitability
- Entering new markets
- Enhancing brand reputation
Key Question Answered
- What is the expected growth rate of the PET foam market over the next 7 years?
- What are the end-user industries driving demand for market and what is their outlook?
- What are the opportunities for growth in emerging markets such as Asia-pacific, Middle East, and Africa?
- How is the economic environment affecting the PET foam market, including factors such as interest rates, inflation, and exchange rates?
- What is the expected impact of government policies and regulations on the PET foam market?
- What is the current and forecasted size and growth rate of the global PET foam market?
- What are the key drivers of growth in the PET foam market?
- Who are the major players in the market and what is their market share?
- What are the distribution channels and supply chain dynamics in the PET foam market?
- What are the technological advancements and innovations in the PET foam market and their impact on product development and growth?
- What are the regulatory considerations and their impact on the market?
- What are the challenges faced by players in the PET foam market and how are they addressing these challenges?
- What are the opportunities for growth and expansion in the PET foam market?
- What are the service offerings and specifications of leading players in the market?
- What is the pricing trend of PET foam in the market and what is the impact of raw material prices on the price trend?
TABLE OF CONTENTS
COMPANY PROFILES* (BUSINESS OVERVIEW, COMPANY SNAPSHOT, PRODUCTS OFFERED, RECENT DEVELOPMENTS)
*THE COMPANY LIST IS INDICATIVE
TABLE 1 GLOBAL PET FOAM MARKET BY RAW MATERIAL (USD MILLION), 2020-2029
TABLE 2 GLOBAL PET FOAM MARKET BY RAW MATERIAL (TONS), 2020-2029
TABLE 3 GLOBAL PET FOAM MARKET BY GRADE (USD MILLION), 2020-2029
TABLE 4 GLOBAL PET FOAM MARKET BY GRADE (TONS), 2020-2029
TABLE 5 GLOBAL PET FOAM MARKET BY APPLICATION (USD MILLION), 2020-2029
TABLE 6 GLOBAL PET FOAM MARKET BY APPLICATION (TONS), 2020-2029
TABLE 7 GLOBAL PET FOAM MARKET BY REGION (USD MILLION), 2020-2029
TABLE 8 GLOBAL PET FOAM MARKET BY REGION (TONS), 2020-2029
TABLE 9 NORTH AMERICA PET FOAM MARKET BY RAW MATERIAL (USD MILLION), 2020-2029
TABLE 10 NORTH AMERICA PET FOAM MARKET BY RAW MATERIAL (TONS), 2020-2029
TABLE 11 NORTH AMERICA PET FOAM MARKET BY GRADE (USD MILLION), 2020-2029
TABLE 12 NORTH AMERICA PET FOAM MARKET BY GRADE (TONS), 2020-2029
TABLE 13 NORTH AMERICA PET FOAM MARKET BY APPLICATION (USD MILLION), 2020-2029
TABLE 14 NORTH AMERICA PET FOAM MARKET BY APPLICATION (TONS), 2020-2029
TABLE 15 NORTH AMERICA PET FOAM MARKET BY COUNTRY (USD MILLION), 2020-2029
TABLE 16 NORTH AMERICA PET FOAM MARKET BY COUNTRY (USD MILLION), 2020-2029
TABLE 17 US PET FOAM MARKET BY RAW MATERIAL (USD MILLION), 2020-2029
TABLE 18 US PET FOAM MARKET BY RAW MATERIAL (TONS), 2020-2029
TABLE 19 US PET FOAM MARKET BY GRADE (USD MILLION), 2020-2029
TABLE 20 US PET FOAM MARKET BY GRADE (TONS), 2020-2029
TABLE 21 US PET FOAM MARKET BY APPLICATION (USD MILLION), 2020-2029
TABLE 22 US PET FOAM MARKET BY APPLICATION (TONS), 2020-2029
TABLE 23 CANADA PET FOAM MARKET BY RAW MATERIAL (MILLION), 2020-2029
TABLE 24 CANADA PET FOAM MARKET BY RAW MATERIAL (TONS), 2020-2029
TABLE 25 CANADA PET FOAM MARKET BY GRADE (USD MILLION), 2020-2029
TABLE 26 CANADA PET FOAM MARKET BY GRADE (TONS), 2020-2029
TABLE 27 CANADA PET FOAM MARKET BY APPLICATION (USD MILLION), 2020-2029
TABLE 28 CANADA PET FOAM MARKET BY APPLICATION (TONS), 2020-2029
TABLE 29 MEXICO PET FOAM MARKET BY RAW MATERIAL (USD MILLION), 2020-2029
TABLE 30 MEXICO PET FOAM MARKET BY RAW MATERIAL (TONS), 2020-2029
TABLE 31 MEXICO PET FOAM MARKET BY GRADE (USD MILLION), 2020-2029
TABLE 32 MEXICO PET FOAM MARKET BY GRADE (TONS), 2020-2029
TABLE 33 MEXICO PET FOAM MARKET BY APPLICATION (USD MILLION), 2020-2029
TABLE 34 MEXICO PET FOAM MARKET BY APPLICATION (TONS), 2020-2029
TABLE 35 REST OF NORTH AMERICA PET FOAM MARKET BY RAW MATERIAL (USD MILLION), 2020-2029
TABLE 36 REST OF NORTH AMERICA PET FOAM MARKET BY RAW MATERIAL (TONS), 2020-2029
TABLE 37 REST OF NORTH AMERICA PET FOAM MARKET BY GRADE (USD MILLION), 2020-2029
TABLE 38 REST OF NORTH AMERICA PET FOAM MARKET BY GRADE (TONS), 2020-2029
TABLE 39 REST OF NORTH AMERICA PET FOAM MARKET BY APPLICATIONN (USD MILLION), 2020-2029
TABLE 40 REST OF NORTH AMERICA PET FOAM MARKET BY APPLICATIONN (TONS), 2020-2029
TABLE 41 SOUTH AMERICA PET FOAM MARKET BY RAW MATERIAL (USD MILLION), 2020-2029
TABLE 42 SOUTH AMERICA PET FOAM MARKET BY RAW MATERIAL (TONS), 2020-2029
TABLE 43 SOUTH AMERICA PET FOAM MARKET BY GRADE (USD MILLION), 2020-2029
TABLE 44 SOUTH AMERICA PET FOAM MARKET BY GRADE (TONS), 2020-2029
TABLE 45 SOUTH AMERICA PET FOAM MARKET BY APPLICATION (USD MILLION), 2020-2029
TABLE 46 SOUTH AMERICA PET FOAM MARKET BY APPLICATION (TONS), 2020-2029
TABLE 47 SOUTH AMERICA PET FOAM MARKET BY COUNTRY (USD MILLION), 2020-2029
TABLE 48 SOUTH AMERICA PET FOAM MARKET BY COUNTRY (USD MILLION), 2020-2029
TABLE 49 BRAZIL PET FOAM MARKET BY RAW MATERIAL (USD MILLION), 2020-2029
TABLE 50 BRAZIL PET FOAM MARKET BY RAW MATERIAL (TONS), 2020-2029
TABLE 51 BRAZIL PET FOAM MARKET BY GRADE (USD MILLION), 2020-2029
TABLE 52 BRAZIL PET FOAM MARKET BY GRADE (TONS), 2020-2029
TABLE 53 BRAZIL PET FOAM MARKET BY APPLICATION (USD MILLION), 2020-2029
TABLE 54 BRAZIL PET FOAM MARKET BY APPLICATION (TONS), 2020-2029
TABLE 55 ARGENTINA PET FOAM MARKET BY RAW MATERIAL (USD MILLION), 2020-2029
TABLE 56 ARGENTINA PET FOAM MARKET BY RAW MATERIAL (TONS), 2020-2029
TABLE 57 ARGENTINA PET FOAM MARKET BY GRADE (USD MILLION), 2020-2029
TABLE 58 ARGENTINA PET FOAM MARKET BY GRADE (TONS), 2020-2029
TABLE 59 ARGENTINA PET FOAM MARKET BY APPLICATION (USD MILLION), 2020-2029
TABLE 60 ARGENTINA PET FOAM MARKET BY APPLICATION (TONS), 2020-2029
TABLE 61 COLOMBIA PET FOAM MARKET BY RAW MATERIAL (USD MILLION), 2020-2029
TABLE 62 COLOMBIA PET FOAM MARKET BY RAW MATERIAL (TONS), 2020-2029
TABLE 63 COLOMBIA PET FOAM MARKET BY GRADE (USD MILLION), 2020-2029
TABLE 64 COLOMBIA PET FOAM MARKET BY GRADE (TONS), 2020-2029
TABLE 65 COLOMBIA PET FOAM MARKET BY APPLICATION (USD MILLION), 2020-2029
TABLE 66 COLOMBIA PET FOAM MARKET BY APPLICATION (TONS), 2020-2029
TABLE 67 REST OF SOUTH AMERICA PET FOAM MARKET BY RAW MATERIAL (USD MILLION), 2020-2029
TABLE 68 REST OF SOUTH AMERICA PET FOAM MARKET BY RAW MATERIAL (TONS), 2020-2029
TABLE 69 REST OF SOUTH AMERICA PET FOAM MARKET BY GRADE (USD MILLION), 2020-2029
TABLE 70 REST OF SOUTH AMERICA PET FOAM MARKET BY GRADE (TONS), 2020-2029
TABLE 71 REST OF SOUTH AMERICA PET FOAM MARKET BY APPLICATIONN (USD MILLION), 2020-2029
TABLE 72 REST OF SOUTH AMERICA PET FOAM MARKET BY APPLICATIONN (TONS), 2020-2029
TABLE 73 ASIA -PACIFIC PET FOAM MARKET BY RAW MATERIAL (USD MILLION), 2020-2029
TABLE 74 ASIA -PACIFIC PET FOAM MARKET BY RAW MATERIAL (TONS), 2020-2029
TABLE 75 ASIA -PACIFIC PET FOAM MARKET BY GRADE (USD MILLION), 2020-2029
TABLE 76 ASIA -PACIFIC PET FOAM MARKET BY GRADE (TONS), 2020-2029
TABLE 77 ASIA -PACIFIC PET FOAM MARKET BY APPLICATION (USD MILLION), 2020-2029
TABLE 78 ASIA -PACIFIC PET FOAM MARKET BY APPLICATION (TONS), 2020-2029
TABLE 79 ASIA -PACIFIC PET FOAM MARKET BY COUNTRY (USD MILLION), 2020-2029
TABLE 80 ASIA -PACIFIC PET FOAM MARKET BY COUNTRY (TONS), 2020-2029
TABLE 81 INDIA PET FOAM MARKET BY RAW MATERIAL (USD MILLION), 2020-2029
TABLE 82 INDIA PET FOAM MARKET BY RAW MATERIAL (TONS), 2020-2029
TABLE 83 INDIA PET FOAM MARKET BY GRADE (USD MILLION), 2020-2029
TABLE 84 INDIA PET FOAM MARKET BY GRADE (TONS), 2020-2029
TABLE 85 INDIA PET FOAM MARKET BY APPLICATION (USD MILLION), 2020-2029
TABLE 86 INDIA PET FOAM MARKET BY APPLICATION (TONS), 2020-2029
TABLE 87 CHINA PET FOAM MARKET BY RAW MATERIAL (USD MILLION), 2020-2029
TABLE 88 CHINA PET FOAM MARKET BY RAW MATERIAL (TONS), 2020-2029
TABLE 89 CHINA PET FOAM MARKET BY GRADE (USD MILLION), 2020-2029
TABLE 90 CHINA PET FOAM MARKET BY GRADE (TONS), 2020-2029
TABLE 91 CHINA PET FOAM MARKET BY APPLICATION (USD MILLION), 2020-2029
TABLE 92 CHINA PET FOAM MARKET BY APPLICATION (TONS), 2020-2029
TABLE 93 JAPAN PET FOAM MARKET BY RAW MATERIAL (USD MILLION), 2020-2029
TABLE 94 JAPAN PET FOAM MARKET BY RAW MATERIAL (TONS), 2020-2029
TABLE 95 JAPAN PET FOAM MARKET BY GRADE (USD MILLION), 2020-2029
TABLE 96 JAPAN PET FOAM MARKET BY GRADE (TONS), 2020-2029
TABLE 97 JAPAN PET FOAM MARKET BY APPLICATION (USD MILLION), 2020-2029
TABLE 98 JAPAN PET FOAM MARKET BY APPLICATION (TONS), 2020-2029
TABLE 99 SOUTH KOREA PET FOAM MARKET BY RAW MATERIAL (USD MILLION), 2020-2029
TABLE 100 SOUTH KOREA PET FOAM MARKET BY RAW MATERIAL (TONS), 2020-2029
TABLE 101 SOUTH KOREA PET FOAM MARKET BY GRADE (USD MILLION), 2020-2029
TABLE 102 SOUTH KOREA PET FOAM MARKET BY GRADE (TONS), 2020-2029
TABLE 103 SOUTH KOREA PET FOAM MARKET BY APPLICATION (USD MILLION), 2020-2029
TABLE 104 SOUTH KOREA PET FOAM MARKET BY APPLICATION (TONS), 2020-2029
TABLE 105 AUSTRALIA PET FOAM MARKET BY RAW MATERIAL (USD MILLION), 2020-2029
TABLE 106 AUSTRALIA PET FOAM MARKET BY GRADEBY RAW MATERIAL (TONS), 2020-2029
TABLE 107 AUSTRALIA PET FOAM MARKET BY GRADE (USD MILLION), 2020-2029
TABLE 108 AUSTRALIA PET FOAM MARKET BY GRADE (TONS), 2020-2029
TABLE 109 AUSTRALIA PET FOAM MARKET BY APPLICATION (USD MILLION), 2020-2029
TABLE 110 AUSTRALIA PET FOAM MARKET BY APPLICATION (TONS), 2020-2029
TABLE 111 REST OF ASIA PACIFIC PET FOAM MARKET BY RAW MATERIAL (USD MILLION), 2020-2029
TABLE 112 REST OF ASIA PACIFIC PET FOAM MARKET BY GRADEBY RAW MATERIAL (TONS), 2020-2029
TABLE 113 REST OF ASIA PACIFIC PET FOAM MARKET BY GRADE (USD MILLION), 2020-2029
TABLE 114 REST OF ASIA PACIFIC PET FOAM MARKET BY GRADE (TONS), 2020-2029
TABLE 115 REST OF ASIA PACIFIC PET FOAM MARKET BY APPLICATION (USD MILLION), 2020-2029
TABLE 116 REST OF ASIA PACIFIC PET FOAM MARKET BY APPLICATION (TONS), 2020-2029
TABLE 117 EUROPE PET FOAM MARKET BY RAW MATERIAL (USD MILLION), 2020-2029
TABLE 118 EUROPE PET FOAM MARKET BY RAW MATERIAL (TONS), 2020-2029
TABLE 119 EUROPE PET FOAM MARKET BY GRADE (USD MILLION), 2020-2029
TABLE 120 EUROPE PET FOAM MARKET BY GRADE (TONS), 2020-2029
TABLE 121 EUROPE PET FOAM MARKET BY APPLICATION (USD MILLION), 2020-2029
TABLE 122 EUROPE PET FOAM MARKET BY APPLICATION (TONS), 2020-2029
TABLE 123 EUROPE PET FOAM MARKET BY COUNTRY (USD MILLION), 2020-2029
TABLE 124 EUROPE PET FOAM MARKET BY COUNTRY (TONS), 2020-2029
TABLE 125 GERMANY PET FOAM MARKET BY RAW MATERIAL (USD MILLION), 2020-2029
TABLE 126 GERMANY PET FOAM MARKET BY RAW MATERIAL (TONS), 2020-2029
TABLE 127 GERMANY PET FOAM MARKET BY GRADE (USD MILLION), 2020-2029
TABLE 128 GERMANY PET FOAM MARKET BY GRADE (TONS), 2020-2029
TABLE 129 GERMANY PET FOAM MARKET BY APPLICATION (USD MILLION), 2020-2029
TABLE 130 GERMANY PET FOAM MARKET BY APPLICATION (TONS), 2020-2029
TABLE 131 UK PET FOAM MARKET BY RAW MATERIAL (USD MILLION), 2020-2029
TABLE 132 UK PET FOAM MARKET BY RAW MATERIAL (TONS), 2020-2029
TABLE 133 UK PET FOAM MARKET BY GRADE (USD MILLION), 2020-2029
TABLE 134 UK PET FOAM MARKET BY GRADE (TONS), 2020-2029
TABLE 135 UK PET FOAM MARKET BY APPLICATION (USD MILLION), 2020-2029
TABLE 136 UK PET FOAM MARKET BY APPLICATION (USD MILLION), 2020-2029
TABLE 137 FRANCE PET FOAM MARKET BY RAW MATERIAL (USD MILLION), 2020-2029
TABLE 138 FRANCE PET FOAM MARKET BY RAW MATERIAL (TONS), 2020-2029
TABLE 139 FRANCE PET FOAM MARKET BY GRADE (USD MILLION), 2020-2029
TABLE 140 FRANCE PET FOAM MARKET BY GRADE (TONS), 2020-2029
TABLE 141 FRANCE PET FOAM MARKET BY APPLICATION (USD MILLION), 2020-2029
TABLE 142 FRANCE PET FOAM MARKET BY APPLICATION (TONS), 2020-2029
TABLE 143 ITALY PET FOAM MARKET BY RAW MATERIAL (USD MILLION), 2020-2029
TABLE 144 ITALY PET FOAM MARKET BY RAW MATERIAL (TONS), 2020-2029
TABLE 145 ITALY PET FOAM MARKET BY GRADE (USD MILLION), 2020-2029
TABLE 146 ITALY PET FOAM MARKET BY GRADE (TONS), 2020-2029
TABLE 147 ITALY PET FOAM MARKET BY APPLICATION (USD MILLION), 2020-2029
TABLE 148 ITALY PET FOAM MARKET BY APPLICATION (TONS), 2020-2029
TABLE 149 SPAIN PET FOAM MARKET BY RAW MATERIAL (USD MILLION), 2020-2029
TABLE 150 SPAIN PET FOAM MARKET BY RAW MATERIAL (TONS), 2020-2029
TABLE 151 SPAIN PET FOAM MARKET BY GRADE (USD MILLION), 2020-2029
TABLE 152 SPAIN PET FOAM MARKET BY GRADE (TONS), 2020-2029
TABLE 153 SPAIN PET FOAM MARKET BY APPLICATION (USD MILLION), 2020-2029
TABLE 154 SPAIN PET FOAM MARKET BY APPLICATION (TONS), 2020-2029
TABLE 155 RUSSIA PET FOAM MARKET BY RAW MATERIAL (USD MILLION), 2020-2029
TABLE 156 RUSSIA PET FOAM MARKET BY RAW MATERIAL (TONS), 2020-2029
TABLE 157 RUSSIA PET FOAM MARKET BY GRADE (USD MILLION), 2020-2029
TABLE 158 RUSSIA PET FOAM MARKET BY GRADE (TONS), 2020-2029
TABLE 159 RUSSIA PET FOAM MARKET BY APPLICATION (USD MILLION), 2020-2029
TABLE 160 RUSSIA PET FOAM MARKET BY APPLICATION (TONS), 2020-2029
TABLE 161 REST OF EUROPE PET FOAM MARKET BY RAW MATERIAL (USD MILLION), 2020-2029
TABLE 162 REST OF EUROPE PET FOAM MARKET BY RAW MATERIAL (TONS), 2020-2029
TABLE 163 REST OF EUROPE PET FOAM MARKET BY GRADE (USD MILLION), 2020-2029
TABLE 164 REST OF EUROPE PET FOAM MARKET BY GRADE (TONS), 2020-2029
TABLE 165 REST OF EUROPE PET FOAM MARKET BY APPLICATIONN (USD MILLION), 2020-2029
TABLE 166 REST OF EUROPE PET FOAM MARKET BY APPLICATIONN (TONS), 2020-2029
TABLE 167 MIDDLE EAST AND AFRICA PET FOAM MARKET BY RAW MATERIAL (USD MILLION), 2020-2029
TABLE 168 MIDDLE EAST AND AFRICA PET FOAM MARKET BY RAW MATERIAL (TONS), 2020-2029
TABLE 169 MIDDLE EAST AND AFRICA PET FOAM MARKET BY GRADE (USD MILLION), 2020-2029
TABLE 170 MIDDLE EAST AND AFRICA PET FOAM MARKET BY GRADE (TONS), 2020-2029
TABLE 171 MIDDLE EAST AND AFRICA PET FOAM MARKET BY APPLICATION (USD MILLION), 2020-2029
TABLE 172 MIDDLE EAST AND AFRICA PET FOAM MARKET BY APPLICATION (TONS), 2020-2029
TABLE 173 MIDDLE EAST AND AFRICA PET FOAM MARKET BY COUNTRY (USD MILLION), 2020-2029
TABLE 174 MIDDLE EAST AND AFRICA PET FOAM MARKET BY COUNTRY (TONS), 2020-2029
TABLE 175 UAE PET FOAM MARKET BY RAW MATERIAL (USD MILLION), 2020-2029
TABLE 176 UAE PET FOAM MARKET BY RAW MATERIAL (TONS), 2020-2029
TABLE 177 UAE PET FOAM MARKET BY GRADE (USD MILLION), 2020-2029
TABLE 178 UAE PET FOAM MARKET BY GRADE (TONS), 2020-2029
TABLE 179 UAE PET FOAM MARKET BY APPLICATION (USD MILLION), 2020-2029
TABLE 180 UAE PET FOAM MARKET BY APPLICATION (TONS), 2020-2029
TABLE 181 SAUDI ARABIA PET FOAM MARKET BY RAW MATERIAL (USD MILLION), 2020-2029
TABLE 182 SAUDI ARABIA PET FOAM MARKET BY RAW MATERIAL (TONS), 2020-2029
TABLE 183 SAUDI ARABIA PET FOAM MARKET BY GRADE (USD MILLION), 2020-2029
TABLE 184 SAUDI ARABIA PET FOAM MARKET BY GRADE (TONS), 2020-2029
TABLE 185 SAUDI ARABIA PET FOAM MARKET BY APPLICATION (USD MILLION), 2020-2029
TABLE 186 SAUDI ARABIA PET FOAM MARKET BY APPLICATION (TONS), 2020-2029
TABLE 187 SOUTH AFRICA PET FOAM MARKET BY RAW MATERIAL (USD MILLION), 2020-2029
TABLE 188 SOUTH AFRICA PET FOAM MARKET BY RAW MATERIAL (TONS), 2020-2029
TABLE 189 SOUTH AFRICA PET FOAM MARKET BY GRADE (USD MILLION), 2020-2029
TABLE 190 SOUTH AFRICA PET FOAM MARKET BY GRADE (TONS), 2020-2029
TABLE 191 SOUTH AFRICA PET FOAM MARKET BY APPLICATION (USD MILLION), 2020-2029
TABLE 192 SOUTH AFRICA PET FOAM MARKET BY APPLICATION (TONS), 2020-2029
TABLE 193 REST OF MIDDLE EAST AND AFRICA PET FOAM MARKET BY RAW MATERIAL (USD MILLION), 2020-2029
TABLE 194 REST OF MIDDLE EAST AND AFRICA PET FOAM MARKET BY RAW MATERIAL (TONS), 2020-2029
TABLE 195 REST OF MIDDLE EAST AND AFRICA PET FOAM MARKET BY GRADE (USD MILLION), 2020-2029
TABLE 196 REST OF MIDDLE EAST AND AFRICA PET FOAM MARKET BY GRADE (TONS), 2020-2029
TABLE 197 REST OF MIDDLE EAST AND AFRICA PET FOAM MARKET BY APPLICATION (USD MILLION), 2020-2029
TABLE 198 REST OF MIDDLE EAST AND AFRICA PET FOAM MARKET BY APPLICATION (TONS), 2020-2029
LIST OF FIGURES
FIGURE 1 MARKET DYNAMICS
FIGURE 2 MARKET SEGMENTATION
FIGURE 3 REPORT TIMELINES: YEARS CONSIDERED
FIGURE 4 DATA TRIANGULATION
FIGURE 5 BOTTOM-UP APPROACH
FIGURE 6 TOP-DOWN APPROACH
FIGURE 7 RESEARCH FLOW
FIGURE 8 GLOBAL PET FOAM MARKET BY RAW MATERIAL, USD MILLION, 2020-2029
FIGURE 9 GLOBAL PET FOAM MARKET BY GRADE, USD MILLION, 2020-2029
FIGURE 10 GLOBAL PET FOAM MARKET BY APPLICATION, USD MILLION, 2021
FIGURE 11 GLOBAL PET FOAM MARKET BY REGION, USD MILLION, 2020-2029
FIGURE 12 PORTER’S FIVE FORCES MODEL
FIGURE 13 GLOBAL PET FOAM MARKET BY RAW MATERIAL, USD MILLION, 2021
FIGURE 14 GLOBAL PET FOAM MARKET BY GRADE, USD MILLION, 2021
FIGURE 15 GLOBAL PET FOAM MARKET BY APPLICATION, USD MILLION, 2021
FIGURE 16 GLOBAL PET FOAM MARKET BY REGION, USD MILLION, 2021
FIGURE 17 MARKET SHARE ANALYSIS
FIGURE 18 ARMACELL INTERNATIONAL S.A.: COMPANY SNAPSHOT
FIGURE 19 3A COMPOSITES: COMPANY SNAPSHOT
FIGURE 20 GURIT HOLDING AG: COMPANY SNAPSHOT
FIGURE 21 DIAB GROUP: COMPANY SNAPSHOT
FIGURE 22 BASF SE: COMPANY SNAPSHOT
FIGURE 23 SEKISUI PLASTICS CO. LTD.: COMPANY SNAPSHOT
FIGURE 24 HUNTSMAN INTERNATIONAL LLC: COMPANY SNAPSHOT
FIGURE 25 CORELITE INC.: COMPANY SNAPSHOT
FIGURE 26 CHANGZHOU TIANSHENG NEW MATERIALS CO. LTD.: COMPANY SNAPSHOT
FIGURE 27 CARBON-CORE CORPORATION: COMPANY SNAPSHOT
- INTRODUCTION
- MARKET DEFINITION
- MARKET SEGMENTATION
- RESEARCH TIMELINES
- ASSUMPTIONS AND LIMITATIONS
- RESEARCH METHODOLOGY
- DATA MINING
- SECONDARY RESEARCH
- PRIMARY RESEARCH
- SUBJECT-MATTER EXPERTS’ ADVICE
- QUALITY CHECKS
- FINAL REVIEW
- DATA TRIANGULATION
- BOTTOM-UP APPROACH
- TOP-DOWN APPROACH
- RESEARCH FLOW
- DATA SOURCES
- DATA MINING
- EXECUTIVE SUMMARY
- MARKET OVERVIEW
- GLOBAL PET FOAM MARKET OUTLOOK
- MARKET DRIVERS
- MARKET RESTRAINTS
- MARKET OPPORTUNITIES
- IMPACT OF COVID-19 ON PET FOAM MARKET
- PORTER’S FIVE FORCES MODEL
- THREAT FROM NEW ENTRANTS
- THREAT FROM SUBSTITUTES
- BARGAINING POWER OF SUPPLIERS
- BARGAINING POWER OF CUSTOMERS
- DEGREE OF COMPETITION
- INDUSTRY VALUE CHAIN ANALYSIS
- GLOBAL PET FOAM MARKET OUTLOOK
- GLOBAL PET FOAM MARKET BY RAW MATERIAL (USD MILLION, TONS), 2020-2029
- VIRGIN PET
- RECYCLED PET
- GLOBAL PET FOAM MARKET BY GRADE (USD MILLION, TONS),2020-2029
- LOW-DENSITY
- HIGH-DENSITY
- GLOBAL PET FOAM MARKET BY APPLICATION(USD MILLION, TONS),2020-2029
- WIND ENERGY
- TRANSPORTATION
- MARINE
- BUILDING & CONSTRUCTION
- PACKAGING
- OTHERS
- GLOBAL PET FOAM MARKET BY REGION (USD MILLION, TONS),2020-2029
- NORTH AMERICA
- US
- CANADA
- MEXICO
- REST OF NORTH AMERICA
- SOUTH AMERICA
- BRAZIL
- ARGENTINA
- COLOMBIA
- REST OF SOUTH AMERICA
- EUROPE
- GERMANY
- UK
- FRANCE
- ITALY
- SPAIN
- RUSSIA
- REST OF EUROPE
- ASIA PACIFIC
- INDIA
- CHINA
- JAPAN
- SOUTH KOREA
- AUSTRALIA
- REST OF ASIA PACIFIC
- MIDDLE EAST AND AFRICA
- UAE
- SAUDI ARABIA
- SOUTH AFRICA
- REST OF MIDDLE EAST AND AFRICA
- NORTH AMERICA
COMPANY PROFILES* (BUSINESS OVERVIEW, COMPANY SNAPSHOT, PRODUCTS OFFERED, RECENT DEVELOPMENTS)
- ARMACELL INTERNATIONAL S.A.
- 3A COMPOSITES
- GURIT HOLDING AG
- DIAB GROUP
- BASF SE
- SEKISUI PLASTICS CO. LTD.
- HUNTSMAN INTERNATIONAL LLC
- CORELITE INC.
- CHANGZHOU TIANSHENG NEW MATERIALS CO. LTD.
- CARBON-CORE CORPORATION
*THE COMPANY LIST IS INDICATIVE
LIST OF TABLES
TABLE 1 GLOBAL PET FOAM MARKET BY RAW MATERIAL (USD MILLION), 2020-2029
TABLE 2 GLOBAL PET FOAM MARKET BY RAW MATERIAL (TONS), 2020-2029
TABLE 3 GLOBAL PET FOAM MARKET BY GRADE (USD MILLION), 2020-2029
TABLE 4 GLOBAL PET FOAM MARKET BY GRADE (TONS), 2020-2029
TABLE 5 GLOBAL PET FOAM MARKET BY APPLICATION (USD MILLION), 2020-2029
TABLE 6 GLOBAL PET FOAM MARKET BY APPLICATION (TONS), 2020-2029
TABLE 7 GLOBAL PET FOAM MARKET BY REGION (USD MILLION), 2020-2029
TABLE 8 GLOBAL PET FOAM MARKET BY REGION (TONS), 2020-2029
TABLE 9 NORTH AMERICA PET FOAM MARKET BY RAW MATERIAL (USD MILLION), 2020-2029
TABLE 10 NORTH AMERICA PET FOAM MARKET BY RAW MATERIAL (TONS), 2020-2029
TABLE 11 NORTH AMERICA PET FOAM MARKET BY GRADE (USD MILLION), 2020-2029
TABLE 12 NORTH AMERICA PET FOAM MARKET BY GRADE (TONS), 2020-2029
TABLE 13 NORTH AMERICA PET FOAM MARKET BY APPLICATION (USD MILLION), 2020-2029
TABLE 14 NORTH AMERICA PET FOAM MARKET BY APPLICATION (TONS), 2020-2029
TABLE 15 NORTH AMERICA PET FOAM MARKET BY COUNTRY (USD MILLION), 2020-2029
TABLE 16 NORTH AMERICA PET FOAM MARKET BY COUNTRY (USD MILLION), 2020-2029
TABLE 17 US PET FOAM MARKET BY RAW MATERIAL (USD MILLION), 2020-2029
TABLE 18 US PET FOAM MARKET BY RAW MATERIAL (TONS), 2020-2029
TABLE 19 US PET FOAM MARKET BY GRADE (USD MILLION), 2020-2029
TABLE 20 US PET FOAM MARKET BY GRADE (TONS), 2020-2029
TABLE 21 US PET FOAM MARKET BY APPLICATION (USD MILLION), 2020-2029
TABLE 22 US PET FOAM MARKET BY APPLICATION (TONS), 2020-2029
TABLE 23 CANADA PET FOAM MARKET BY RAW MATERIAL (MILLION), 2020-2029
TABLE 24 CANADA PET FOAM MARKET BY RAW MATERIAL (TONS), 2020-2029
TABLE 25 CANADA PET FOAM MARKET BY GRADE (USD MILLION), 2020-2029
TABLE 26 CANADA PET FOAM MARKET BY GRADE (TONS), 2020-2029
TABLE 27 CANADA PET FOAM MARKET BY APPLICATION (USD MILLION), 2020-2029
TABLE 28 CANADA PET FOAM MARKET BY APPLICATION (TONS), 2020-2029
TABLE 29 MEXICO PET FOAM MARKET BY RAW MATERIAL (USD MILLION), 2020-2029
TABLE 30 MEXICO PET FOAM MARKET BY RAW MATERIAL (TONS), 2020-2029
TABLE 31 MEXICO PET FOAM MARKET BY GRADE (USD MILLION), 2020-2029
TABLE 32 MEXICO PET FOAM MARKET BY GRADE (TONS), 2020-2029
TABLE 33 MEXICO PET FOAM MARKET BY APPLICATION (USD MILLION), 2020-2029
TABLE 34 MEXICO PET FOAM MARKET BY APPLICATION (TONS), 2020-2029
TABLE 35 REST OF NORTH AMERICA PET FOAM MARKET BY RAW MATERIAL (USD MILLION), 2020-2029
TABLE 36 REST OF NORTH AMERICA PET FOAM MARKET BY RAW MATERIAL (TONS), 2020-2029
TABLE 37 REST OF NORTH AMERICA PET FOAM MARKET BY GRADE (USD MILLION), 2020-2029
TABLE 38 REST OF NORTH AMERICA PET FOAM MARKET BY GRADE (TONS), 2020-2029
TABLE 39 REST OF NORTH AMERICA PET FOAM MARKET BY APPLICATIONN (USD MILLION), 2020-2029
TABLE 40 REST OF NORTH AMERICA PET FOAM MARKET BY APPLICATIONN (TONS), 2020-2029
TABLE 41 SOUTH AMERICA PET FOAM MARKET BY RAW MATERIAL (USD MILLION), 2020-2029
TABLE 42 SOUTH AMERICA PET FOAM MARKET BY RAW MATERIAL (TONS), 2020-2029
TABLE 43 SOUTH AMERICA PET FOAM MARKET BY GRADE (USD MILLION), 2020-2029
TABLE 44 SOUTH AMERICA PET FOAM MARKET BY GRADE (TONS), 2020-2029
TABLE 45 SOUTH AMERICA PET FOAM MARKET BY APPLICATION (USD MILLION), 2020-2029
TABLE 46 SOUTH AMERICA PET FOAM MARKET BY APPLICATION (TONS), 2020-2029
TABLE 47 SOUTH AMERICA PET FOAM MARKET BY COUNTRY (USD MILLION), 2020-2029
TABLE 48 SOUTH AMERICA PET FOAM MARKET BY COUNTRY (USD MILLION), 2020-2029
TABLE 49 BRAZIL PET FOAM MARKET BY RAW MATERIAL (USD MILLION), 2020-2029
TABLE 50 BRAZIL PET FOAM MARKET BY RAW MATERIAL (TONS), 2020-2029
TABLE 51 BRAZIL PET FOAM MARKET BY GRADE (USD MILLION), 2020-2029
TABLE 52 BRAZIL PET FOAM MARKET BY GRADE (TONS), 2020-2029
TABLE 53 BRAZIL PET FOAM MARKET BY APPLICATION (USD MILLION), 2020-2029
TABLE 54 BRAZIL PET FOAM MARKET BY APPLICATION (TONS), 2020-2029
TABLE 55 ARGENTINA PET FOAM MARKET BY RAW MATERIAL (USD MILLION), 2020-2029
TABLE 56 ARGENTINA PET FOAM MARKET BY RAW MATERIAL (TONS), 2020-2029
TABLE 57 ARGENTINA PET FOAM MARKET BY GRADE (USD MILLION), 2020-2029
TABLE 58 ARGENTINA PET FOAM MARKET BY GRADE (TONS), 2020-2029
TABLE 59 ARGENTINA PET FOAM MARKET BY APPLICATION (USD MILLION), 2020-2029
TABLE 60 ARGENTINA PET FOAM MARKET BY APPLICATION (TONS), 2020-2029
TABLE 61 COLOMBIA PET FOAM MARKET BY RAW MATERIAL (USD MILLION), 2020-2029
TABLE 62 COLOMBIA PET FOAM MARKET BY RAW MATERIAL (TONS), 2020-2029
TABLE 63 COLOMBIA PET FOAM MARKET BY GRADE (USD MILLION), 2020-2029
TABLE 64 COLOMBIA PET FOAM MARKET BY GRADE (TONS), 2020-2029
TABLE 65 COLOMBIA PET FOAM MARKET BY APPLICATION (USD MILLION), 2020-2029
TABLE 66 COLOMBIA PET FOAM MARKET BY APPLICATION (TONS), 2020-2029
TABLE 67 REST OF SOUTH AMERICA PET FOAM MARKET BY RAW MATERIAL (USD MILLION), 2020-2029
TABLE 68 REST OF SOUTH AMERICA PET FOAM MARKET BY RAW MATERIAL (TONS), 2020-2029
TABLE 69 REST OF SOUTH AMERICA PET FOAM MARKET BY GRADE (USD MILLION), 2020-2029
TABLE 70 REST OF SOUTH AMERICA PET FOAM MARKET BY GRADE (TONS), 2020-2029
TABLE 71 REST OF SOUTH AMERICA PET FOAM MARKET BY APPLICATIONN (USD MILLION), 2020-2029
TABLE 72 REST OF SOUTH AMERICA PET FOAM MARKET BY APPLICATIONN (TONS), 2020-2029
TABLE 73 ASIA -PACIFIC PET FOAM MARKET BY RAW MATERIAL (USD MILLION), 2020-2029
TABLE 74 ASIA -PACIFIC PET FOAM MARKET BY RAW MATERIAL (TONS), 2020-2029
TABLE 75 ASIA -PACIFIC PET FOAM MARKET BY GRADE (USD MILLION), 2020-2029
TABLE 76 ASIA -PACIFIC PET FOAM MARKET BY GRADE (TONS), 2020-2029
TABLE 77 ASIA -PACIFIC PET FOAM MARKET BY APPLICATION (USD MILLION), 2020-2029
TABLE 78 ASIA -PACIFIC PET FOAM MARKET BY APPLICATION (TONS), 2020-2029
TABLE 79 ASIA -PACIFIC PET FOAM MARKET BY COUNTRY (USD MILLION), 2020-2029
TABLE 80 ASIA -PACIFIC PET FOAM MARKET BY COUNTRY (TONS), 2020-2029
TABLE 81 INDIA PET FOAM MARKET BY RAW MATERIAL (USD MILLION), 2020-2029
TABLE 82 INDIA PET FOAM MARKET BY RAW MATERIAL (TONS), 2020-2029
TABLE 83 INDIA PET FOAM MARKET BY GRADE (USD MILLION), 2020-2029
TABLE 84 INDIA PET FOAM MARKET BY GRADE (TONS), 2020-2029
TABLE 85 INDIA PET FOAM MARKET BY APPLICATION (USD MILLION), 2020-2029
TABLE 86 INDIA PET FOAM MARKET BY APPLICATION (TONS), 2020-2029
TABLE 87 CHINA PET FOAM MARKET BY RAW MATERIAL (USD MILLION), 2020-2029
TABLE 88 CHINA PET FOAM MARKET BY RAW MATERIAL (TONS), 2020-2029
TABLE 89 CHINA PET FOAM MARKET BY GRADE (USD MILLION), 2020-2029
TABLE 90 CHINA PET FOAM MARKET BY GRADE (TONS), 2020-2029
TABLE 91 CHINA PET FOAM MARKET BY APPLICATION (USD MILLION), 2020-2029
TABLE 92 CHINA PET FOAM MARKET BY APPLICATION (TONS), 2020-2029
TABLE 93 JAPAN PET FOAM MARKET BY RAW MATERIAL (USD MILLION), 2020-2029
TABLE 94 JAPAN PET FOAM MARKET BY RAW MATERIAL (TONS), 2020-2029
TABLE 95 JAPAN PET FOAM MARKET BY GRADE (USD MILLION), 2020-2029
TABLE 96 JAPAN PET FOAM MARKET BY GRADE (TONS), 2020-2029
TABLE 97 JAPAN PET FOAM MARKET BY APPLICATION (USD MILLION), 2020-2029
TABLE 98 JAPAN PET FOAM MARKET BY APPLICATION (TONS), 2020-2029
TABLE 99 SOUTH KOREA PET FOAM MARKET BY RAW MATERIAL (USD MILLION), 2020-2029
TABLE 100 SOUTH KOREA PET FOAM MARKET BY RAW MATERIAL (TONS), 2020-2029
TABLE 101 SOUTH KOREA PET FOAM MARKET BY GRADE (USD MILLION), 2020-2029
TABLE 102 SOUTH KOREA PET FOAM MARKET BY GRADE (TONS), 2020-2029
TABLE 103 SOUTH KOREA PET FOAM MARKET BY APPLICATION (USD MILLION), 2020-2029
TABLE 104 SOUTH KOREA PET FOAM MARKET BY APPLICATION (TONS), 2020-2029
TABLE 105 AUSTRALIA PET FOAM MARKET BY RAW MATERIAL (USD MILLION), 2020-2029
TABLE 106 AUSTRALIA PET FOAM MARKET BY GRADEBY RAW MATERIAL (TONS), 2020-2029
TABLE 107 AUSTRALIA PET FOAM MARKET BY GRADE (USD MILLION), 2020-2029
TABLE 108 AUSTRALIA PET FOAM MARKET BY GRADE (TONS), 2020-2029
TABLE 109 AUSTRALIA PET FOAM MARKET BY APPLICATION (USD MILLION), 2020-2029
TABLE 110 AUSTRALIA PET FOAM MARKET BY APPLICATION (TONS), 2020-2029
TABLE 111 REST OF ASIA PACIFIC PET FOAM MARKET BY RAW MATERIAL (USD MILLION), 2020-2029
TABLE 112 REST OF ASIA PACIFIC PET FOAM MARKET BY GRADEBY RAW MATERIAL (TONS), 2020-2029
TABLE 113 REST OF ASIA PACIFIC PET FOAM MARKET BY GRADE (USD MILLION), 2020-2029
TABLE 114 REST OF ASIA PACIFIC PET FOAM MARKET BY GRADE (TONS), 2020-2029
TABLE 115 REST OF ASIA PACIFIC PET FOAM MARKET BY APPLICATION (USD MILLION), 2020-2029
TABLE 116 REST OF ASIA PACIFIC PET FOAM MARKET BY APPLICATION (TONS), 2020-2029
TABLE 117 EUROPE PET FOAM MARKET BY RAW MATERIAL (USD MILLION), 2020-2029
TABLE 118 EUROPE PET FOAM MARKET BY RAW MATERIAL (TONS), 2020-2029
TABLE 119 EUROPE PET FOAM MARKET BY GRADE (USD MILLION), 2020-2029
TABLE 120 EUROPE PET FOAM MARKET BY GRADE (TONS), 2020-2029
TABLE 121 EUROPE PET FOAM MARKET BY APPLICATION (USD MILLION), 2020-2029
TABLE 122 EUROPE PET FOAM MARKET BY APPLICATION (TONS), 2020-2029
TABLE 123 EUROPE PET FOAM MARKET BY COUNTRY (USD MILLION), 2020-2029
TABLE 124 EUROPE PET FOAM MARKET BY COUNTRY (TONS), 2020-2029
TABLE 125 GERMANY PET FOAM MARKET BY RAW MATERIAL (USD MILLION), 2020-2029
TABLE 126 GERMANY PET FOAM MARKET BY RAW MATERIAL (TONS), 2020-2029
TABLE 127 GERMANY PET FOAM MARKET BY GRADE (USD MILLION), 2020-2029
TABLE 128 GERMANY PET FOAM MARKET BY GRADE (TONS), 2020-2029
TABLE 129 GERMANY PET FOAM MARKET BY APPLICATION (USD MILLION), 2020-2029
TABLE 130 GERMANY PET FOAM MARKET BY APPLICATION (TONS), 2020-2029
TABLE 131 UK PET FOAM MARKET BY RAW MATERIAL (USD MILLION), 2020-2029
TABLE 132 UK PET FOAM MARKET BY RAW MATERIAL (TONS), 2020-2029
TABLE 133 UK PET FOAM MARKET BY GRADE (USD MILLION), 2020-2029
TABLE 134 UK PET FOAM MARKET BY GRADE (TONS), 2020-2029
TABLE 135 UK PET FOAM MARKET BY APPLICATION (USD MILLION), 2020-2029
TABLE 136 UK PET FOAM MARKET BY APPLICATION (USD MILLION), 2020-2029
TABLE 137 FRANCE PET FOAM MARKET BY RAW MATERIAL (USD MILLION), 2020-2029
TABLE 138 FRANCE PET FOAM MARKET BY RAW MATERIAL (TONS), 2020-2029
TABLE 139 FRANCE PET FOAM MARKET BY GRADE (USD MILLION), 2020-2029
TABLE 140 FRANCE PET FOAM MARKET BY GRADE (TONS), 2020-2029
TABLE 141 FRANCE PET FOAM MARKET BY APPLICATION (USD MILLION), 2020-2029
TABLE 142 FRANCE PET FOAM MARKET BY APPLICATION (TONS), 2020-2029
TABLE 143 ITALY PET FOAM MARKET BY RAW MATERIAL (USD MILLION), 2020-2029
TABLE 144 ITALY PET FOAM MARKET BY RAW MATERIAL (TONS), 2020-2029
TABLE 145 ITALY PET FOAM MARKET BY GRADE (USD MILLION), 2020-2029
TABLE 146 ITALY PET FOAM MARKET BY GRADE (TONS), 2020-2029
TABLE 147 ITALY PET FOAM MARKET BY APPLICATION (USD MILLION), 2020-2029
TABLE 148 ITALY PET FOAM MARKET BY APPLICATION (TONS), 2020-2029
TABLE 149 SPAIN PET FOAM MARKET BY RAW MATERIAL (USD MILLION), 2020-2029
TABLE 150 SPAIN PET FOAM MARKET BY RAW MATERIAL (TONS), 2020-2029
TABLE 151 SPAIN PET FOAM MARKET BY GRADE (USD MILLION), 2020-2029
TABLE 152 SPAIN PET FOAM MARKET BY GRADE (TONS), 2020-2029
TABLE 153 SPAIN PET FOAM MARKET BY APPLICATION (USD MILLION), 2020-2029
TABLE 154 SPAIN PET FOAM MARKET BY APPLICATION (TONS), 2020-2029
TABLE 155 RUSSIA PET FOAM MARKET BY RAW MATERIAL (USD MILLION), 2020-2029
TABLE 156 RUSSIA PET FOAM MARKET BY RAW MATERIAL (TONS), 2020-2029
TABLE 157 RUSSIA PET FOAM MARKET BY GRADE (USD MILLION), 2020-2029
TABLE 158 RUSSIA PET FOAM MARKET BY GRADE (TONS), 2020-2029
TABLE 159 RUSSIA PET FOAM MARKET BY APPLICATION (USD MILLION), 2020-2029
TABLE 160 RUSSIA PET FOAM MARKET BY APPLICATION (TONS), 2020-2029
TABLE 161 REST OF EUROPE PET FOAM MARKET BY RAW MATERIAL (USD MILLION), 2020-2029
TABLE 162 REST OF EUROPE PET FOAM MARKET BY RAW MATERIAL (TONS), 2020-2029
TABLE 163 REST OF EUROPE PET FOAM MARKET BY GRADE (USD MILLION), 2020-2029
TABLE 164 REST OF EUROPE PET FOAM MARKET BY GRADE (TONS), 2020-2029
TABLE 165 REST OF EUROPE PET FOAM MARKET BY APPLICATIONN (USD MILLION), 2020-2029
TABLE 166 REST OF EUROPE PET FOAM MARKET BY APPLICATIONN (TONS), 2020-2029
TABLE 167 MIDDLE EAST AND AFRICA PET FOAM MARKET BY RAW MATERIAL (USD MILLION), 2020-2029
TABLE 168 MIDDLE EAST AND AFRICA PET FOAM MARKET BY RAW MATERIAL (TONS), 2020-2029
TABLE 169 MIDDLE EAST AND AFRICA PET FOAM MARKET BY GRADE (USD MILLION), 2020-2029
TABLE 170 MIDDLE EAST AND AFRICA PET FOAM MARKET BY GRADE (TONS), 2020-2029
TABLE 171 MIDDLE EAST AND AFRICA PET FOAM MARKET BY APPLICATION (USD MILLION), 2020-2029
TABLE 172 MIDDLE EAST AND AFRICA PET FOAM MARKET BY APPLICATION (TONS), 2020-2029
TABLE 173 MIDDLE EAST AND AFRICA PET FOAM MARKET BY COUNTRY (USD MILLION), 2020-2029
TABLE 174 MIDDLE EAST AND AFRICA PET FOAM MARKET BY COUNTRY (TONS), 2020-2029
TABLE 175 UAE PET FOAM MARKET BY RAW MATERIAL (USD MILLION), 2020-2029
TABLE 176 UAE PET FOAM MARKET BY RAW MATERIAL (TONS), 2020-2029
TABLE 177 UAE PET FOAM MARKET BY GRADE (USD MILLION), 2020-2029
TABLE 178 UAE PET FOAM MARKET BY GRADE (TONS), 2020-2029
TABLE 179 UAE PET FOAM MARKET BY APPLICATION (USD MILLION), 2020-2029
TABLE 180 UAE PET FOAM MARKET BY APPLICATION (TONS), 2020-2029
TABLE 181 SAUDI ARABIA PET FOAM MARKET BY RAW MATERIAL (USD MILLION), 2020-2029
TABLE 182 SAUDI ARABIA PET FOAM MARKET BY RAW MATERIAL (TONS), 2020-2029
TABLE 183 SAUDI ARABIA PET FOAM MARKET BY GRADE (USD MILLION), 2020-2029
TABLE 184 SAUDI ARABIA PET FOAM MARKET BY GRADE (TONS), 2020-2029
TABLE 185 SAUDI ARABIA PET FOAM MARKET BY APPLICATION (USD MILLION), 2020-2029
TABLE 186 SAUDI ARABIA PET FOAM MARKET BY APPLICATION (TONS), 2020-2029
TABLE 187 SOUTH AFRICA PET FOAM MARKET BY RAW MATERIAL (USD MILLION), 2020-2029
TABLE 188 SOUTH AFRICA PET FOAM MARKET BY RAW MATERIAL (TONS), 2020-2029
TABLE 189 SOUTH AFRICA PET FOAM MARKET BY GRADE (USD MILLION), 2020-2029
TABLE 190 SOUTH AFRICA PET FOAM MARKET BY GRADE (TONS), 2020-2029
TABLE 191 SOUTH AFRICA PET FOAM MARKET BY APPLICATION (USD MILLION), 2020-2029
TABLE 192 SOUTH AFRICA PET FOAM MARKET BY APPLICATION (TONS), 2020-2029
TABLE 193 REST OF MIDDLE EAST AND AFRICA PET FOAM MARKET BY RAW MATERIAL (USD MILLION), 2020-2029
TABLE 194 REST OF MIDDLE EAST AND AFRICA PET FOAM MARKET BY RAW MATERIAL (TONS), 2020-2029
TABLE 195 REST OF MIDDLE EAST AND AFRICA PET FOAM MARKET BY GRADE (USD MILLION), 2020-2029
TABLE 196 REST OF MIDDLE EAST AND AFRICA PET FOAM MARKET BY GRADE (TONS), 2020-2029
TABLE 197 REST OF MIDDLE EAST AND AFRICA PET FOAM MARKET BY APPLICATION (USD MILLION), 2020-2029
TABLE 198 REST OF MIDDLE EAST AND AFRICA PET FOAM MARKET BY APPLICATION (TONS), 2020-2029
LIST OF FIGURES
FIGURE 1 MARKET DYNAMICS
FIGURE 2 MARKET SEGMENTATION
FIGURE 3 REPORT TIMELINES: YEARS CONSIDERED
FIGURE 4 DATA TRIANGULATION
FIGURE 5 BOTTOM-UP APPROACH
FIGURE 6 TOP-DOWN APPROACH
FIGURE 7 RESEARCH FLOW
FIGURE 8 GLOBAL PET FOAM MARKET BY RAW MATERIAL, USD MILLION, 2020-2029
FIGURE 9 GLOBAL PET FOAM MARKET BY GRADE, USD MILLION, 2020-2029
FIGURE 10 GLOBAL PET FOAM MARKET BY APPLICATION, USD MILLION, 2021
FIGURE 11 GLOBAL PET FOAM MARKET BY REGION, USD MILLION, 2020-2029
FIGURE 12 PORTER’S FIVE FORCES MODEL
FIGURE 13 GLOBAL PET FOAM MARKET BY RAW MATERIAL, USD MILLION, 2021
FIGURE 14 GLOBAL PET FOAM MARKET BY GRADE, USD MILLION, 2021
FIGURE 15 GLOBAL PET FOAM MARKET BY APPLICATION, USD MILLION, 2021
FIGURE 16 GLOBAL PET FOAM MARKET BY REGION, USD MILLION, 2021
FIGURE 17 MARKET SHARE ANALYSIS
FIGURE 18 ARMACELL INTERNATIONAL S.A.: COMPANY SNAPSHOT
FIGURE 19 3A COMPOSITES: COMPANY SNAPSHOT
FIGURE 20 GURIT HOLDING AG: COMPANY SNAPSHOT
FIGURE 21 DIAB GROUP: COMPANY SNAPSHOT
FIGURE 22 BASF SE: COMPANY SNAPSHOT
FIGURE 23 SEKISUI PLASTICS CO. LTD.: COMPANY SNAPSHOT
FIGURE 24 HUNTSMAN INTERNATIONAL LLC: COMPANY SNAPSHOT
FIGURE 25 CORELITE INC.: COMPANY SNAPSHOT
FIGURE 26 CHANGZHOU TIANSHENG NEW MATERIALS CO. LTD.: COMPANY SNAPSHOT
FIGURE 27 CARBON-CORE CORPORATION: COMPANY SNAPSHOT
DOWNLOAD FREE SAMPLE REPORT
License Type
SPEAK WITH OUR ANALYST
Want to know more about the report or any specific requirement?
WANT TO CUSTOMIZE THE REPORT?
Our Clients Speak
We asked them to research ‘ Equipment market’ all over the world, and their whole arrangement was helpful to us. thehealthanalytics.com insightful analysis and reports contributed to our current analysis and in creating a future strategy. Besides, the te
Yosuke Mitsui
Senior Associate Construction Equipment Sales & Marketing
We asked them to research ‘Equipment market’ all over the world, and their whole arrangement was helpful to us. thehealthanalytics.com insightful analysis and reports contributed to our current analysis and in creating a future strategy. Besides, the te


