

Base Year Value ()
x.x %
x.x %
CAGR ()
x.x %
x.x %
Forecast Year Value ()
x.x %
x.x %
Historical Data Period
Largest Region
Forecast Period
Global High Performance Foam Market by Type (Silicone, Polyurethane, Polyamide, Polyethylene), by End-User Industry (Construction, Transportation, Electrical and Electronics, Packaging, Healthcare) and by Region, Global Trends and Forecast from 2022 to 2029.
Instant access to hundreds of data points and trends
- Market estimates from 2014-2029
- Competitive analysis, industry segmentation, financial benchmarks
- Incorporates SWOT, Porter's Five Forces and risk management frameworks
- PDF report or online database with Word, Excel and PowerPoint export options
- 100% money back guarantee
High Performance Foam Market Overview
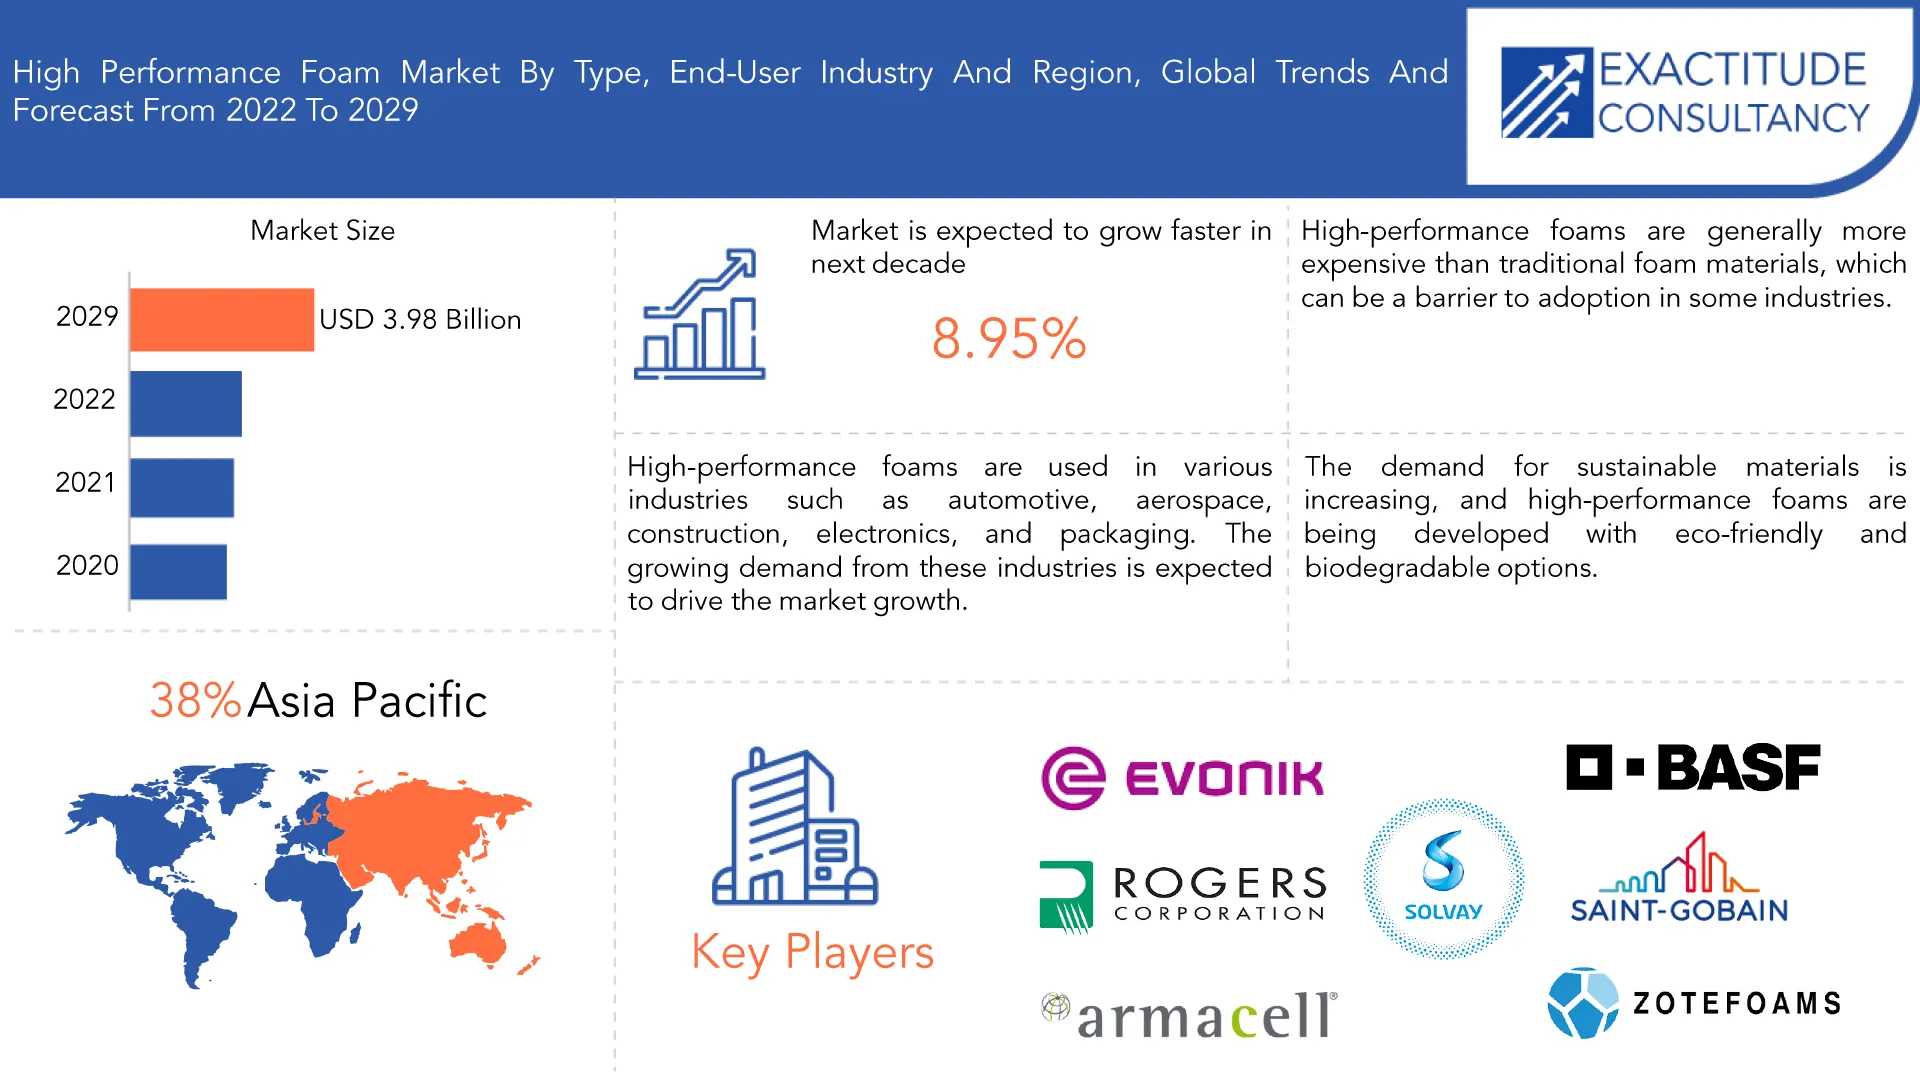
The global high performance foam market size is expected to grow at more than 8.95% CAGR from 2021 to 2029. It is expected to reach above USD 3.98 billion by 2029 from a little above USD 1.84 billion in 2020.
High performance foam has a few special qualities, like good recoverability from repeated shocks and deformations and the capacity to maintain dimensional stability despite being exposed to stress, impact, and extreme temperatures. Due to these physical qualities, high performance foam is becoming more and more in demand and is being used in a variety of industries.
High-performance foams are used in various industries such as automotive, aerospace, construction, electronics, and packaging. The growing demand from these industries is expected to drive the market growth. High-performance foams offer lightweight and high-strength properties, which make them suitable for use in various applications such as cushioning, insulation, and packaging. Technological advancements in the manufacturing processes of high-performance foams have led to the development of improved products with better properties such as enhanced thermal insulation, fire resistance, and acoustic insulation. Governments across the globe have implemented strict regulations for energy efficiency and environmental protection. High-performance foams are an effective solution to meet these regulations as they offer superior insulation and reduce energy consumption. The growing end-use industries in emerging economies such as China, India, and Brazil are expected to drive the demand for high-performance foams. These economies are investing heavily in infrastructure development, which is expected to boost the demand for high-performance foams in the construction industry.
| ATTRIBUTE | DETAILS |
| Study period | 2020-2029 |
| Base year | 2021 |
| Estimated year | 2022 |
| Forecasted year | 2022-2029 |
| Historical period | 2018-2020 |
| Unit | Value (USD Billion), (Kilotons) |
| Segmentation | By Type, By End-User Industry, By Region |
| By Type |
|
| By End-User Industry |
|
| By Region |
|
High-performance foams are generally more expensive than traditional foam materials, which can be a barrier to adoption in some industries. Some high-performance foams contain chemicals that may have negative environmental impacts, which can lead to increased regulation and a decline in demand. High-performance foams can be difficult to recycle, which can lead to waste management issues and environmental concerns.
The demand for sustainable materials is increasing, and high-performance foams are being developed with eco-friendly and biodegradable options. High-performance foams are used in medical devices and equipment, and the growing healthcare industry is expected to increase the demand for these foams. High-performance foams are used in the automotive industry for weight reduction, safety, and comfort. The growing demand for lightweight and fuel-efficient vehicles is expected to increase the demand for these foams. The high-performance foam market is highly competitive, and companies are investing in R&D to develop new products with better properties and reduce the production costs. Nanotechnology is being used to improve the properties of high-performance foams, which can lead to the development of new products and applications.
The pandemic resulted in disruptions to the global supply chain, affecting the availability of raw materials, transportation, and logistics. This led to price fluctuations and delays in delivery, which impacted the production and sales of high-performance foam products. The demand for high-performance foam products varied across industries during the pandemic. For instance, the automotive industry witnessed a decline in demand due to factory closures and reduced consumer spending. In contrast, the healthcare industry witnessed an increase in demand for medical equipment and devices that use high-performance foam materials, such as respirators and face shields. Looking ahead, the high-performance foam market is expected to continue its growth trajectory in the post-pandemic world. The market is likely to benefit from the increasing demand for lightweight and energy-efficient materials, as well as the growing trend towards sustainability and eco-friendliness.
[caption id="attachment_23958" align="aligncenter" width="1920"]
Frequently Asked Questions
• Who are the key players in the global high performance foam market?
Some key players operating in the global high performance foam market include 3M, Evonik Industries AG, Rogers Corporation, BASF SE, DuPont, Sekisui Alveo, Armacell, SABIC, Saint-Gobain, Zotefoams Plc, Solvay.
• What are the factors driving the global high performance foam market?
High-performance foams are used in various industries such as automotive, aerospace, construction, electronics, and packaging. The growing demand from these industries is expected to drive the market growth.
• How big is the global high performance foam market?
The global high performance foam market size was estimated at USD 2 billion in 2021 and is expected to reach USD 3.98 billion in 2029.
• What is the global high performance foam market growth?
The global high performance foam market is expected to grow at a compound annual growth rate of 8.95% from 2022 to 2029 to reach USD 3.98 billion by 2029.
• Which region accounted for the largest global high performance foam market share?
The Asia Pacific dominated the global high performance foam market with a share of 38% in 2021.
Global High Performance Foam Market Segment Analysis
Based on type, market is segmented into silicone, polyurethane, polyamide, polyethylene. Polyurethane foam is a widely used type of high-performance foam that offers excellent cushioning and insulation properties. PU foam is used in a wide range of applications, including automotive, construction, and furniture. Polyethylene foam is another popular type of high-performance foam that offers good insulation and cushioning properties. PE foam is widely used in packaging, construction, and sports and leisure applications. Polystyrene foam is a lightweight and rigid foam that is commonly used in insulation and packaging applications. PS foam is widely used in the construction and packaging industries.
Based on end-user industry, market is segmented into construction, automotive, electrical and electronics, packaging, healthcare. Automotive and construction industry is expected to account for largest share as both of these industries use high performance foam for insulation applications. High-performance foams are widely used in the automotive industry for various applications such as seating, cushioning, and insulation. High-temperature foams stop heat from entering the vehicle as well as from departing, hence reducing the need for further energy usage. High performance foams also prevent moisture from penetrating the material, ensuring long-term corrosion protection. The growing demand for lightweight and fuel-efficient vehicles is driving the demand for high-performance foam products in the automotive industry. High-performance foams are used in the construction industry for insulation, sealing, and cushioning applications. The increasing focus on energy-efficient buildings and sustainable construction practices is driving the demand for high-performance foam products in the construction industry.
[caption id="attachment_23971" align="aligncenter" width="1920"]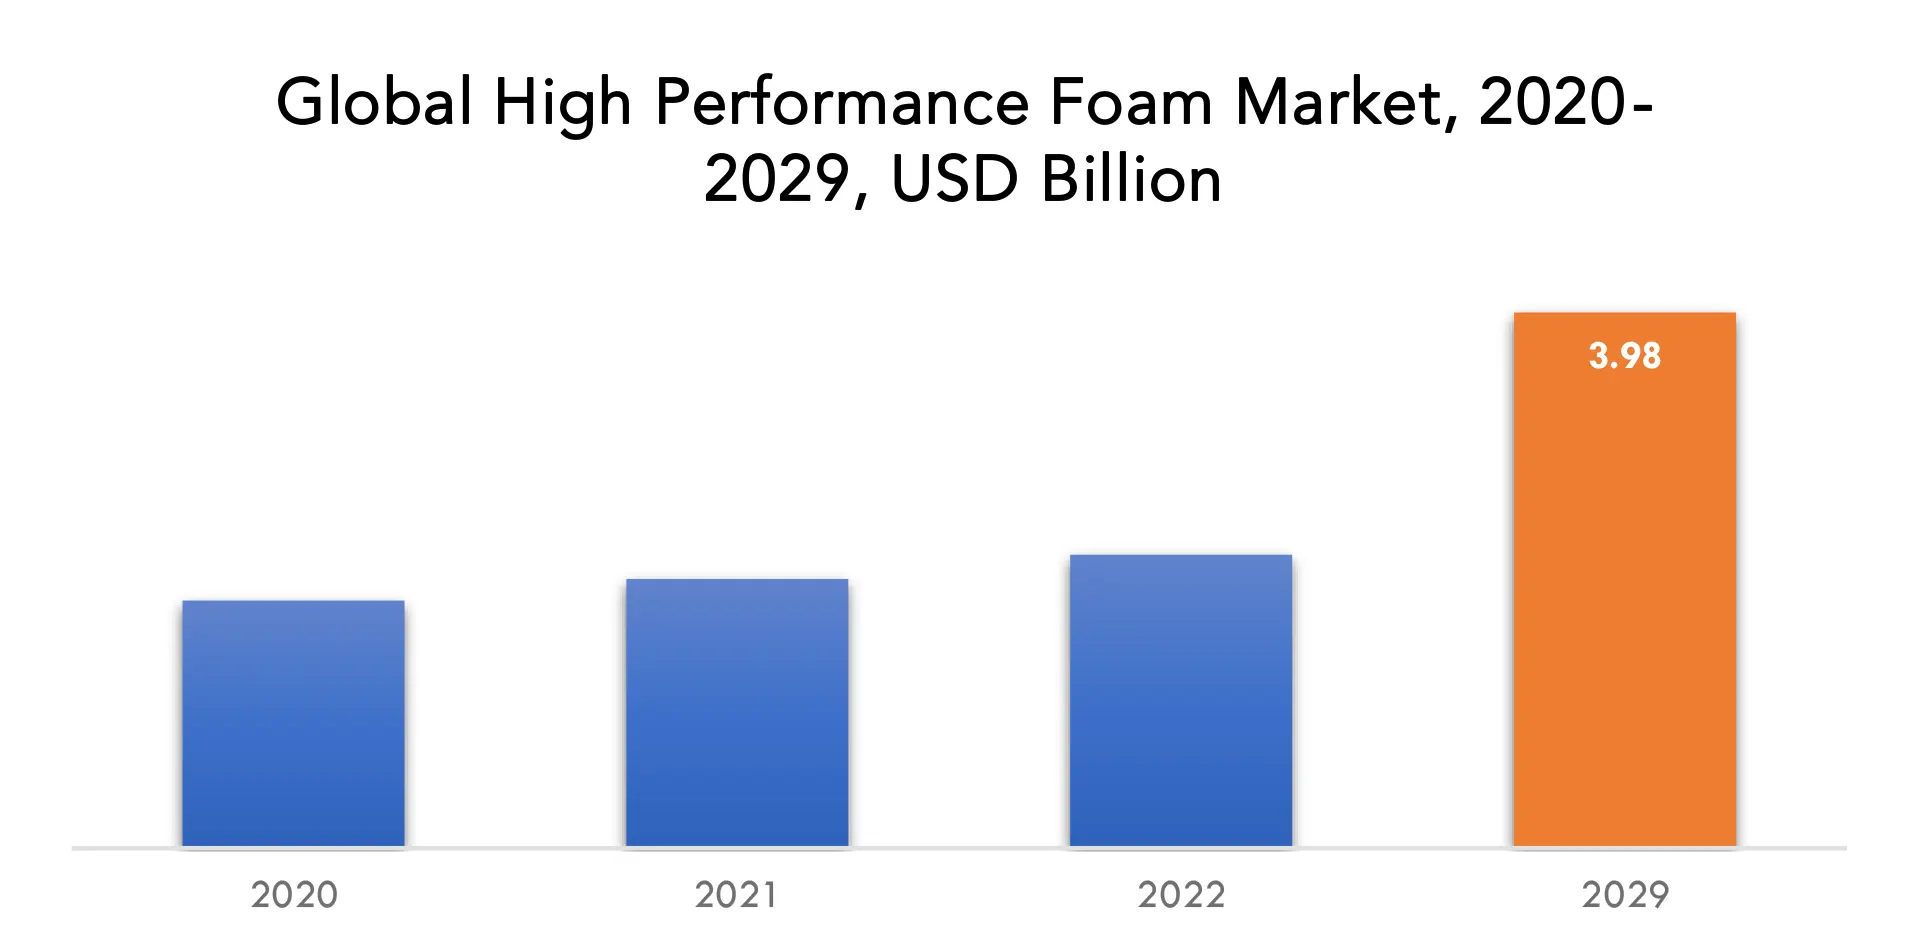
Global High Performance Foam Market Players
Key competitors from both domestic and international markets compete fiercely in the worldwide global high performance foam industry are 3M, Evonik Industries AG, Rogers Corporation, BASF SE, DuPont, Sekisui Alveo, Armacell, SABIC, Saint-Gobain, Zotefoams Plc, Solvay. Recent News:- 15th March 2023: Evonik and Chemours teamed up to provide high-performance, low GWP solutions for spray polyurethane foam industry.
- 9th November 2022: Zotefoams acquired assets and intellectual property of Refour ApS.
Who Should Buy? Or Key stakeholders
- Global High Performance Foam Manufacturers
- Raw Material Providers
- Investors
- Regulatory Authorities
- High Performance Foam Vendors
- Research and Development Organizations
- Automotive Organizations
- Construction Industry
- Others
High Performance Foam Market Regional Analysis
The global high performance foam market by region includes North America, Asia-Pacific (APAC), Europe, South America, and Middle East & Africa (MEA).
- North America: includes the US, Canada, Mexico
- Asia Pacific: includes China, Japan, South Korea, India, Australia, ASEAN and Rest of APAC
- Europe: includes UK, Germany, France, Italy, Spain, Russia, and Rest of Europe
- South America: includes Brazil, Argentina and Rest of South America
- Middle East & Africa: includes Turkey, UAE, Saudi Arabia, South Africa, and Rest of MEA
Geographically, the market is anticipated to be dominated by the Asia-Pacific region, with China leading the way in terms of GDP as the largest economy in the region. China has emerged as one of the world's largest manufacturing hubs, with its fast-growing economy and significant contributions from its manufacturing sector. India, China, and other nations are anticipated to dominate the Asia-Pacific high performance foam market. Although the market for high performance foam is now relatively small in the rest of the world, it is predicted to develop significantly over the coming years. Also, due to growing population and urbanization, automotive and construction industry is rapidly increasing in emerging countries of Asia Pacific like India and China which is creating lucrative opportunities for the high performance foam market in forecasted period.
[caption id="attachment_23980" align="aligncenter" width="1920"]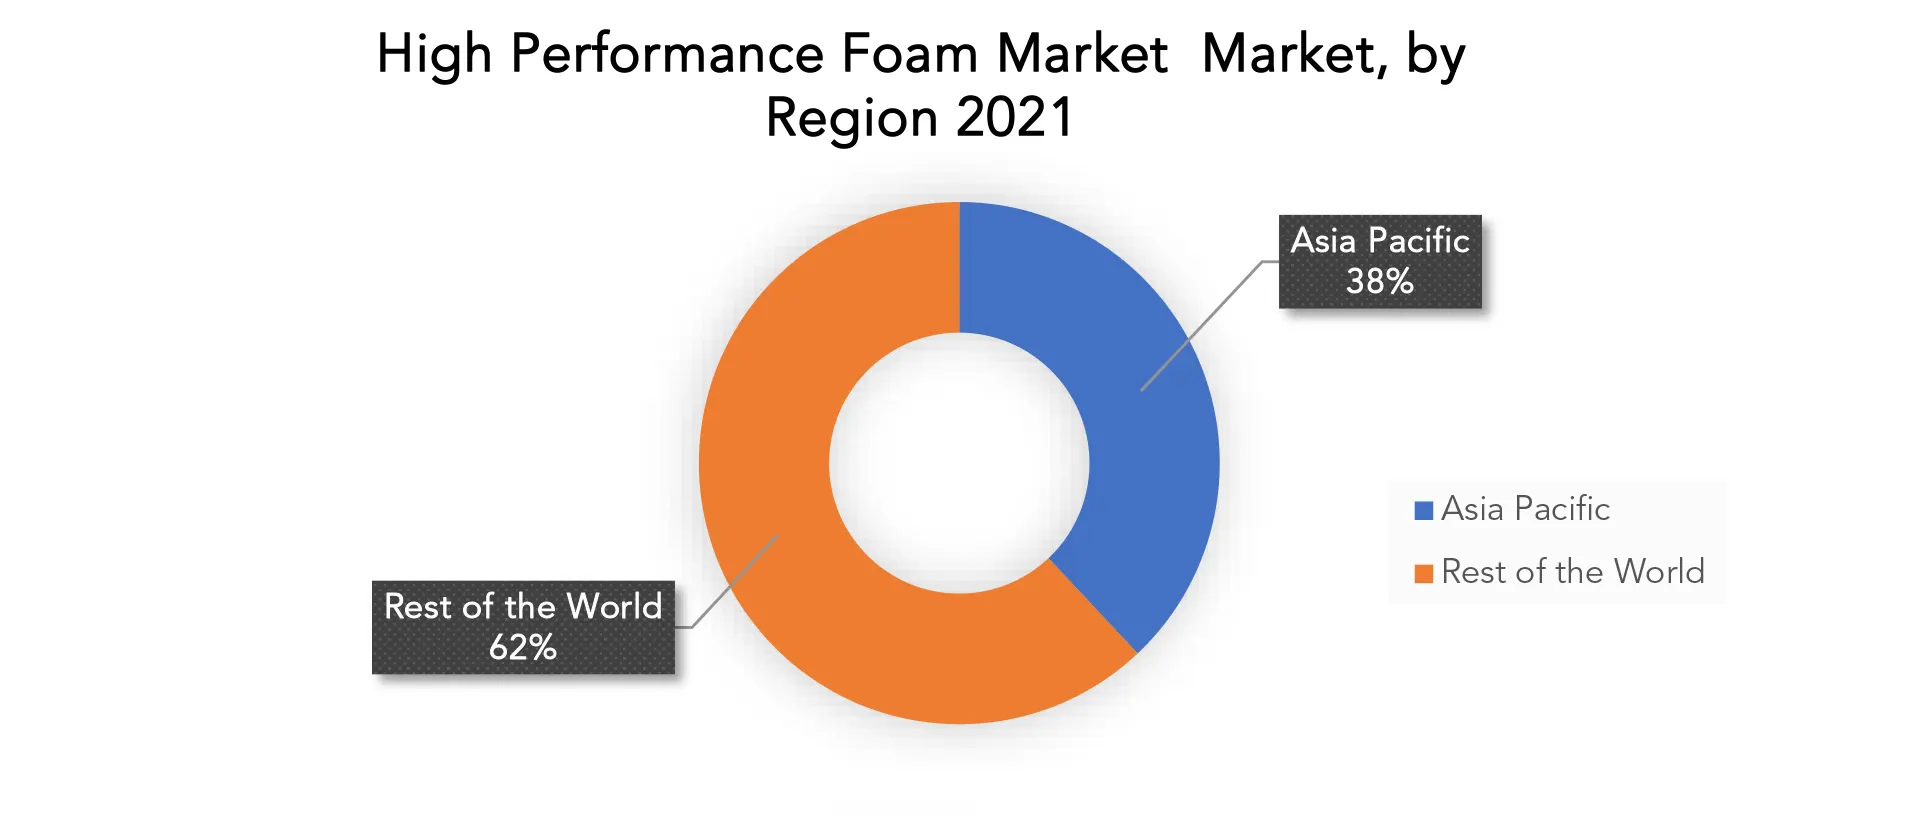
Key Market Segments: Global High Performance Foam Market
Global High Performance Foam Market By Type, 2020-2029, (USD Billion), (Kilotons)- Silicone
- Polyurethane
- Polyamide
- Polyethylene
- Construction
- Transportation
- Electrical And Electronics
- Packaging
- Healthcare
- North America
- Europe
- Asia Pacific
- South America
- Middle East And Africa
Exactitude Consultancy Services Key Objectives
- Increasing sales and market share
- Developing new technology
- Improving profitability
- Entering new markets
- Enhancing brand reputation
Key Question Answered
- What is the expected growth rate of the high performance foam market over the next 7 years?
- Who are the major players in the high performance foam market and what is their market share?
- What are the end-user industries driving demand for market and what is their outlook?
- What are the opportunities for growth in emerging markets such as Asia-Pacific, Middle East, and Africa?
- How is the economic environment affecting the high performance foam market, including factors such as interest rates, inflation, and exchange rates?
- What is the expected impact of government policies and regulations on the high performance foam market?
- What is the current and forecasted size and growth rate of the global high performance foam market?
- What are the key drivers of growth in the high performance foam market?
- What are the distribution channels and supply chain dynamics in the high performance foam market?
- What are the technological advancements and innovations in the high performance foam market and their impact on product development and growth?
- What are the regulatory considerations and their impact on the market?
- What are the challenges faced by players in the high performance foam market and how are they addressing these challenges?
- What are the opportunities for growth and expansion in the high performance foam market?
- What are the product offerings and specifications of leading players in the market?
- What is the pricing trend of high performance foam in the market and what is the impact of raw material prices on the price trend?
- INTRODUCTION
- MARKET DEFINITION
- MARKET SEGMENTATION
- RESEARCH TIMELINES
- ASSUMPTIONS AND LIMITATIONS
- RESEARCH METHODOLOGY
- DATA MINING
- SECONDARY RESEARCH
- PRIMARY RESEARCH
- SUBJECT-MATTER EXPERTS’ ADVICE
- QUALITY CHECKS
- FINAL REVIEW
- DATA TRIANGULATION
- BOTTOM-UP APPROACH
- TOP-DOWN APPROACH
- RESEARCH FLOW
- DATA SOURCES
- DATA MINING
- EXECUTIVE SUMMARY
- MARKET OVERVIEW
- GLOBAL HIGH PERFORMANCE FOAM MARKET OUTLOOK
- MARKET DRIVERS
- MARKET RESTRAINTS
- MARKET OPPORTUNITIES
- IMPACT OF COVID-19 ON GLOBAL HIGH PERFORMANCE FOAM MARKET
- PORTER’S FIVE FORCES MODEL
- THREAT FROM NEW ENTRANTS
- THREAT FROM SUBSTITUTES
- BARGAINING POWER OF SUPPLIERS
- BARGAINING POWER OF CUSTOMERS
- DEGREE OF COMPETITION
- INDUSTRY VALUE CHAIN ANALYSIS
- GLOBAL HIGH PERFORMANCE FOAM MARKET OUTLOOK
- GLOBAL HIGH PERFORMANCE FOAM MARKET BY TYPE, 2020-2029, (USD BILLION), (KILOTONS)
- SILICONE
- POLYURETHANE
- POLYAMIDE
- POLYETHYLENE
- GLOBAL HIGH PERFORMANCE FOAM MARKET BY END-USER INDUSTRY, 2020-2029, (USD BILLION), (KILOTONS)
- CONSTRUCTION
- AUTOMOTIVE
- ELECTRICAL AND ELECTRONICS
- PACKAGING
- HEALTHCARE
- GLOBAL HIGH PERFORMANCE FOAM MARKET BY REGION, 2020-2029, (USD BILLION), (KILOTONS)
- NORTH AMERICA
- US
- CANADA
- MEXICO
- SOUTH AMERICA
- BRAZIL
- ARGENTINA
- COLOMBIA
- REST OF SOUTH AMERICA
- EUROPE
- GERMANY
- UK
- FRANCE
- ITALY
- SPAIN
- RUSSIA
- REST OF EUROPE
- ASIA PACIFIC
- INDIA
- CHINA
- JAPAN
- SOUTH KOREA
- AUSTRALIA
- SOUTH-EAST ASIA
- REST OF ASIA PACIFIC
- MIDDLE EAST AND AFRICA
- UAE
- SAUDI ARABIA
- SOUTH AFRICA
- REST OF MIDDLE EAST AND AFRICA
- NORTH AMERICA
- COMPANY PROFILES* (BUSINESS OVERVIEW, COMPANY SNAPSHOT, PRODUCTS OFFERED, RECENT DEVELOPMENTS)
- 3M
- EVONIK INDUSTRIES AG
- ROGERS CORPORATION
- BASF SE
- DUPONT
- SEKISUI ALVEO
- ARMACELL
- SABIC
- SAINT-GOBAIN
- ZOTEFOAMS PLC
- SOLVAY *THE COMPANY LIST IS INDICATIVE
LIST OF TABLES
TABLE 1 GLOBAL HIGH PERFORMANCE FOAM MARKET BY TYPE (USD BILLION) 2020-2029
TABLE 2 GLOBAL HIGH PERFORMANCE FOAM MARKET BY TYPE (KILOTONS) 2020-2029
TABLE 3 GLOBAL HIGH PERFORMANCE FOAM MARKET BY END-USER INDUSTRY (USD BILLION) 2020-2029
TABLE 4 GLOBAL HIGH PERFORMANCE FOAM MARKET BY END-USER INDUSTRY (KILOTONS) 2020-2029
TABLE 5 GLOBAL HIGH PERFORMANCE FOAM MARKET BY REGION (USD BILLION) 2020-2029
TABLE 6 GLOBAL HIGH PERFORMANCE FOAM MARKET BY REGION (KILOTONS) 2020-2029
TABLE 7 NORTH AMERICA HIGH PERFORMANCE FOAM MARKET BY COUNTRY (USD BILLION) 2020-2029
TABLE 8 NORTH AMERICA HIGH PERFORMANCE FOAM MARKET BY COUNTRY (KILOTONS) 2020-2029
TABLE 9 NORTH AMERICA HIGH PERFORMANCE FOAM MARKET BY TYPE (USD BILLION) 2020-2029
TABLE 10 NORTH AMERICA HIGH PERFORMANCE FOAM MARKET BY TYPE (KILOTONS) 2020-2029
TABLE 11 NORTH AMERICA HIGH PERFORMANCE FOAM MARKET BY END-USER INDUSTRY (USD BILLION) 2020-2029
TABLE 12 NORTH AMERICA HIGH PERFORMANCE FOAM MARKET BY END-USER INDUSTRY (KILOTONS) 2020-2029
TABLE 13 US HIGH PERFORMANCE FOAM MARKET BY TYPE (USD BILLION) 2020-2029
TABLE 14 US HIGH PERFORMANCE FOAM MARKET BY TYPE (KILOTONS) 2020-2029
TABLE 15 US HIGH PERFORMANCE FOAM MARKET BY END-USER INDUSTRY (USD BILLION) 2020-2029
TABLE 16 US HIGH PERFORMANCE FOAM MARKET BY END-USER INDUSTRY (KILOTONS) 2020-2029
TABLE 17 CANADA HIGH PERFORMANCE FOAM MARKET BY TYPE (USD BILLION) 2020-2029
TABLE 18 CANADA HIGH PERFORMANCE FOAM MARKET BY TYPE (KILOTONS) 2020-2029
TABLE 19 CANADA HIGH PERFORMANCE FOAM MARKET BY END-USER INDUSTRY (USD BILLION) 2020-2029
TABLE 20 CANADA HIGH PERFORMANCE FOAM MARKET BY END-USER INDUSTRY (KILOTONS) 2020-2029
TABLE 21 MEXICO HIGH PERFORMANCE FOAM MARKET BY TYPE (USD BILLION) 2020-2029
TABLE 22 MEXICO HIGH PERFORMANCE FOAM MARKET BY TYPE (KILOTONS) 2020-2029
TABLE 23 MEXICO HIGH PERFORMANCE FOAM MARKET BY END-USER INDUSTRY (USD BILLION) 2020-2029
TABLE 24 MEXICO HIGH PERFORMANCE FOAM MARKET BY END-USER INDUSTRY (KILOTONS) 2020-2029
TABLE 25 SOUTH AMERICA HIGH PERFORMANCE FOAM MARKET BY COUNTRY (USD BILLION) 2020-2029
TABLE 26 SOUTH AMERICA HIGH PERFORMANCE FOAM MARKET BY COUNTRY (KILOTONS) 2020-2029
TABLE 27 SOUTH AMERICA HIGH PERFORMANCE FOAM MARKET BY TYPE (USD BILLION) 2020-2029
TABLE 28 SOUTH AMERICA HIGH PERFORMANCE FOAM MARKET BY TYPE (KILOTONS) 2020-2029
TABLE 29 SOUTH AMERICA HIGH PERFORMANCE FOAM MARKET BY END-USER INDUSTRY (USD BILLION) 2020-2029
TABLE 30 SOUTH AMERICA HIGH PERFORMANCE FOAM MARKET BY END-USER INDUSTRY (KILOTONS) 2020-2029
TABLE 31 BRAZIL HIGH PERFORMANCE FOAM MARKET BY TYPE (USD BILLION) 2020-2029
TABLE 32 BRAZIL HIGH PERFORMANCE FOAM MARKET BY TYPE (KILOTONS) 2020-2029
TABLE 33 BRAZIL HIGH PERFORMANCE FOAM MARKET BY END-USER INDUSTRY (USD BILLION) 2020-2029
TABLE 34 BRAZIL HIGH PERFORMANCE FOAM MARKET BY END-USER INDUSTRY (KILOTONS) 2020-2029
TABLE 35 ARGENTINA HIGH PERFORMANCE FOAM MARKET BY TYPE (USD BILLION) 2020-2029
TABLE 36 ARGENTINA HIGH PERFORMANCE FOAM MARKET BY TYPE (KILOTONS) 2020-2029
TABLE 37 ARGENTINA HIGH PERFORMANCE FOAM MARKET BY END-USER INDUSTRY (USD BILLION) 2020-2029
TABLE 38 ARGENTINA HIGH PERFORMANCE FOAM MARKET BY END-USER INDUSTRY (KILOTONS) 2020-2029
TABLE 39 COLOMBIA HIGH PERFORMANCE FOAM MARKET BY TYPE (USD BILLION) 2020-2029
TABLE 40 COLOMBIA HIGH PERFORMANCE FOAM MARKET BY TYPE (KILOTONS) 2020-2029
TABLE 41 COLOMBIA HIGH PERFORMANCE FOAM MARKET BY END-USER INDUSTRY (USD BILLION) 2020-2029
TABLE 42 COLOMBIA HIGH PERFORMANCE FOAM MARKET BY END-USER INDUSTRY (KILOTONS) 2020-2029
TABLE 43 REST OF SOUTH AMERICA HIGH PERFORMANCE FOAM MARKET BY TYPE (USD BILLION) 2020-2029
TABLE 44 REST OF SOUTH AMERICA HIGH PERFORMANCE FOAM MARKET BY TYPE (KILOTONS) 2020-2029
TABLE 45 REST OF SOUTH AMERICA HIGH PERFORMANCE FOAM MARKET BY END-USER INDUSTRY (USD BILLION) 2020-2029
TABLE 46 REST OF SOUTH AMERICA HIGH PERFORMANCE FOAM MARKET BY END-USER INDUSTRY (KILOTONS) 2020-2029
TABLE 47 ASIA-PACIFIC HIGH PERFORMANCE FOAM MARKET BY COUNTRY (USD BILLION) 2020-2029
TABLE 48 ASIA-PACIFIC HIGH PERFORMANCE FOAM MARKET BY COUNTRY (KILOTONS) 2020-2029
TABLE 49 ASIA-PACIFIC HIGH PERFORMANCE FOAM MARKET BY TYPE (USD BILLION) 2020-2029
TABLE 50 ASIA-PACIFIC HIGH PERFORMANCE FOAM MARKET BY TYPE (KILOTONS) 2020-2029
TABLE 51 ASIA-PACIFIC HIGH PERFORMANCE FOAM MARKET BY END-USER INDUSTRY (USD BILLION) 2020-2029
TABLE 52 ASIA-PACIFIC HIGH PERFORMANCE FOAM MARKET BY END-USER INDUSTRY (KILOTONS) 2020-2029
TABLE 53 INDIA HIGH PERFORMANCE FOAM MARKET BY TYPE (USD BILLION) 2020-2029
TABLE 54 INDIA HIGH PERFORMANCE FOAM MARKET BY TYPE (KILOTONS) 2020-2029
TABLE 55 INDIA HIGH PERFORMANCE FOAM MARKET BY END-USER INDUSTRY (USD BILLION) 2020-2029
TABLE 56 INDIA HIGH PERFORMANCE FOAM MARKET BY END-USER INDUSTRY (KILOTONS) 2020-2029
TABLE 57 CHINA HIGH PERFORMANCE FOAM MARKET BY TYPE (USD BILLION) 2020-2029
TABLE 58 CHINA HIGH PERFORMANCE FOAM MARKET BY TYPE (KILOTONS) 2020-2029
TABLE 59 CHINA HIGH PERFORMANCE FOAM MARKET BY END-USER INDUSTRY (USD BILLION) 2020-2029
TABLE 60 CHINA HIGH PERFORMANCE FOAM MARKET BY END-USER INDUSTRY (KILOTONS) 2020-2029
TABLE 61 JAPAN HIGH PERFORMANCE FOAM MARKET BY TYPE (USD BILLION) 2020-2029
TABLE 62 JAPAN HIGH PERFORMANCE FOAM MARKET BY TYPE (KILOTONS) 2020-2029
TABLE 63 JAPAN HIGH PERFORMANCE FOAM MARKET BY END-USER INDUSTRY (USD BILLION) 2020-2029
TABLE 64 JAPAN HIGH PERFORMANCE FOAM MARKET BY END-USER INDUSTRY (KILOTONS) 2020-2029
TABLE 65 SOUTH KOREA HIGH PERFORMANCE FOAM MARKET BY TYPE (USD BILLION) 2020-2029
TABLE 66 SOUTH KOREA HIGH PERFORMANCE FOAM MARKET BY TYPE (KILOTONS) 2020-2029
TABLE 67 SOUTH KOREA HIGH PERFORMANCE FOAM MARKET BY END-USER INDUSTRY (USD BILLION) 2020-2029
TABLE 68 SOUTH KOREA HIGH PERFORMANCE FOAM MARKET BY END-USER INDUSTRY (KILOTONS) 2020-2029
TABLE 69 AUSTRALIA HIGH PERFORMANCE FOAM MARKET BY TYPE (USD BILLION) 2020-2029
TABLE 70 AUSTRALIA HIGH PERFORMANCE FOAM MARKET BY TYPE (KILOTONS) 2020-2029
TABLE 71 AUSTRALIA HIGH PERFORMANCE FOAM MARKET BY END-USER INDUSTRY (USD BILLION) 2020-2029
TABLE 72 AUSTRALIA HIGH PERFORMANCE FOAM MARKET BY END-USER INDUSTRY (KILOTONS) 2020-2029
TABLE 73 SOUTH-EAST ASIA HIGH PERFORMANCE FOAM MARKET BY TYPE (USD BILLION) 2020-2029
TABLE 74 SOUTH-EAST ASIA HIGH PERFORMANCE FOAM MARKET BY TYPE (KILOTONS) 2020-2029
TABLE 75 SOUTH-EAST ASIA HIGH PERFORMANCE FOAM MARKET BY END-USER INDUSTRY (USD BILLION) 2020-2029
TABLE 76 SOUTH-EAST ASIA HIGH PERFORMANCE FOAM MARKET BY END-USER INDUSTRY (KILOTONS) 2020-2029
TABLE 77 REST OF ASIA PACIFIC HIGH PERFORMANCE FOAM MARKET BY TYPE (USD BILLION) 2020-2029
TABLE 78 REST OF ASIA PACIFIC HIGH PERFORMANCE FOAM MARKET BY TYPE (KILOTONS) 2020-2029
TABLE 79 REST OF ASIA PACIFIC HIGH PERFORMANCE FOAM MARKET BY END-USER INDUSTRY (USD BILLION) 2020-2029
TABLE 80 REST OF ASIA PACIFIC HIGH PERFORMANCE FOAM MARKET BY END-USER INDUSTRY (KILOTONS) 2020-2029
TABLE 81 EUROPE HIGH PERFORMANCE FOAM MARKET BY COUNTRY (USD BILLION) 2020-2029
TABLE 82 EUROPE HIGH PERFORMANCE FOAM MARKET BY COUNTRY (KILOTONS) 2020-2029
TABLE 83 EUROPE HIGH PERFORMANCE FOAM MARKET BY TYPE (USD BILLION) 2020-2029
TABLE 84 EUROPE HIGH PERFORMANCE FOAM MARKET BY TYPE (KILOTONS) 2020-2029
TABLE 85 EUROPE HIGH PERFORMANCE FOAM MARKET BY END-USER INDUSTRY (USD BILLION) 2020-2029
TABLE 86 EUROPE HIGH PERFORMANCE FOAM MARKET BY END-USER INDUSTRY (KILOTONS) 2020-2029
TABLE 87 GERMANY HIGH PERFORMANCE FOAM MARKET BY TYPE (USD BILLION) 2020-2029
TABLE 88 GERMANY HIGH PERFORMANCE FOAM MARKET BY TYPE (KILOTONS) 2020-2029
TABLE 89 GERMANY HIGH PERFORMANCE FOAM MARKET BY END-USER INDUSTRY (USD BILLION) 2020-2029
TABLE 90 GERMANY HIGH PERFORMANCE FOAM MARKET BY END-USER INDUSTRY (KILOTONS) 2020-2029
TABLE 91 UK HIGH PERFORMANCE FOAM MARKET BY TYPE (USD BILLION) 2020-2029
TABLE 92 UK HIGH PERFORMANCE FOAM MARKET BY TYPE (KILOTONS) 2020-2029
TABLE 93 UK HIGH PERFORMANCE FOAM MARKET BY END-USER INDUSTRY (USD BILLION) 2020-2029
TABLE 94 UK HIGH PERFORMANCE FOAM MARKET BY END-USER INDUSTRY (KILOTONS) 2020-2029
TABLE 95 FRANCE HIGH PERFORMANCE FOAM MARKET BY TYPE (USD BILLION) 2020-2029
TABLE 96 FRANCE HIGH PERFORMANCE FOAM MARKET BY TYPE (KILOTONS) 2020-2029
TABLE 97 FRANCE HIGH PERFORMANCE FOAM MARKET BY END-USER INDUSTRY (USD BILLION) 2020-2029
TABLE 98 FRANCE HIGH PERFORMANCE FOAM MARKET BY END-USER INDUSTRY (KILOTONS) 2020-2029
TABLE 99 ITALY HIGH PERFORMANCE FOAM MARKET BY TYPE (USD BILLION) 2020-2029
TABLE 100 ITALY HIGH PERFORMANCE FOAM MARKET BY TYPE (KILOTONS) 2020-2029
TABLE 101 ITALY HIGH PERFORMANCE FOAM MARKET BY END-USER INDUSTRY (USD BILLION) 2020-2029
TABLE 102 ITALY HIGH PERFORMANCE FOAM MARKET BY END-USER INDUSTRY (KILOTONS) 2020-2029
TABLE 103 SPAIN HIGH PERFORMANCE FOAM MARKET BY TYPE (USD BILLION) 2020-2029
TABLE 104 SPAIN HIGH PERFORMANCE FOAM MARKET BY TYPE (KILOTONS) 2020-2029
TABLE 105 SPAIN HIGH PERFORMANCE FOAM MARKET BY END-USER INDUSTRY (USD BILLION) 2020-2029
TABLE 106 SPAIN HIGH PERFORMANCE FOAM MARKET BY END-USER INDUSTRY (KILOTONS) 2020-2029
TABLE 107 RUSSIA HIGH PERFORMANCE FOAM MARKET BY TYPE (USD BILLION) 2020-2029
TABLE 108 RUSSIA HIGH PERFORMANCE FOAM MARKET BY TYPE (KILOTONS) 2020-2029
TABLE 109 RUSSIA HIGH PERFORMANCE FOAM MARKET BY END-USER INDUSTRY (USD BILLION) 2020-2029
TABLE 110 RUSSIA HIGH PERFORMANCE FOAM MARKET BY END-USER INDUSTRY (KILOTONS) 2020-2029
TABLE 111 REST OF EUROPE HIGH PERFORMANCE FOAM MARKET BY TYPE (USD BILLION) 2020-2029
TABLE 112 REST OF EUROPE HIGH PERFORMANCE FOAM MARKET BY TYPE (KILOTONS) 2020-2029
TABLE 113 REST OF EUROPE HIGH PERFORMANCE FOAM MARKET BY END-USER INDUSTRY (USD BILLION) 2020-2029
TABLE 114 REST OF EUROPE HIGH PERFORMANCE FOAM MARKET BY END-USER INDUSTRY (KILOTONS) 2020-2029
TABLE 115 MIDDLE EAST AND AFRICA HIGH PERFORMANCE FOAM MARKET BY COUNTRY (USD BILLION) 2020-2029
TABLE 116 MIDDLE EAST AND AFRICA HIGH PERFORMANCE FOAM MARKET BY COUNTRY (KILOTONS) 2020-2029
TABLE 117 MIDDLE EAST AND AFRICA HIGH PERFORMANCE FOAM MARKET BY TYPE (USD BILLION) 2020-2029
TABLE 118 MIDDLE EAST AND AFRICA HIGH PERFORMANCE FOAM MARKET BY TYPE (KILOTONS) 2020-2029
TABLE 119 MIDDLE EAST AND AFRICA HIGH PERFORMANCE FOAM MARKET BY END-USER INDUSTRY (USD BILLION) 2020-2029
TABLE 120 MIDDLE EAST AND AFRICA HIGH PERFORMANCE FOAM MARKET BY END-USER INDUSTRY (KILOTONS) 2020-2029
TABLE 121 UAE HIGH PERFORMANCE FOAM MARKET BY TYPE (USD BILLION) 2020-2029
TABLE 122 UAE HIGH PERFORMANCE FOAM MARKET BY TYPE (KILOTONS) 2020-2029
TABLE 123 UAE HIGH PERFORMANCE FOAM MARKET BY END-USER INDUSTRY (USD BILLION) 2020-2029
TABLE 124 UAE HIGH PERFORMANCE FOAM MARKET BY END-USER INDUSTRY (KILOTONS) 2020-2029
TABLE 125 SAUDI ARABIA HIGH PERFORMANCE FOAM MARKET BY TYPE (USD BILLION) 2020-2029
TABLE 126 SAUDI ARABIA HIGH PERFORMANCE FOAM MARKET BY TYPE (KILOTONS) 2020-2029
TABLE 127 SAUDI ARABIA HIGH PERFORMANCE FOAM MARKET BY END-USER INDUSTRY (USD BILLION) 2020-2029
TABLE 128 SAUDI ARABIA HIGH PERFORMANCE FOAM MARKET BY END-USER INDUSTRY (KILOTONS) 2020-2029
TABLE 129 SOUTH AFRICA HIGH PERFORMANCE FOAM MARKET BY TYPE (USD BILLION) 2020-2029
TABLE 130 SOUTH AFRICA HIGH PERFORMANCE FOAM MARKET BY TYPE (KILOTONS) 2020-2029
TABLE 131 SOUTH AFRICA HIGH PERFORMANCE FOAM MARKET BY END-USER INDUSTRY (USD BILLION) 2020-2029
TABLE 132 SOUTH AFRICA HIGH PERFORMANCE FOAM MARKET BY END-USER INDUSTRY (KILOTONS) 2020-2029
TABLE 133 REST OF MIDDLE EAST AND AFRICA HIGH PERFORMANCE FOAM MARKET BY TYPE (USD BILLION) 2020-2029
TABLE 134 REST OF MIDDLE EAST AND AFRICA HIGH PERFORMANCE FOAM MARKET BY TYPE (KILOTONS) 2020-2029
TABLE 135 REST OF MIDDLE EAST AND AFRICA HIGH PERFORMANCE FOAM MARKET BY END-USER INDUSTRY (USD BILLION) 2020-2029
TABLE 136 REST OF MIDDLE EAST AND AFRICA HIGH PERFORMANCE FOAM MARKET BY END-USER INDUSTRY (KILOTONS) 2020-2029
LIST OF FIGURES
FIGURE 1 MARKET DYNAMICS
FIGURE 2 MARKET SEGMENTATION
FIGURE 3 REPORT TIMELINES: YEARS CONSIDERED
FIGURE 4 DATA TRIANGULATION
FIGURE 5 BOTTOM-UP APPROACH
FIGURE 6 TOP-DOWN APPROACH
FIGURE 7 RESEARCH FLOW
FIGURE 8 GLOBAL HIGH PERFORMANCE FOAM MARKET BY TYPE, USD BILLION, 2020-2029
FIGURE 9 GLOBAL HIGH PERFORMANCE FOAM MARKET BY END-USER INDUSTRY, USD BILLION, 2020-2029
FIGURE 10 GLOBAL HIGH PERFORMANCE FOAM MARKET BY REGION, USD BILLION, 2020-2029
FIGURE 11 PORTER’S FIVE FORCES MODEL
FIGURE 12 GLOBAL HIGH PERFORMANCE FOAM MARKET BY TYPE, USD BILLION, 2021
FIGURE 13 GLOBAL HIGH PERFORMANCE FOAM MARKET BY END-USER INDUSTRY, USD BILLION, 2021
FIGURE 14 GLOBAL HIGH PERFORMANCE FOAM MARKET BY REGION, USD BILLION, 2021
FIGURE 15 NORTH AMERICA HIGH PERFORMANCE FOAM MARKET SNAPSHOT
FIGURE 16 EUROPE HIGH PERFORMANCE FOAM MARKET SNAPSHOT
FIGURE 17 SOUTH AMERICA HIGH PERFORMANCE FOAM MARKET SNAPSHOT
FIGURE 18 ASIA PACIFIC HIGH PERFORMANCE FOAM MARKET SNAPSHOT
FIGURE 19 MIDDLE EAST ASIA AND AFRICA HIGH PERFORMANCE FOAM MARKET SNAPSHOT
FIGURE 20 MARKET SHARE ANALYSIS
FIGURE 21 3M: COMPANY SNAPSHOT
FIGURE 22 EVONIK INDUSTRIES AG: COMPANY SNAPSHOT
FIGURE 23 ROGERS CORPORATION: COMPANY SNAPSHOT
FIGURE 24 BASF SE: COMPANY SNAPSHOT
FIGURE 25 DUPONT: COMPANY SNAPSHOT
FIGURE 26 SEKISUI ALVEO: COMPANY SNAPSHOT
FIGURE 27 ARMACELL: COMPANY SNAPSHOT
FIGURE 28 SABIC: COMPANY SNAPSHOT
FIGURE 29 SAINT-GOBAIN: COMPANY SNAPSHOT
FIGURE 30 ZOTEFOAMS PLC: COMPANY SNAPSHOT
FIGURE 31 SOLVAY: COMPANY SNAPSHOT
DOWNLOAD FREE SAMPLE REPORT
License Type
SPEAK WITH OUR ANALYST
Want to know more about the report or any specific requirement?
WANT TO CUSTOMIZE THE REPORT?
Our Clients Speak
We asked them to research ‘ Equipment market’ all over the world, and their whole arrangement was helpful to us. thehealthanalytics.com insightful analysis and reports contributed to our current analysis and in creating a future strategy. Besides, the te
Yosuke Mitsui
Senior Associate Construction Equipment Sales & Marketing
We asked them to research ‘Equipment market’ all over the world, and their whole arrangement was helpful to us. thehealthanalytics.com insightful analysis and reports contributed to our current analysis and in creating a future strategy. Besides, the te


