

Base Year Value ()
x.x %
x.x %
CAGR ()
x.x %
x.x %
Forecast Year Value ()
x.x %
x.x %
Historical Data Period
Largest Region
Forecast Period
Chemical Surface Treatment Market By Chemical Type (Cleaners, Plating Chemicals, Conversion Coatings, Others), Base Material (Metals, Plastics, Glass, Wood, Others), End Use Industry (Transportation, Construction, General Industry, Packaging, Industrial Machinery, Aerospace, Metal Working Industry, Wood Industry, Others) And Region, Global Trends And Forecast From 2022 To 2029.
Instant access to hundreds of data points and trends
- Market estimates from 2014-2029
- Competitive analysis, industry segmentation, financial benchmarks
- Incorporates SWOT, Porter's Five Forces and risk management frameworks
- PDF report or online database with Word, Excel and PowerPoint export options
- 100% money back guarantee
Chemical Surface Treatment Market Overview
The chemical surface treatment market is expected to grow at 5.8% CAGR from 2022 to 2029. It is expected to reach above USD 21.46 billion by 2029 from USD 13.67 billion in 2021.
Chemical surface treatment is the process of applying a chemical solution to a material's surface to change its properties. The procedure aims to improve the surface properties, such as enhancing corrosion resistance, fostering adhesion, boosting wear resistance, or changing the material's appearance. The material is typically cleaned to remove contaminants before being exposed to a chemical solution or a combination of solutions during chemical surface treatment. The chosen chemicals interact with the material's surface to form a thin layer that changes the material's properties. Etching, passivation, anodizing, phosphating, and chromating are examples of common chemical treatments.
Metals, plastics, ceramics, and composites are just a few of the materials that can receive these treatments. Depending on the desired outcome and the material being treated, a particular treatment method and chemicals may be employed. Industries like automotive, aerospace, electronics, and construction, where surface properties have a significant impact on the performance and longevity of the materials, depend heavily on chemical surface treatment.
Several important factors are what drive the chemical surface treatment market. The need for surface treatment solutions to improve qualities like corrosion resistance and adhesion is first driven by the increasing demand for high-performance and durable materials in sectors like automotive, aerospace, and electronics. Second, the development of environmentally sustainable surface treatment techniques is driven by escalating environmental regulations and the demand for eco-friendly procedures. In addition, the emergence of new materials and technological developments in surface treatment methods support market expansion. The growth of end-use industries in developing nations and the increasing emphasis on enhancing product quality and performance also fuel the market for chemical surface treatment.
[caption id="attachment_26238" align="aligncenter" width="1920"]
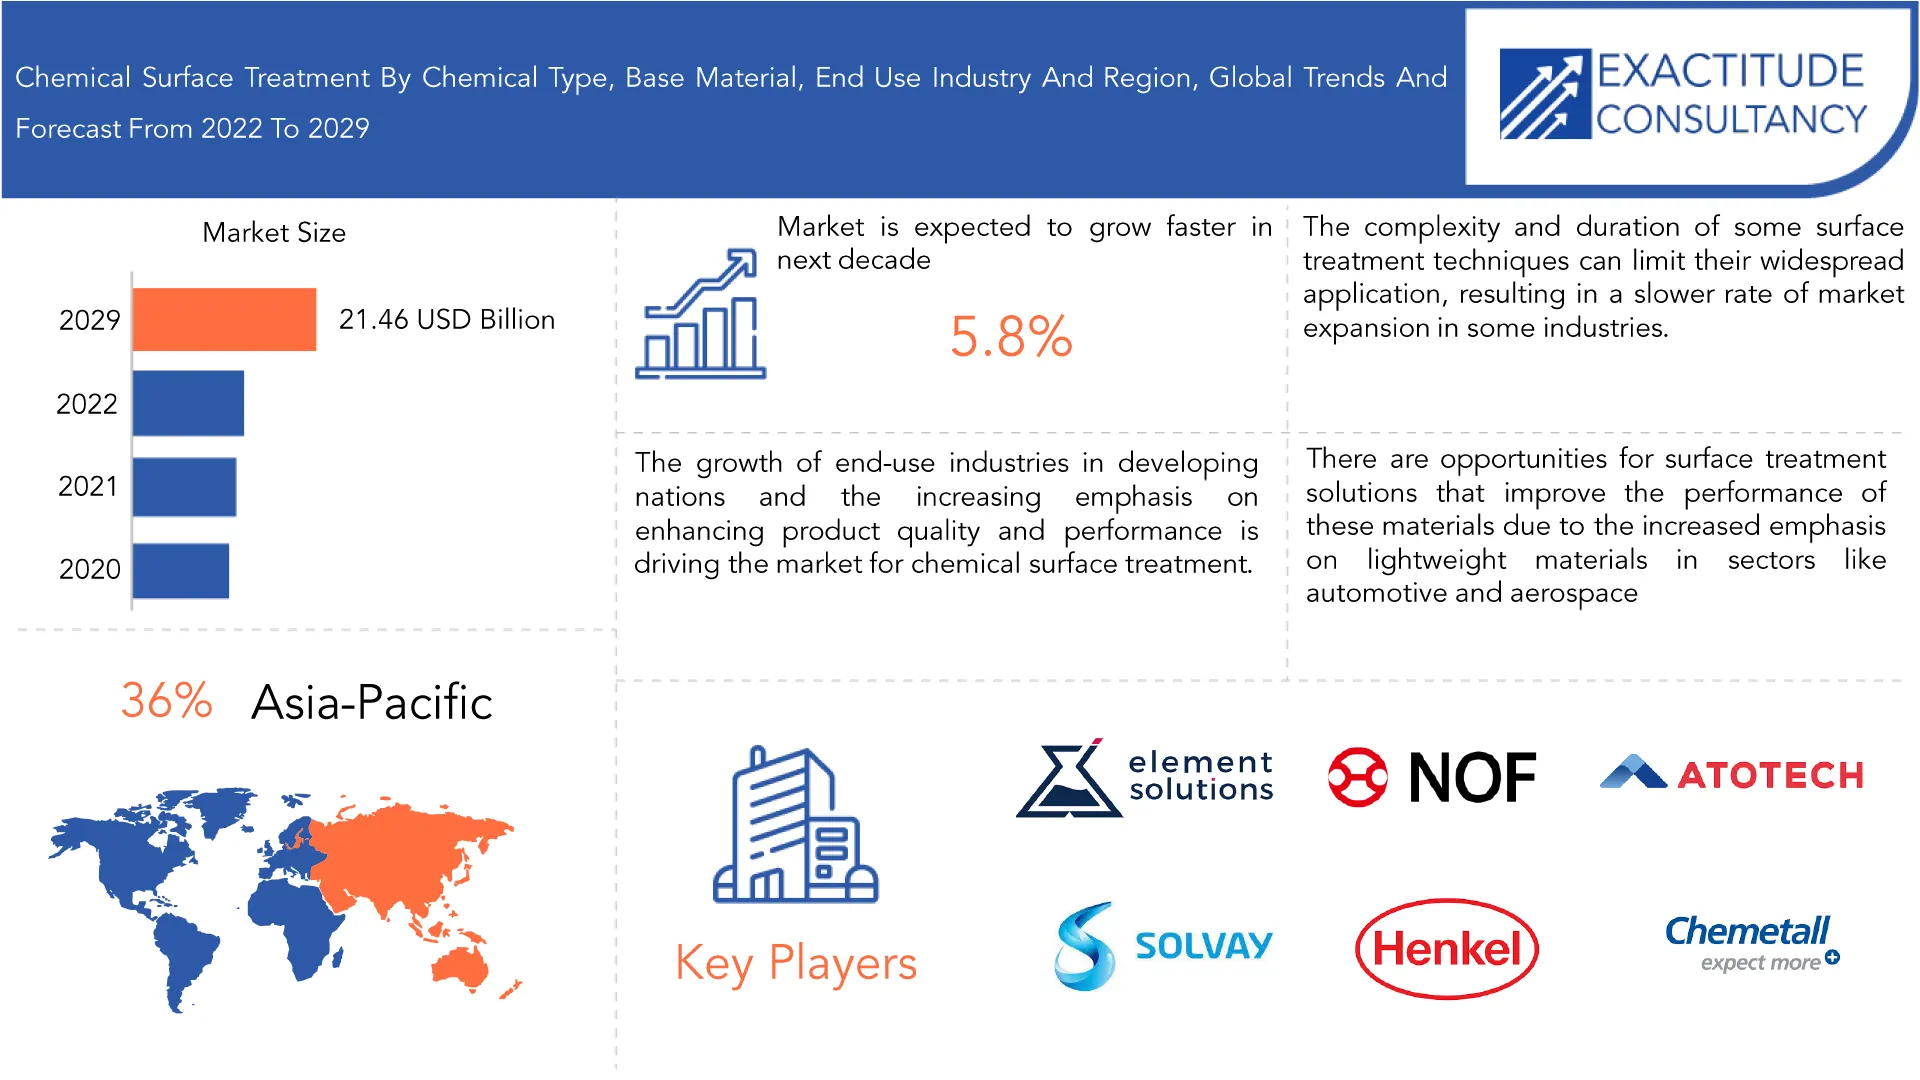
There are additional obstacles to the growth of the chemical surface treatment market. First, manufacturers may face difficulties due to the fluctuating prices and availability of raw materials used in surface treatment solutions. Compliance and sustainability issues are also exacerbated by strict environmental regulations and worries about the use of dangerous chemicals in surface treatment procedures. Additionally, the adoption of these solutions is hampered by the high initial capital expenditure needed to set up surface treatment facilities and the requirement for skilled labor, especially in small and medium-sized businesses. Finally, the complexity and duration of some surface treatment techniques can limit their widespread application, resulting in a slower rate of market expansion in some industries.
The market for chemical surface treatment offers a number of expansion prospects. First off, there are opportunities for surface treatment solutions that improve the performance of these materials due to the increased emphasis on lightweight materials in sectors like automotive and aerospace. Second, the increased demand for green and sustainable surface treatment techniques creates opportunities for the creation of novel green technologies. Additionally, emerging economies' growing industrial sectors present chances for market expansion. Additionally, developments in surface engineering and nanotechnology present opportunities for the creation of brand-new, highly effective surface treatment methods with enhanced characteristics and functionalities.
The deadly COVID-19 pandemic had a catastrophic impact on the surface treatment industry worldwide. However, the effects vary depending on the end-use industries. The two main industries that experience a significant drop in demand for surface treatments during the pandemic are automotive and aerospace. The pandemic had a less significant effect on the other two major markets, metal processing and aluminum finishing. Overall, almost all of the major end-user industries for surface treatment products had their operations halted as a result of the global COVID-19 pandemic and the ensuing lockdowns, which had a significant impact on the market's growth rate.
| ATTRIBUTE | DETAILS |
| Study period | 2020-2029 |
| Base year | 2021 |
| Estimated year | 2022 |
| Forecasted year | 2022-2029 |
| Historical period | 2018-2020 |
| Unit | Value (USD Billion) |
| Segmentation | By chemical type, by base material, by end use industry, by region |
| By Chemical Type |
|
| By Base Material |
|
| By End Use Industry |
|
| By Region
|
|
Frequently Asked Questions
What is the projected market size & growth rate of the chemical surface treatment market?
Chemical surface treatment market was valued at USD 14.46 billion in 2022 and is projected to reach USD 21.46 billion by 2029, growing at a CAGR of 5.8% from 2022 to 2029.
What are the factors driving the chemical surface treatment market?
The factors such as fast expansion of industrialization and the chemical surface treatment's numerous benefits such as electrical conductivity, corrosion resistance, wear resistance and chemical resistance aid the market growth and are the major drivers for the market.
What are the top players operating in the chemical surface treatment market?
The major players of chemical surface treatment market include Element Solutions Inc., NOF Corporation, Atotech, Henkel AG & Co. KGaA, Chemetall Inc., Nihon Parkerizing Co. Ltd., PPG Industries Inc., Nippon Paint Holdings Co., Ltd., and Solvay,OC Oerlikon Management AG.
What segments are covered in the chemical surface treatment market report?
The global chemical surface treatment market is segmented on the chemical type, base material, end use industry and geography.
Which region held the largest share of chemical surface treatment market in 2021?
Asia-Pacific held the largest share of chemical surface treatment market in 2021.
Who Should Buy? Or Key stakeholders
- Manufacturers
- Chemical Industry
- End users companies
- Government organizations
- Research organizations
- Investment research firms
- Others
Chemical Surface Treatment Market Regional Analysis
The chemical surface treatment market by region includes North America, Asia-Pacific (APAC), Europe, South America, and Middle East & Africa (MEA).
- North America: includes the US, Canada, Mexico, Rest of North America
- Asia Pacific: includes China, Japan, South Korea, India, Australia, and Rest of APAC
- Europe: includes UK, Germany, France, Italy, Russia, Spain, and Rest of Europe
- South America: includes Brazil, Argentina, Colombia and Rest of South America
- Middle East & Africa: includes UAE, Saudi Arabia, South Africa, and Rest of MEA
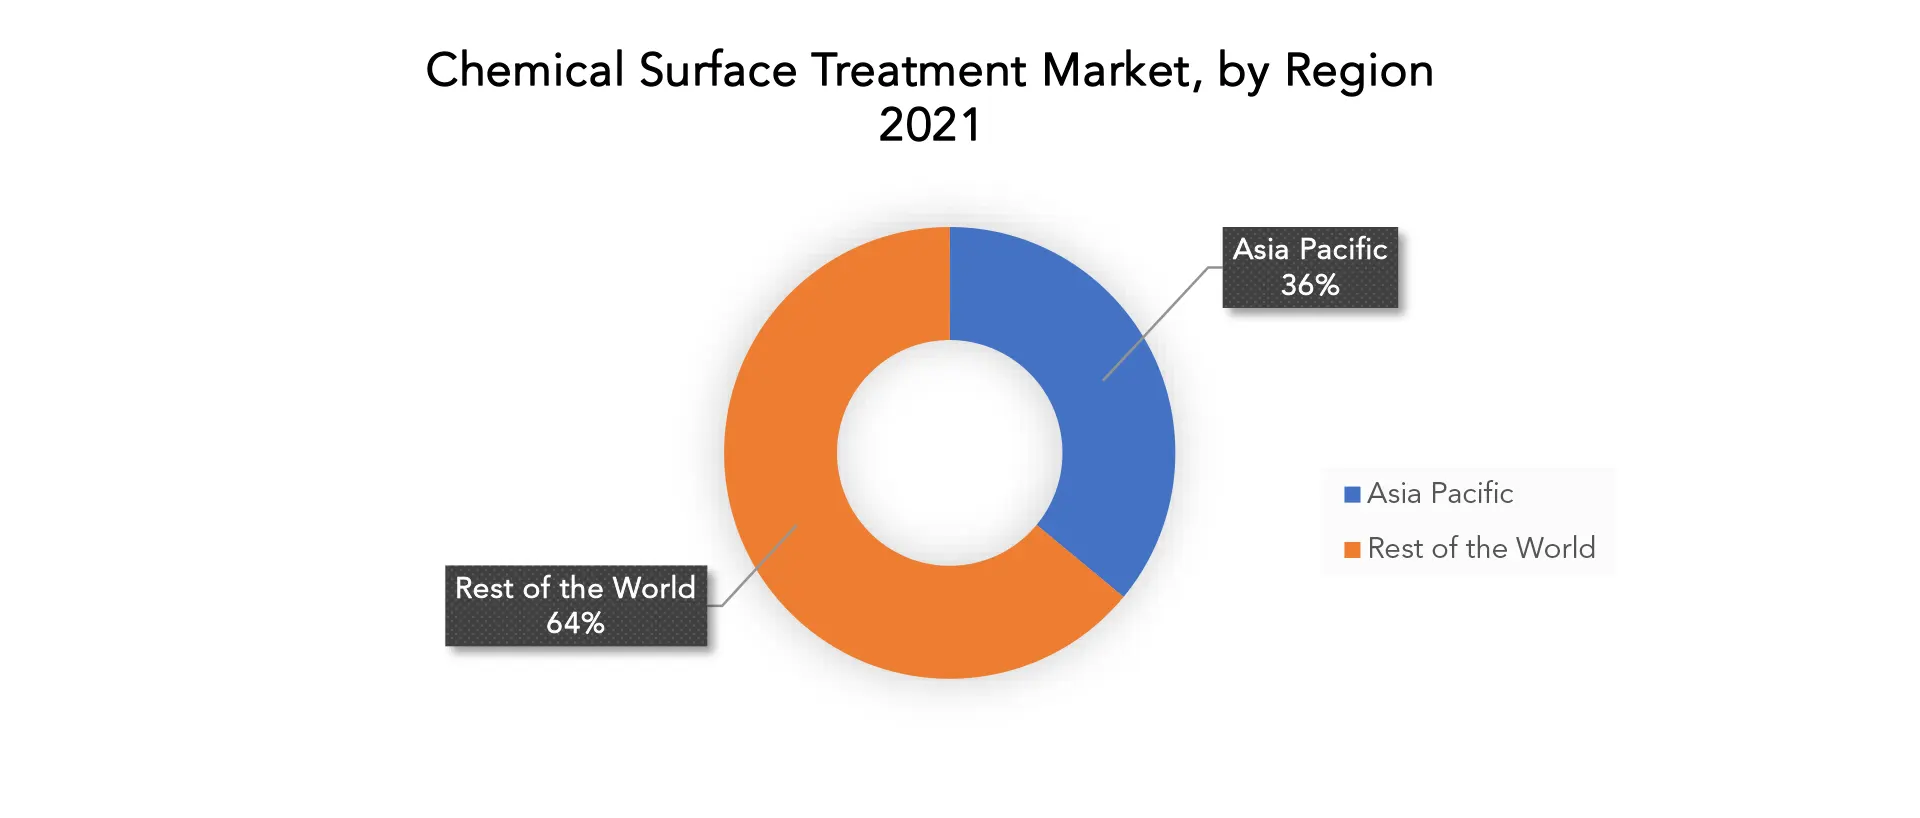
The chemical surface treatment market was dominated by Asia Pacific with a share of more than 36%, followed by North America and Europe. The extensive industrial base in the area and rising demand for automobiles can be blamed for the expansion of the Asia Pacific chemical surface treatments market. The Asia Pacific chemical surface treatments market is anticipated to grow over the course of the forecast period as a result of numerous initiatives taken by governments of various Asia Pacific nations to entice investments from numerous foreign corporations. Due to their widespread use in industries like manufacturing and medicine, as well as the development of lighter, more affordable ways to achieve superior mechanical stress resistance capabilities, the market for technical etchants and treatment chemicals is expected to grow quickly.
Over the forecast period, North America is anticipated to experience significant growth. The presence of significant market players and the use of marketing analytics tools can both be used to explain the growth of this market. Additionally, businesses, organizations, third-party administrators, etc. are focusing their efforts on creating products that cater to their customers, which will also aid in the expansion of this market.
Key Market Segments: Chemical Surface Treatment Market
Chemical Surface Treatment Market By Chemical Type, 2020-2029, (USD Billion)- Cleaners
- Plating Chemicals
- Conversion Coatings
- Others
- Metals
- Plastics
- Glass
- Wood
- Others
- Transportation
- Construction
- General Industry
- Packaging
- Industrial Machinery
- Aerospace
- Metal Working Industry
- Wood Industry
- Others
- North America
- Asia Pacific
- Europe
- South America
- Middle East and Africa
Exactitude Consultancy Services Key Objectives:
- Increasing sales and market share
- Developing new technology
- Improving profitability
- Entering new markets
- Enhancing brand reputation
Key Question Answered
- What is the expected growth rate of the chemical surface treatment market over the next 7 years?
- What are the end user industries driving demand for market and what is their outlook?
- What are the opportunities for growth in emerging markets such as asia-pacific, middle east, and Africa?
- How is the economic environment affecting the chemical surface treatment market, including factors such as interest rates, inflation, and exchange rates?
- What is the expected impact of government policies and regulations on the chemical surface treatment market?
- What is the current and forecasted size and growth rate of the global chemical surface treatment market?
- What are the key drivers of growth in the chemical surface treatment market?
- Who are the major players in the market and what is their market share?
- What are the distribution channels and supply chain dynamics in the chemical surface treatment market?
- What are the technological advancements and innovations in the chemical surface treatment market and their impact on product development and growth?
- What are the regulatory considerations and their impact on the market?
- What are the challenges faced by players in the chemical surface treatment market and how are they addressing these challenges?
- What are the opportunities for growth and expansion in the chemical surface treatment market?
- What are the service offerings and specifications of leading players in the market?
Chemical Surface Treatment Market Segment Analysis
The chemical surface treatment market is segmented based on chemical type, base material, end use industry and region. By chemical type market is segmented into cleaners, plating chemicals, conversion coatings, others. By base material market is segmented into metals, plastics, glass, wood, and others. By end use industry market is segmented into transportation, construction, general industry, packaging, industrial machinery, aerospace, metal working industry, wood industry, and others.
In 2021, the market for chemical surface treatment saw significant growth in the plating chemicals segment. The suitability of plating chemicals for use in a variety of end-use industries, including transportation, industrial machinery, and construction, can be credited with the growth of this market segment. Growing segment growth is being fueled by increasing adoption of plating to lower scrap rate, bath solution losses, and improve surface quality.
The plastics segment is anticipated to dominate the chemical surface treatments market during the forecast period based on base material. The preference for plastics over metals in a variety of end-use industries, such as transportation and construction, can be credited with the growth of this market segment. Furthermore, as they can be easily formed and machined, plastics also provide ease of fabrication. Additionally, they require less finishing.
The transportation sector is anticipated to dominate the market for chemical surface treatments among end-use industries over the course of the forecast. The expansion of this market segment can be attributed to global improvements in road infrastructure, ongoing urbanization, and the number of vehicles on the road. These factors have led to an increase in personal vehicles globally.
[caption id="attachment_26240" align="aligncenter" width="1920"]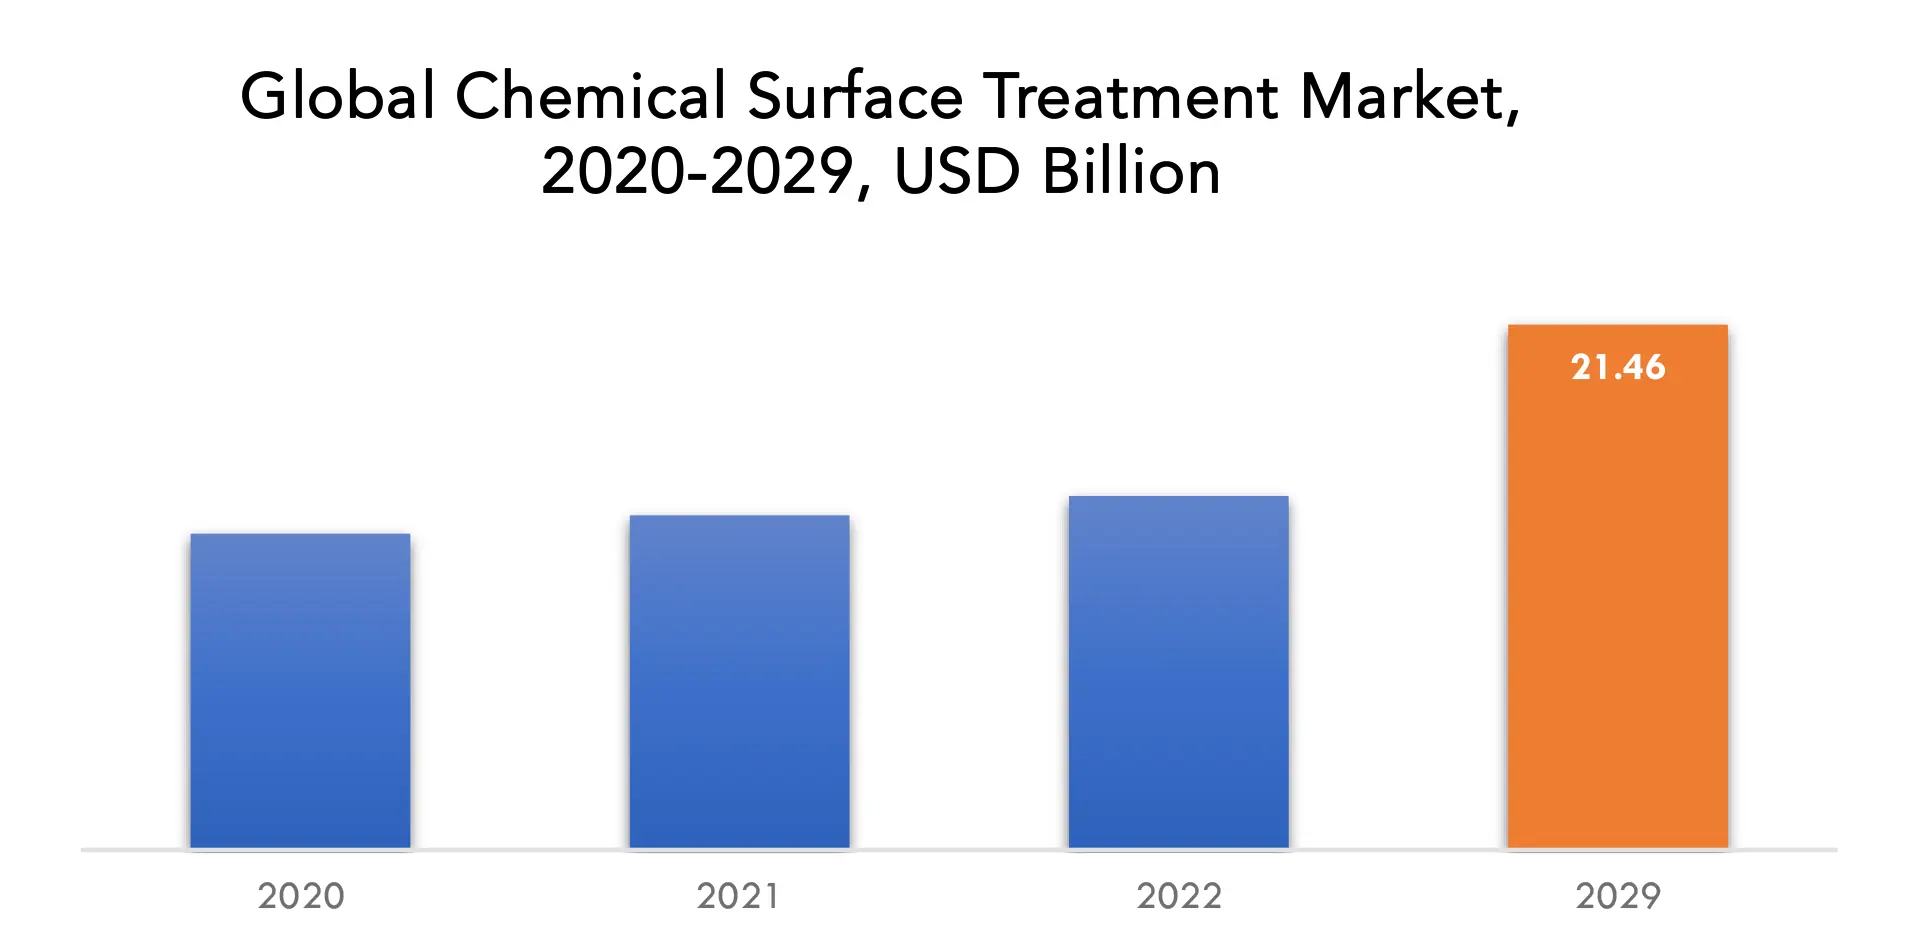
Chemical Surface Treatment Market Players
The chemical surface treatment market key players include Element Solutions Inc., NOF Corporation, Atotech, Henkel AG & Co. KGaA, Chemetall Inc., Nihon Parkerizing Co. Ltd., PPG Industries Inc.,Nippon Paint Holdings Co., Ltd., Solvay, OC Oerlikon Management AG, and others.
Recent Developments:- 14 November 2022: Electrolube announced the launch of a brand-new series of silver conductive inks for multiple adhesive processes designed for use during the manufacture of LCD, LCM, and OLED displays and display modules for mobile/smart phones, tablets and many other electronic products.
- 06 September 2022: MacDermid Alpha Electronics Solutions introduced a new packaging option for the ALPHA Argomaxsinter paste that allows customers more manufacturing options.
- INTRODUCTION
- MARKET DEFINITION
- MARKET SEGMENTATION
- RESEARCH TIMELINES
- ASSUMPTIONS AND LIMITATIONS
- RESEARCH METHODOLOGY
- DATA MINING
- SECONDARY RESEARCH
- PRIMARY RESEARCH
- SUBJECT-MATTER EXPERTS’ ADVICE
- QUALITY CHECKS
- FINAL REVIEW
- DATA TRIANGULATION
- BOTTOM-UP APPROACH
- TOP-DOWN APPROACH
- RESEARCH FLOW
- DATA SOURCES
- DATA MINING
- EXECUTIVE SUMMARY
- MARKET OVERVIEW
- GLOBAL CHEMICAL SURFACE TREATMENT MARKET OUTLOOK
- MARKET DRIVERS
- MARKET RESTRAINTS
- MARKET OPPORTUNITIES
- IMPACT OF COVID-19 ON CHEMICAL SURFACE TREATMENT MARKET
- PORTER’S FIVE FORCES MODEL
- THREAT FROM NEW ENTRANTS
- THREAT FROM SUBSTITUTES
- BARGAINING POWER OF SUPPLIERS
- BARGAINING POWER OF CUSTOMERS
- DEGREE OF COMPETITION
- INDUSTRY VALUE CHAIN ANALYSIS
- GLOBAL CHEMICAL SURFACE TREATMENT MARKET OUTLOOK
- GLOBAL CHEMICAL SURFACE TREATMENT MARKET BY CHEMICAL TYPE (USD BILLION), 2020-2029
- CLEANERS
- PLATING CHEMICALS
- CONVERSION COATINGS
- OTHERS
- GLOBAL CHEMICAL SURFACE TREATMENT MARKET BY BASE MATERIAL (USD BILLION), 2020-2029
- METALS
- PLASTICS
- GLASS
- WOOD
- OTHERS
- GLOBAL CHEMICAL SURFACE TREATMENT MARKET BY END USE INDUSTRY (USD BILLION), 2020-2029
- TRANSPORTATION
- CONSTRUCTION
- GENERAL INDUSTRY
- PACKAGING
- INDUSTRIAL MACHINERY
- AEROSPACE
- METAL WORKING INDUSTRY
- WOOD INDUSTRY
- OTHERS
- GLOBAL CHEMICAL SURFACE TREATMENT MARKET BY REGION (USD BILLION), 2020-2029
- NORTH AMERICA
- US
- CANADA
- MEXICO
- SOUTH AMERICA
- BRAZIL
- ARGENTINA
- COLOMBIA
- REST OF SOUTH AMERICA
- EUROPE
- GERMANY
- UK
- FRANCE
- ITALY
- SPAIN
- RUSSIA
- REST OF EUROPE
- ASIA PACIFIC
- INDIA
- CHINA
- JAPAN
- SOUTH KOREA
- AUSTRALIA
- REST OF ASIA PACIFIC
- MIDDLE EAST AND AFRICA
- UAE
- SAUDI ARABIA
- SOUTH AFRICA
- REST OF MIDDLE EAST AND AFRICA
- NORTH AMERICA
- COMPANY PROFILES* (BUSINESS OVERVIEW, COMPANY SNAPSHOT, PRODUCTS OFFERED, RECENT DEVELOPMENTS)
- ELEMENT SOLUTIONS INC.
- NOF CORPORATION
- ATOTECH
- HENKEL AG & CO. KGAA
- CHEMETALL, INC.
- NIHON PARKERIZING CO., LTD.
- PPG INDUSTRIES, INC.
- NIPPON PAINT HOLDINGS CO., LTD.
- SOLVAY
- OC OERLIKON MANAGEMENT AG
*THE COMPANY LIST IS INDICATIVE
LIST OF TABLES
TABLE 1 GLOBAL CHEMICAL SURFACE TREATMENT MARKET BY CHEMICAL TYPE (USD BILLION), 2020-2029
TABLE 2 GLOBAL CHEMICAL SURFACE TREATMENT MARKET BY BASE MATERIAL (USD BILLION), 2020-2029
TABLE 3 GLOBAL CHEMICAL SURFACE TREATMENT MARKET BY END USE INDUSTRY (USD BILLION), 2020-2029
TABLE 4 GLOBAL CHEMICAL SURFACE TREATMENT MARKET BY REGION (USD BILLION), 2020-2029
TABLE 5 NORTH AMERICA CHEMICAL SURFACE TREATMENT MARKET BY CHEMICAL TYPE (USD BILLION), 2020-2029
TABLE 6 NORTH AMERICA CHEMICAL SURFACE TREATMENT MARKET BY BASE MATERIAL (USD BILLION), 2020-2029
TABLE 7 NORTH AMERICA CHEMICAL SURFACE TREATMENT MARKET BY END USE INDUSTRY (USD BILLION), 2020-2029
TABLE 8 NORTH AMERICA CHEMICAL SURFACE TREATMENT MARKET BY COUNTRY (USD BILLION), 2020-2029
TABLE 9 US CHEMICAL SURFACE TREATMENT MARKET BY CHEMICAL TYPE (USD BILLION), 2020-2029
TABLE 10 US CHEMICAL SURFACE TREATMENT MARKET BY BASE MATERIAL (USD BILLION), 2020-2029
TABLE 11 US CHEMICAL SURFACE TREATMENT MARKET BY END USE INDUSTRY (USD BILLION), 2020-2029
TABLE 12 CANADA CHEMICAL SURFACE TREATMENT MARKET BY CHEMICAL TYPE (BILLION), 2020-2029
TABLE 13 CANADA CHEMICAL SURFACE TREATMENT MARKET BY BASE MATERIAL (USD BILLION), 2020-2029
TABLE 14 CANADA CHEMICAL SURFACE TREATMENT MARKET BY END USE INDUSTRY (USD BILLION), 2020-2029
TABLE 15 MEXICO CHEMICAL SURFACE TREATMENT MARKET BY CHEMICAL TYPE (USD BILLION), 2020-2029
TABLE 16 MEXICO CHEMICAL SURFACE TREATMENT MARKET BY BASE MATERIAL (USD BILLION), 2020-2029
TABLE 17 MEXICO CHEMICAL SURFACE TREATMENT MARKET BY END USE INDUSTRY (USD BILLION), 2020-2029
TABLE 18 REST OF NORTH AMERICA CHEMICAL SURFACE TREATMENT MARKET BY CHEMICAL TYPE (USD BILLION), 2020-2029
TABLE 19 REST OF NORTH AMERICA CHEMICAL SURFACE TREATMENT MARKET BY BASE MATERIAL (USD BILLION), 2020-2029
TABLE 20 REST OF NORTH AMERICA CHEMICAL SURFACE TREATMENT MARKET BY END USE INDUSTRY (USD BILLION), 2020-2029
TABLE 21 SOUTH AMERICA CHEMICAL SURFACE TREATMENT MARKET BY CHEMICAL TYPE (USD BILLION), 2020-2029
TABLE 22 SOUTH AMERICA CHEMICAL SURFACE TREATMENT MARKET BY BASE MATERIAL (USD BILLION), 2020-2029
TABLE 23 SOUTH AMERICA CHEMICAL SURFACE TREATMENT MARKET BY END USE INDUSTRY (USD BILLION), 2020-2029
TABLE 24 SOUTH AMERICA CHEMICAL SURFACE TREATMENT MARKET BY COUNTRY (USD BILLION), 2020-2029
TABLE 25 BRAZIL CHEMICAL SURFACE TREATMENT MARKET BY CHEMICAL TYPE (USD BILLION), 2020-2029
TABLE 26 BRAZIL CHEMICAL SURFACE TREATMENT MARKET BY BASE MATERIAL (USD BILLION), 2020-2029
TABLE 27 BRAZIL CHEMICAL SURFACE TREATMENT MARKET BY END USE INDUSTRY (USD BILLION), 2020-2029
TABLE 28 ARGENTINA CHEMICAL SURFACE TREATMENT MARKET BY CHEMICAL TYPE (USD BILLION), 2020-2029
TABLE 29 ARGENTINA CHEMICAL SURFACE TREATMENT MARKET BY BASE MATERIAL (USD BILLION), 2020-2029
TABLE 30 ARGENTINA CHEMICAL SURFACE TREATMENT MARKET BY END USE INDUSTRY (USD BILLION), 2020-2029
TABLE 31 COLOMBIA CHEMICAL SURFACE TREATMENT MARKET BY CHEMICAL TYPE (USD BILLION), 2020-2029
TABLE 32 COLOMBIA CHEMICAL SURFACE TREATMENT MARKET BY BASE MATERIAL (USD BILLION), 2020-2029
TABLE 33 COLOMBIA CHEMICAL SURFACE TREATMENT MARKET BY END USE INDUSTRY (USD BILLION), 2020-2029
TABLE 34 REST OF SOUTH AMERICA CHEMICAL SURFACE TREATMENT MARKET BY CHEMICAL TYPE (USD BILLION), 2020-2029
TABLE 35 REST OF SOUTH AMERICA CHEMICAL SURFACE TREATMENT MARKET BY BASE MATERIAL (USD BILLION), 2020-2029
TABLE 36 REST OF SOUTH AMERICA CHEMICAL SURFACE TREATMENT MARKET BY END USE INDUSTRY (USD BILLION), 2020-2029
TABLE 37 ASIA-PACIFIC CHEMICAL SURFACE TREATMENT MARKET BY CHEMICAL TYPE (USD BILLION), 2020-2029
TABLE 38 ASIA-PACIFIC CHEMICAL SURFACE TREATMENT MARKET BY BASE MATERIAL (USD BILLION), 2020-2029
TABLE 39 ASIA-PACIFIC CHEMICAL SURFACE TREATMENT MARKET BY END USE INDUSTRY (USD BILLION), 2020-2029
TABLE 40 ASIA-PACIFIC CHEMICAL SURFACE TREATMENT MARKET BY COUNTRY (USD BILLION), 2020-2029
TABLE 41 INDIA CHEMICAL SURFACE TREATMENT MARKET BY CHEMICAL TYPE (USD BILLION), 2020-2029
TABLE 42 INDIA CHEMICAL SURFACE TREATMENT MARKET BY BASE MATERIAL (USD BILLION), 2020-2029
TABLE 43 INDIA CHEMICAL SURFACE TREATMENT MARKET BY END USE INDUSTRY (USD BILLION), 2020-2029
TABLE 44 CHINA CHEMICAL SURFACE TREATMENT MARKET BY CHEMICAL TYPE (USD BILLION), 2020-2029
TABLE 45 CHINA CHEMICAL SURFACE TREATMENT MARKET BY BASE MATERIAL (USD BILLION), 2020-2029
TABLE 46 CHINA CHEMICAL SURFACE TREATMENT MARKET BY END USE INDUSTRY (USD BILLION), 2020-2029
TABLE 47 JAPAN CHEMICAL SURFACE TREATMENT MARKET BY CHEMICAL TYPE (USD BILLION), 2020-2029
TABLE 48 JAPAN CHEMICAL SURFACE TREATMENT MARKET BY BASE MATERIAL (USD BILLION), 2020-2029
TABLE 49 JAPAN CHEMICAL SURFACE TREATMENT MARKET BY END USE INDUSTRY (USD BILLION), 2020-2029
TABLE 50 SOUTH KOREA CHEMICAL SURFACE TREATMENT MARKET BY CHEMICAL TYPE (USD BILLION), 2020-2029
TABLE 51 SOUTH KOREA CHEMICAL SURFACE TREATMENT MARKET BY BASE MATERIAL (USD BILLION), 2020-2029
TABLE 52 SOUTH KOREA CHEMICAL SURFACE TREATMENT MARKET BY END USE INDUSTRY (USD BILLION), 2020-2029
TABLE 53 AUSTRALIA CHEMICAL SURFACE TREATMENT MARKET BY CHEMICAL TYPE (USD BILLION), 2020-2029
TABLE 54 AUSTRALIA CHEMICAL SURFACE TREATMENT MARKET BY BASE MATERIAL (USD BILLION), 2020-2029
TABLE 55 AUSTRALIA CHEMICAL SURFACE TREATMENT MARKET BY END USE INDUSTRY (USD BILLION), 2020-2029
TABLE 56 REST OF ASIA PACIFIC CHEMICAL SURFACE TREATMENT MARKET BY CHEMICAL TYPE (USD BILLION), 2020-2029
TABLE 57 REST OF ASIA PACIFIC CHEMICAL SURFACE TREATMENT MARKET BY BASE MATERIAL (USD BILLION), 2020-2029
TABLE 58 REST OF ASIA PACIFIC CHEMICAL SURFACE TREATMENT MARKET BY END USE INDUSTRY (USD BILLION), 2020-2029
TABLE 59 EUROPE CHEMICAL SURFACE TREATMENT MARKET BY CHEMICAL TYPE (USD BILLION), 2020-2029
TABLE 60 EUROPE CHEMICAL SURFACE TREATMENT MARKET BY BASE MATERIAL (USD BILLION), 2020-2029
TABLE 61 EUROPE CHEMICAL SURFACE TREATMENT MARKET BY END USE INDUSTRY (USD BILLION), 2020-2029
TABLE 62 EUROPE CHEMICAL SURFACE TREATMENT MARKET BY COUNTRY (USD BILLION), 2020-2029
TABLE 63 GERMANY CHEMICAL SURFACE TREATMENT MARKET BY CHEMICAL TYPE (USD BILLION), 2020-2029
TABLE 64 GERMANY CHEMICAL SURFACE TREATMENT MARKET BY BASE MATERIAL (USD BILLION), 2020-2029
TABLE 65 GERMANY CHEMICAL SURFACE TREATMENT MARKET BY END USE INDUSTRY (USD BILLION), 2020-2029
TABLE 66 UK CHEMICAL SURFACE TREATMENT MARKET BY CHEMICAL TYPE (USD BILLION), 2020-2029
TABLE 67 UK CHEMICAL SURFACE TREATMENT MARKET BY BASE MATERIAL (USD BILLION), 2020-2029
TABLE 68 UK CHEMICAL SURFACE TREATMENT MARKET BY END USE INDUSTRY (USD BILLION), 2020-2029
TABLE 69 FRANCE CHEMICAL SURFACE TREATMENT MARKET BY CHEMICAL TYPE (USD BILLION), 2020-2029
TABLE 70 FRANCE CHEMICAL SURFACE TREATMENT MARKET BY BASE MATERIAL (USD BILLION), 2020-2029
TABLE 71 FRANCE CHEMICAL SURFACE TREATMENT MARKET BY END USE INDUSTRY (USD BILLION), 2020-2029
TABLE 72 ITALY CHEMICAL SURFACE TREATMENT MARKET BY CHEMICAL TYPE (USD BILLION), 2020-2029
TABLE 73 ITALY CHEMICAL SURFACE TREATMENT MARKET BY BASE MATERIAL (USD BILLION), 2020-2029
TABLE 74 ITALY CHEMICAL SURFACE TREATMENT MARKET BY END USE INDUSTRY (USD BILLION), 2020-2029
TABLE 75 SPAIN CHEMICAL SURFACE TREATMENT MARKET BY CHEMICAL TYPE (USD BILLION), 2020-2029
TABLE 76 SPAIN CHEMICAL SURFACE TREATMENT MARKET BY BASE MATERIAL (USD BILLION), 2020-2029
TABLE 77 SPAIN CHEMICAL SURFACE TREATMENT MARKET BY END USE INDUSTRY (USD BILLION), 2020-2029
TABLE 78 RUSSIA CHEMICAL SURFACE TREATMENT MARKET BY CHEMICAL TYPE (USD BILLION), 2020-2029
TABLE 79 RUSSIA CHEMICAL SURFACE TREATMENT MARKET BY BASE MATERIAL (USD BILLION), 2020-2029
TABLE 80 RUSSIA CHEMICAL SURFACE TREATMENT MARKET BY END USE INDUSTRY (USD BILLION), 2020-2029
TABLE 81 REST OF EUROPE CHEMICAL SURFACE TREATMENT MARKET BY CHEMICAL TYPE (USD BILLION), 2020-2029
TABLE 82 REST OF EUROPE CHEMICAL SURFACE TREATMENT MARKET BY BASE MATERIAL (USD BILLION), 2020-2029
TABLE 83 REST OF EUROPE CHEMICAL SURFACE TREATMENT MARKET BY END USE INDUSTRY (USD BILLION), 2020-2029
TABLE 84 MIDDLE EAST AND AFRICA CHEMICAL SURFACE TREATMENT MARKET BY CHEMICAL TYPE (USD BILLION), 2020-2029
TABLE 85 MIDDLE EAST AND AFRICA CHEMICAL SURFACE TREATMENT MARKET BY BASE MATERIAL (USD BILLION), 2020-2029
TABLE 86 MIDDLE EAST AND AFRICA CHEMICAL SURFACE TREATMENT MARKET BY END USE INDUSTRY (USD BILLION), 2020-2029
TABLE 87 MIDDLE EAST AND AFRICA CHEMICAL SURFACE TREATMENT MARKET BY COUNTRY (USD BILLION), 2020-2029
TABLE 88 UAE CHEMICAL SURFACE TREATMENT MARKET BY CHEMICAL TYPE (USD BILLION), 2020-2029
TABLE 89 UAE CHEMICAL SURFACE TREATMENT MARKET BY BASE MATERIAL (USD BILLION), 2020-2029
TABLE 90 UAE CHEMICAL SURFACE TREATMENT MARKET BY END USE INDUSTRY (USD BILLION), 2020-2029
TABLE 91 SAUDI ARABIA CHEMICAL SURFACE TREATMENT MARKET BY CHEMICAL TYPE (USD BILLION), 2020-2029
TABLE 92 SAUDI ARABIA CHEMICAL SURFACE TREATMENT MARKET BY BASE MATERIAL (USD BILLION), 2020-2029
TABLE 93 SAUDI ARABIA CHEMICAL SURFACE TREATMENT MARKET BY END USE INDUSTRY (USD BILLION), 2020-2029
TABLE 94 SOUTH AFRICA CHEMICAL SURFACE TREATMENT MARKET BY CHEMICAL TYPE (USD BILLION), 2020-2029
TABLE 95 SOUTH AFRICA CHEMICAL SURFACE TREATMENT MARKET BY BASE MATERIAL (USD BILLION), 2020-2029
TABLE 96 SOUTH AFRICA CHEMICAL SURFACE TREATMENT MARKET BY END USE INDUSTRY (USD BILLION), 2020-2029
TABLE 97 REST OF MIDDLE EAST AND AFRICA CHEMICAL SURFACE TREATMENT MARKET BY CHEMICAL TYPE (USD BILLION), 2020-2029
TABLE 98 REST OF MIDDLE EAST AND AFRICA CHEMICAL SURFACE TREATMENT MARKET BY BASE MATERIAL (USD BILLION), 2020-2029
TABLE 99 REST OF MIDDLE EAST AND AFRICA CHEMICAL SURFACE TREATMENT MARKET BY END USE INDUSTRY (USD BILLION), 2020-2029
LIST OF FIGURES
FIGURE 1 MARKET DYNAMICS
FIGURE 2 MARKET SEGMENTATION
FIGURE 3 REPORT TIMELINES: YEARS CONSIDERED
FIGURE 4 DATA TRIANGULATION
FIGURE 5 BOTTOM-UP APPROACH
FIGURE 6 TOP-DOWN APPROACH
FIGURE 7 RESEARCH FLOW
FIGURE 8 GLOBAL CHEMICAL SURFACE TREATMENT MARKET BY CHEMICAL TYPE, USD BILLION, 2020-2029
FIGURE 9 GLOBAL CHEMICAL SURFACE TREATMENT MARKET BY BASE MATERIAL, USD BILLION, 2020-2029
FIGURE 10 GLOBAL CHEMICAL SURFACE TREATMENT MARKET BY END USE INDUSTRY, USD BILLION, 2020-2029
FIGURE 11 GLOBAL CHEMICAL SURFACE TREATMENT MARKET BY REGION, USD BILLION, 2020-2029
FIGURE 12 PORTER’S FIVE FORCES MODEL
FIGURE 13 CHEMICAL SURFACE TREATMENT MARKET BY REGION, USD BILLION, 2021
FIGURE 14 CHEMICAL SURFACE TREATMENT MARKET BY CHEMICAL TYPE, USD BILLION, 2021
FIGURE 15 CHEMICAL SURFACE TREATMENT MARKET BY BASE MATERIAL, USD BILLION, 2021
FIGURE 16 CHEMICAL SURFACE TREATMENT MARKET BY END USE INDUSTRY, USD BILLION, 2021
FIGURE 17 MARKET SHARE ANALYSIS
FIGURE 18 ELEMENT SOLUTIONS INC.: COMPANY SNAPSHOT
FIGURE 19 NOF CORPORATION: COMPANY SNAPSHOT
FIGURE 20 ATOTECH: COMPANY SNAPSHOT
FIGURE 21 HENKEL AG & CO. KGAA: COMPANY SNAPSHOT
FIGURE 22 CHEMETALL, INC.: COMPANY SNAPSHOT
FIGURE 23 NIHON PARKERIZING CO., LTD.: COMPANY SNAPSHOT
FIGURE 24 PPG INDUSTRIES, INC.: COMPANY SNAPSHOT
FIGURE 25 NIPPON PAINT HOLDINGS CO., LTD.: COMPANY SNAPSHOT
FIGURE 26 SOLVAY: COMPANY SNAPSHOT
FIGURE 27 OC OERLIKON MANAGEMENT AG: COMPANY SNAPSHOT
DOWNLOAD FREE SAMPLE REPORT
License Type
SPEAK WITH OUR ANALYST
Want to know more about the report or any specific requirement?
WANT TO CUSTOMIZE THE REPORT?
Our Clients Speak
We asked them to research ‘ Equipment market’ all over the world, and their whole arrangement was helpful to us. thehealthanalytics.com insightful analysis and reports contributed to our current analysis and in creating a future strategy. Besides, the te
Yosuke Mitsui
Senior Associate Construction Equipment Sales & Marketing
We asked them to research ‘Equipment market’ all over the world, and their whole arrangement was helpful to us. thehealthanalytics.com insightful analysis and reports contributed to our current analysis and in creating a future strategy. Besides, the te


