

Base Year Value ()
x.x %
x.x %
CAGR ()
x.x %
x.x %
Forecast Year Value ()
x.x %
x.x %
Historical Data Period
Largest Region
Forecast Period
Particle Therapy Market By Type (Proton Therapy, Heavy Ion Therapy), By Product (Synchrotron, Cyclotrons), By Cancer Type (Prostate Cancer, Lung Cancer, Pediatric Cancer, Breast Cancer), By End User (Hospitals, Research Centers), And Region, Global Trends and Forecast From 2023 to 2030.
Instant access to hundreds of data points and trends
- Market estimates from 2014-2029
- Competitive analysis, industry segmentation, financial benchmarks
- Incorporates SWOT, Porter's Five Forces and risk management frameworks
- PDF report or online database with Word, Excel and PowerPoint export options
- 100% money back guarantee
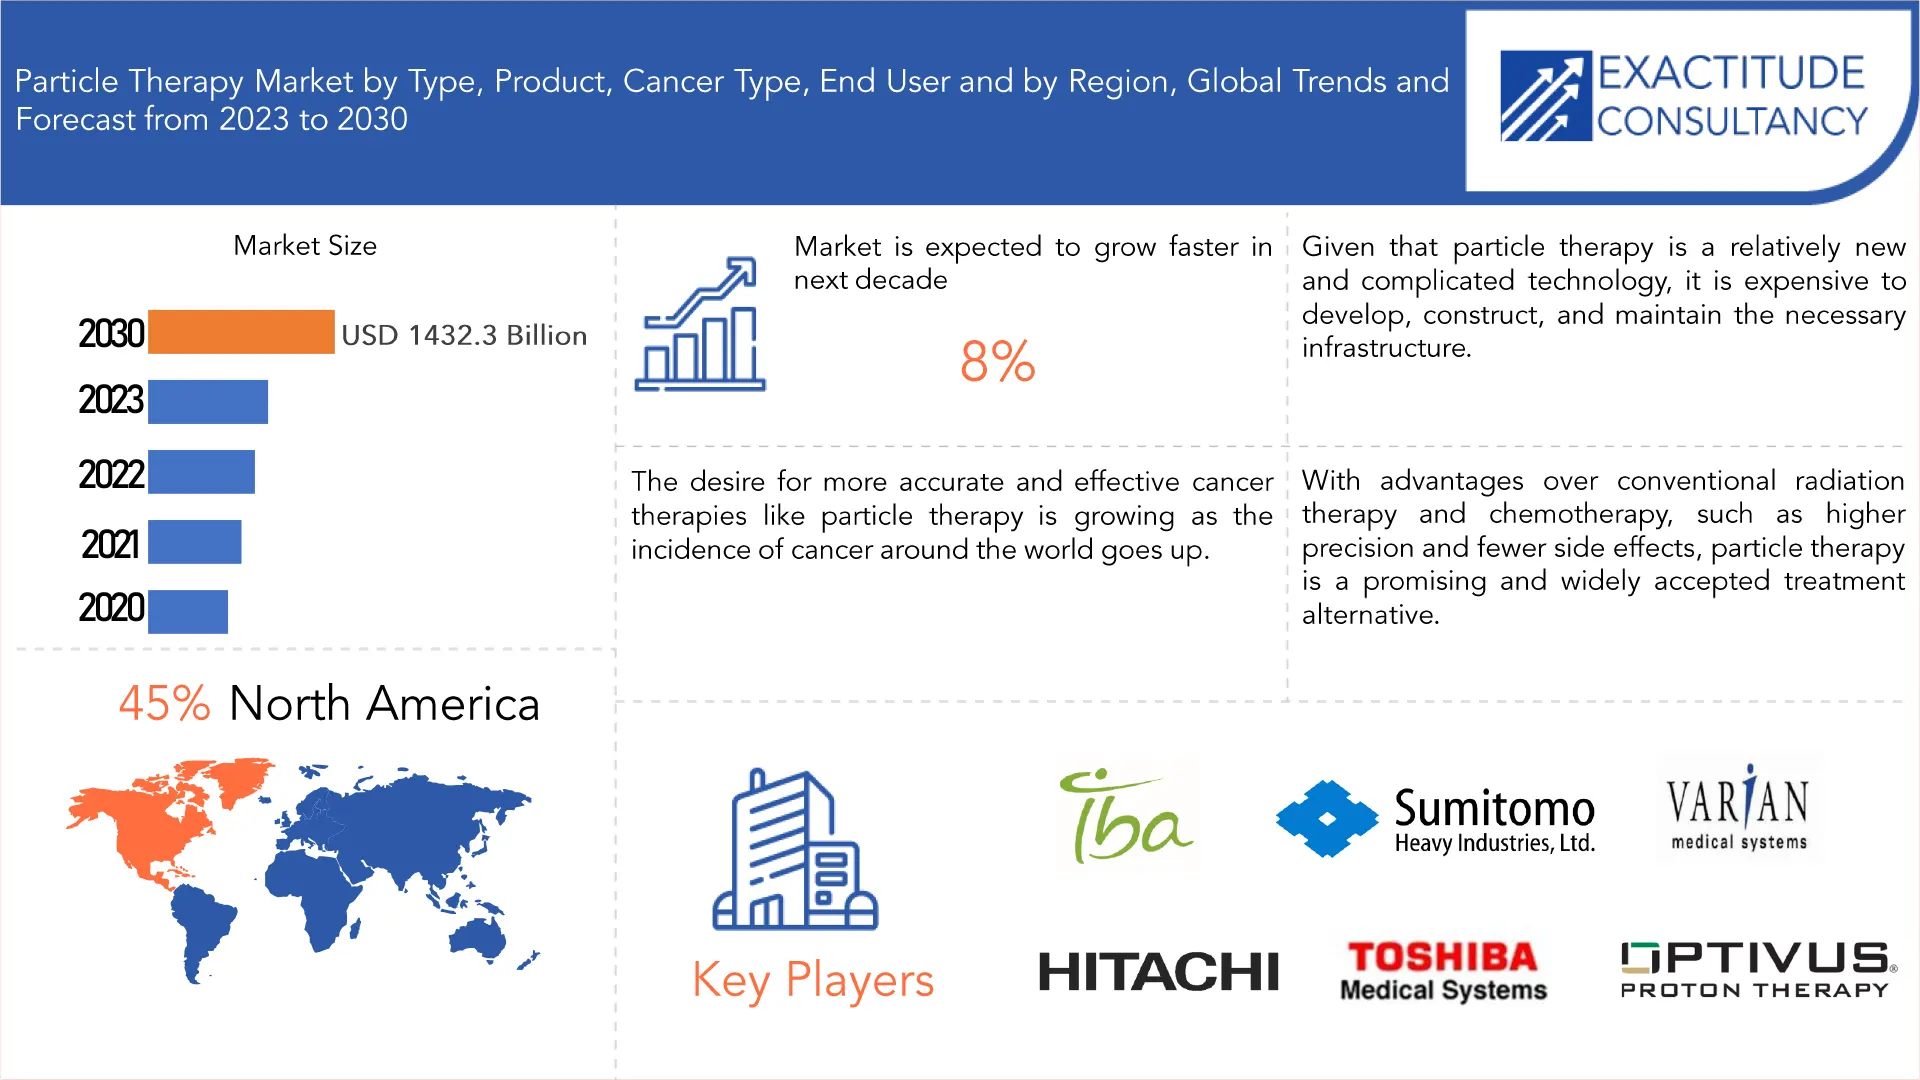
Particle Therapy Market Overview
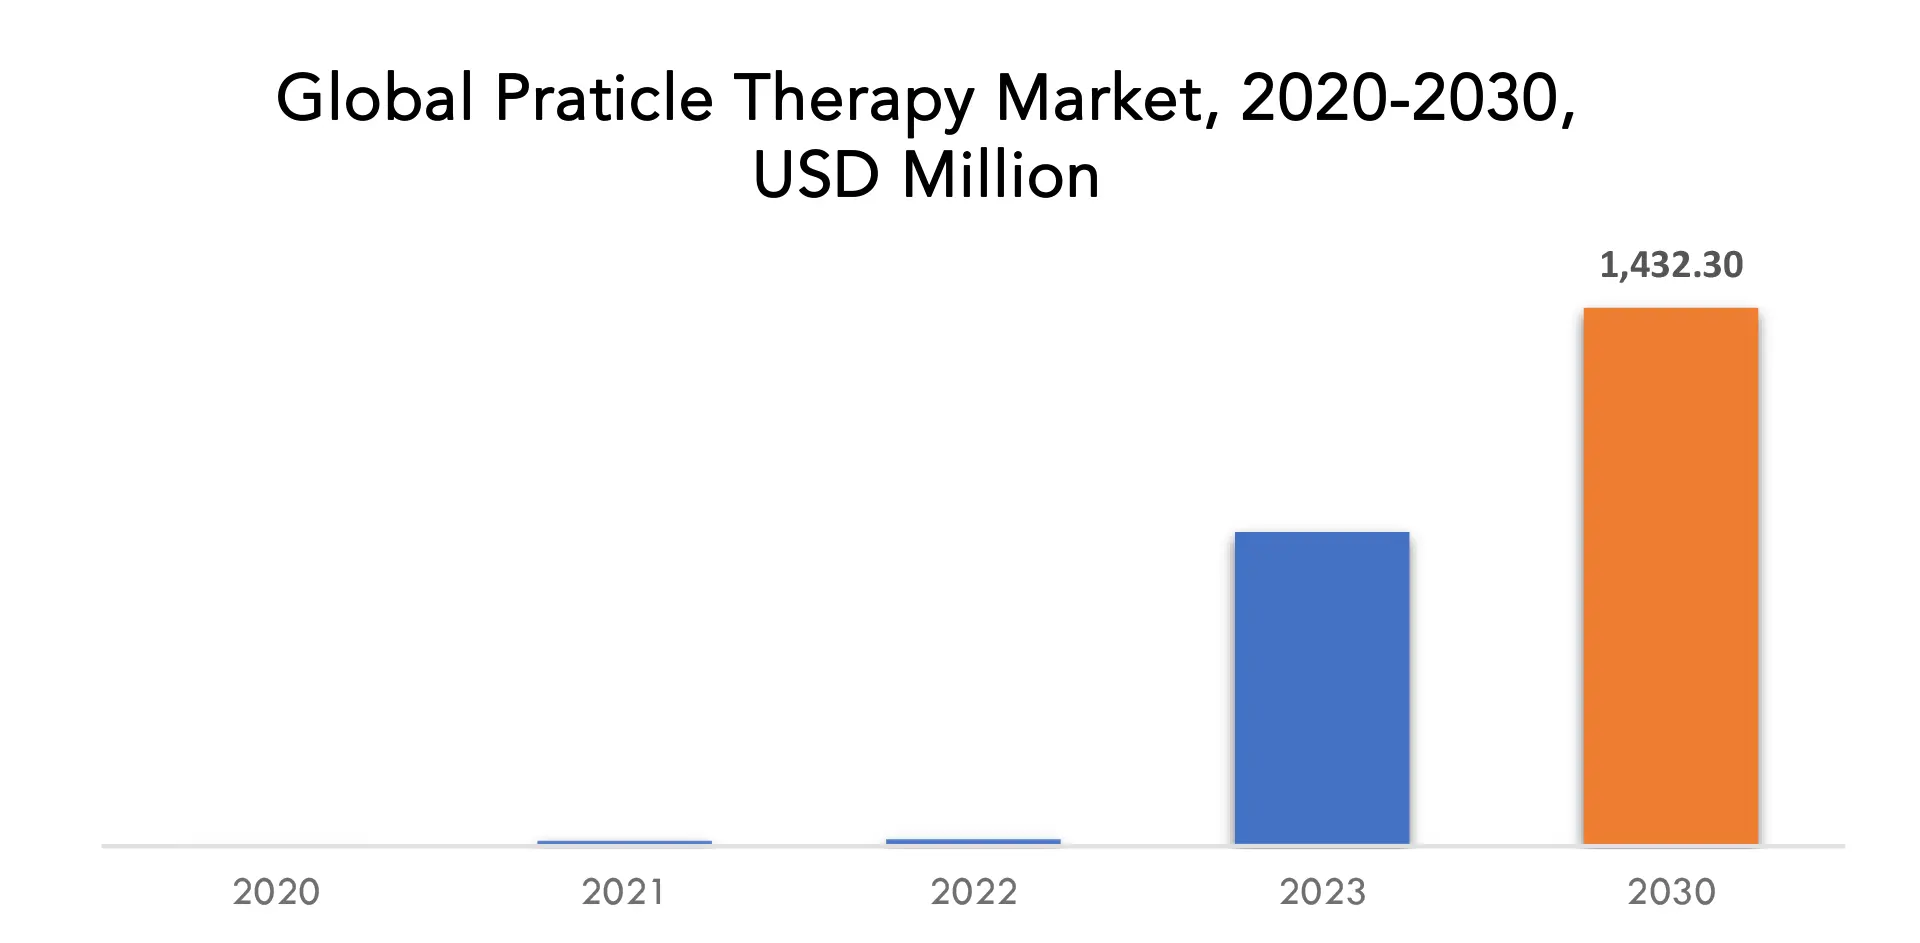
The particle therapy market is expected to grow at 8% CAGR from 2023 to 2030. It is expected to reach above USD 1432.30 Million by 2030 from USD 835.73 Million in 2023.
Particle therapy is a type of external beam radiotherapy that uses beams of high-energy protons, positive ions, or neutrons to treat cancer. It is a cutting-edge technique that delivers radiation to cancerous cells while sparing the surrounding healthy tissues. This precision in targeting cancer cells makes particle therapy an effective treatment option for certain types of cancers, including those that are resistant to conventional radiation therapy. The global particle therapy market is witnessing significant growth due to various factors. The rising incidence of cancer worldwide is one of the primary drivers of this market. According to the World Health Organization (WHO), cancer is the second leading cause of death globally, accounting for an estimated 9.6 million deaths in 2018. The increasing prevalence of cancer has led to a rise in demand for advanced and effective cancer treatments, such as particle therapy. Another significant driver of the particle therapy market is the increasing use of particle therapy in clinical trials.
[caption id="attachment_30535" align="aligncenter" width="1920"]
Moreover, the rising number of particle therapy centers worldwide is contributing to the growth of the particle therapy market. Governments and healthcare organizations are investing in building new particle therapy centers to meet the increasing demand for this advanced cancer treatment. This is particularly true in developed countries where there is a higher prevalence of cancer. However, despite the significant growth opportunities, the particle therapy market is facing some challenges. Unfavorable reimbursement policies and limited insurance coverage for particle therapy are hindering market growth. Additionally, the increasing affordability and accessibility of alternative treatments, such as conventional radiation therapy, may also restrain the growth of the particle therapy market. However, challenges such as unfavorable reimbursement policies, limited insurance coverage, and increasing affordability and accessibility of alternative treatments may restrain market growth.
The construction and installation of new particle therapy centers have been hindered by the pandemic, with progress being slowed due to lockdowns, supply chain disruptions, and other challenges related to the pandemic. Cancer patients have postponed or delayed their treatments due to concerns about contracting COVID-19 or restrictions on non-essential medical procedures, resulting in a decrease in patient volumes for particle therapy treatments and other cancer therapies.
| ATTRIBUTE | DETAILS |
| Study period | 2020-2030 |
| Base year | 2022 |
| Estimated year | 2023 |
| Forecasted year | 2023-2030 |
| Historical period | 2019-2021 |
| Unit | Value (USD Million) |
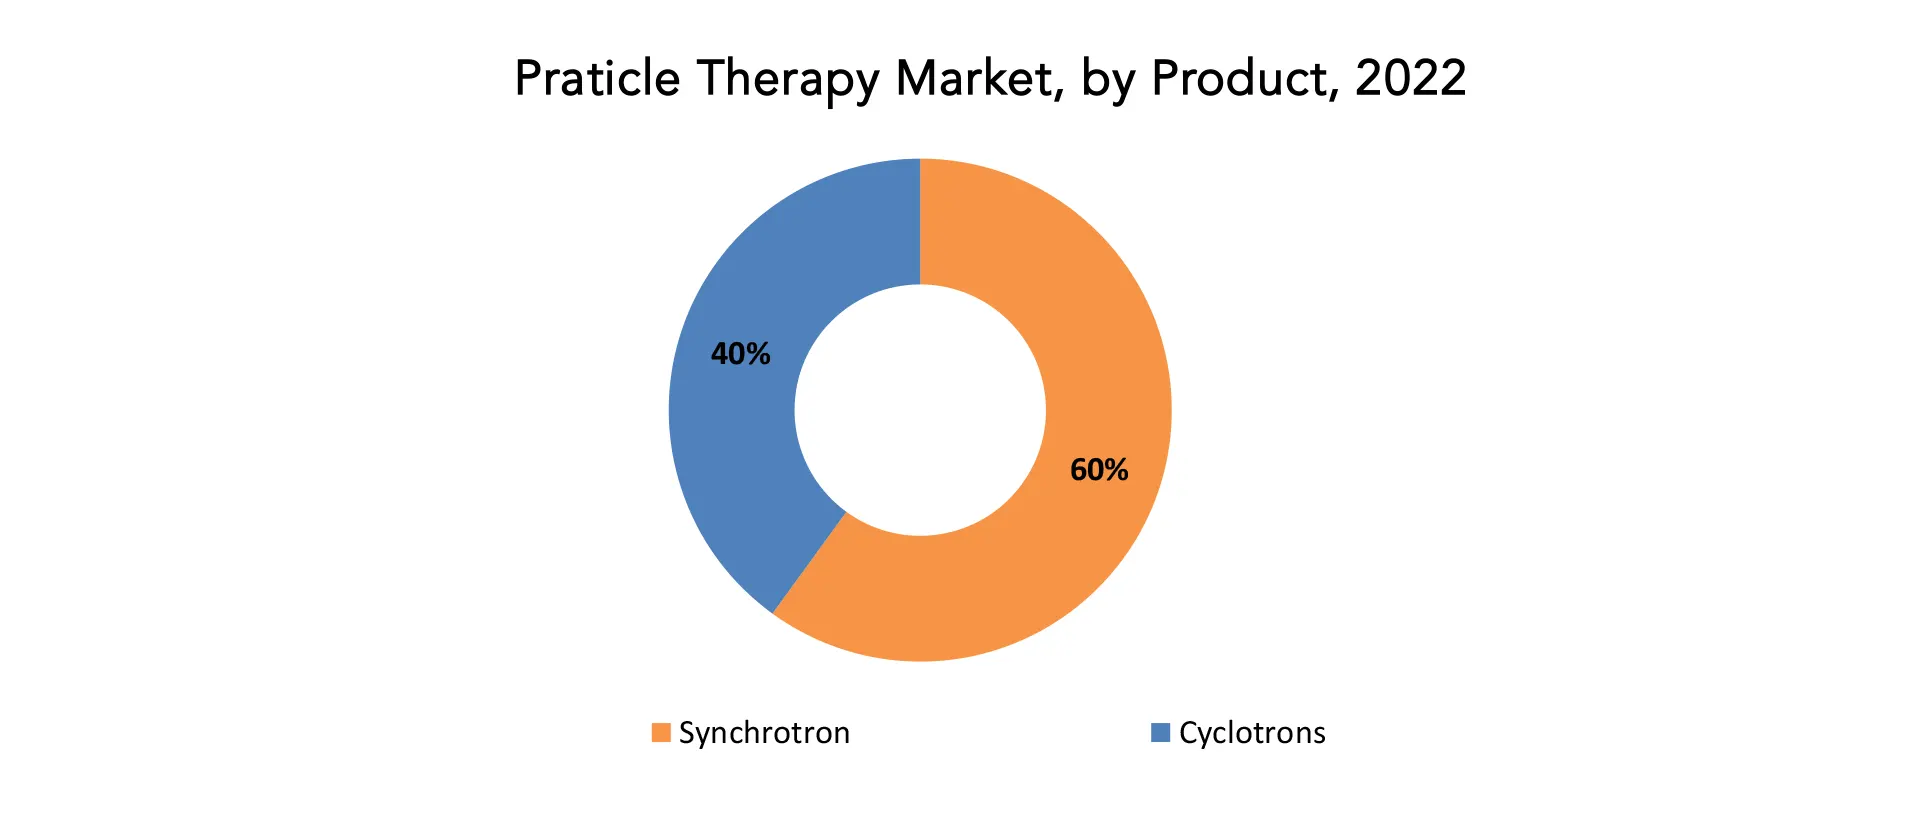
| Segmentation | By Type, By Product, By Cancer type, By End user, By Region |
| By Type
|
|
| By Product
|
|
| By Cancer type
|
|
| By End user
|
|
| By Region |
|
Frequently Asked Questions
What is the worth of particle therapy market?
The particle therapy market is expected to grow at 8% CAGR from 2023 to 2030. It is expected to reach above USD 1432.30 Million by 2030 from USD 835.73 Million in 2023.
What are some of the market's driving forces?
The particle therapy market would be driven by factors like rising cases of cancer, an increasing number of particle therapy center, low risk of treatment, and potential retreatment opportunity can trigger better market growth.
Which are the top companies to hold the market share in particle therapy market?
IBA Worldwide, Mevion Medical Systems, Varian Medical Systems, Sumitomo Heavy Industries Ltd, Hitachi Ltd, Toshiba Medical Systems Corp., Provision Healthcare LLC., Danfysik A/S, Optivus Proton Therapy, ProTom International Inc, Advanced Oncology plc, Ion Beam Application SA, Elekta AB are the major particle therapy market players.
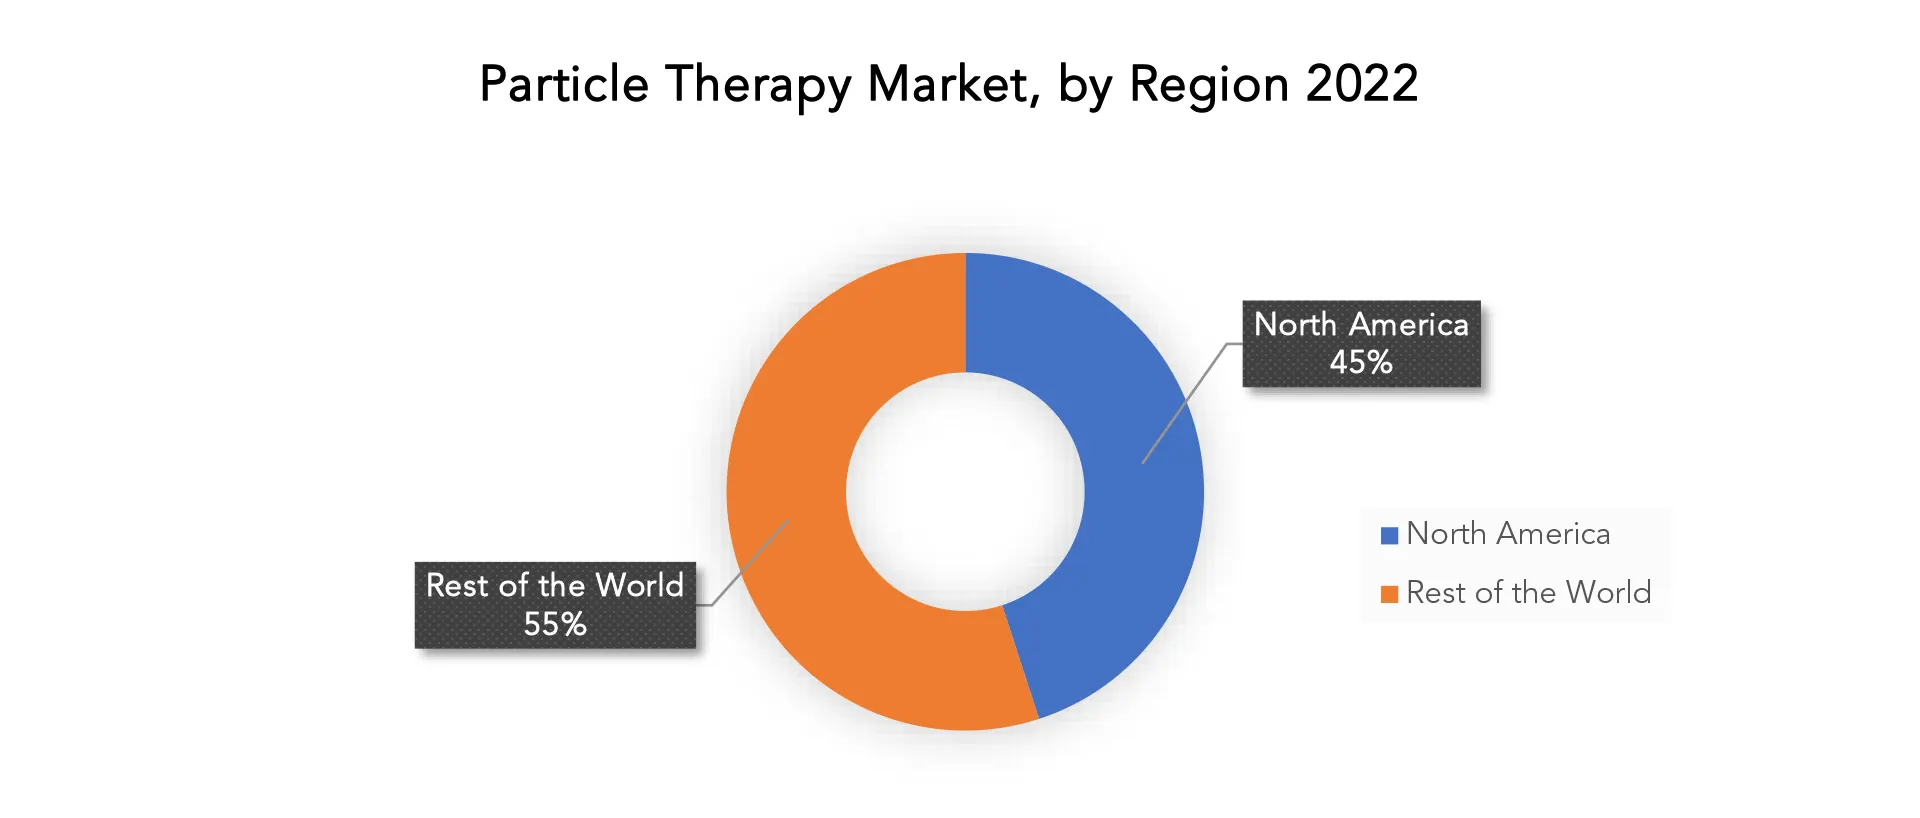
Which is the largest regional market for particle therapy market?
The region's largest share is in North America. Type that is manufactured in nations like US and Canada that perform similarly and are inexpensively accessible to the general public have led to the increasing appeal. Also, the key players such as Analog Devices, Inc., Belden Inc. play important roles.
Particle therapy Market Segment Analysis
The particle therapy market is segmented based on type, product, cancer type, end user, and region. Based on type, the particle therapy market segmentation has been divided into proton therapy, heavy ion therapy. Due to the many benefits of this therapy, the proton therapy segment had the greatest revenue share in 2022. Proton beam therapy, commonly referred to as particle therapy, is a type of radiation therapy that targets cancer cells with pinpoint accuracy. Proton treatment appears to be safer, painless, noninvasive, and more helpful than traditional radiation therapy since it can provide a large dose to a very targeted location. The American Society of Clinical Oncology (ASCO) claims that proton treatment gives the tumor a higher dose of radiation while delivering up to 60% less radiation to the surrounding healthy tissue. The precise timing and position of the proton's energy release can be chosen by the doctor in this beam therapy. This allows for maximum damage to cancer cells and little damage to adjacent tissue. [caption id="attachment_30539" align="aligncenter" width="1920"]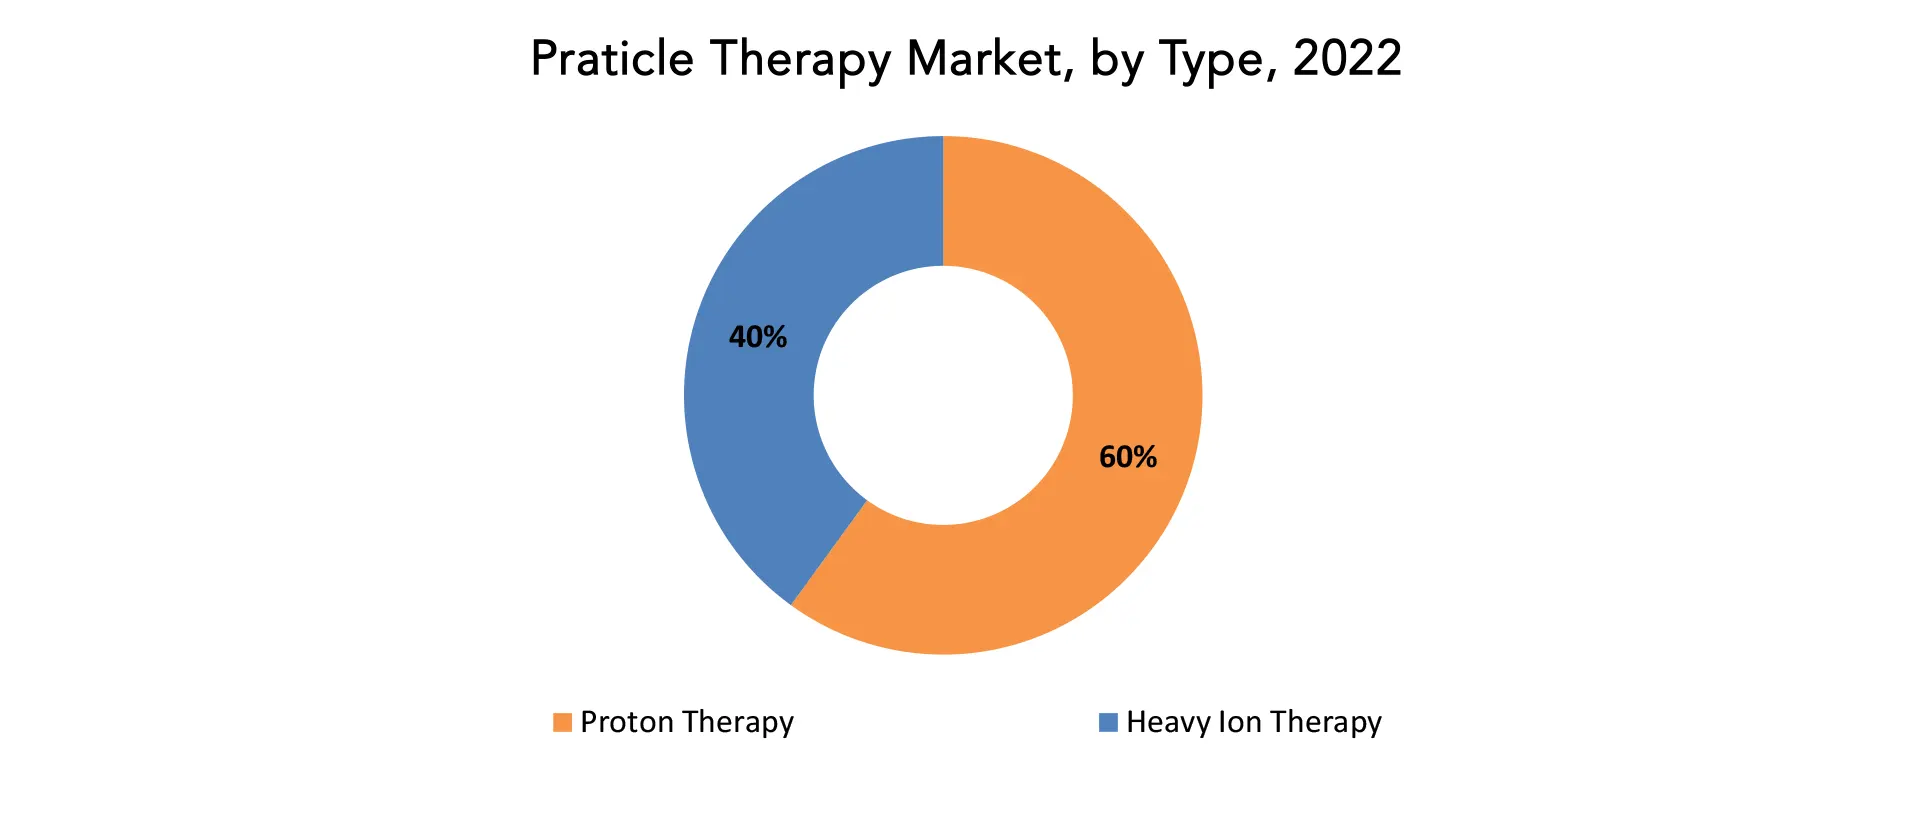
Particle Therapy Market Players
IBA Worldwide, Mevion Medical Systems, Varian Medical Systems, Sumitomo Heavy Industries Ltd, Hitachi Ltd, Toshiba Medical Systems Corp., Provision Healthcare LLC., Danfysik A/S, Optivus Proton Therapy, ProTom International Inc, Advanced Oncology plc, Ion Beam Application SA, Elekta AB are the major particle therapy market players. Recent News: 27 July, 2022: UW Health selected Hitachi, Ltd. To provide the infrastructure to support proton therapy at UW Health Eastpark Medical Center. Hitachi will provide equipment and technology to support UW Health’s traditional proton therapy room equipped with spot scanning irradiation technology. 10 January, 2023: IBA announced that it signed a contract with the H. Lee Moffitt Cancer Center and Research Institute Hospital for installation of its ProteusONE compact proton therapy system.Who Should Buy? Or Key stakeholders
- Medical Devices Manufacturers
- Medical Devices Product Distributors and Suppliers
- Healthcare Providers
- Contract Manufacturing Organizations
- Government & Regional Agencies
- Research centers Research Institute
- Investors
- Regulatory Authorities
Particle Therapy Market Regional Analysis
The Particle therapy market by region includes North America, Asia-Pacific (APAC), Europe, South America, and Middle East & Africa (MEA).- North America: includes the US, Canada, Mexico
- Asia Pacific: includes China, Japan, South Korea, India, Australia, ASEAN, and Rest of APAC
- Europe: includes UK, Germany, France, Italy, Spain, Russia, and Rest of Europe
- South America: includes Brazil, Argentina, and Rest of South America
- Middle East & Africa: includes Turkey, UAE, Saudi Arabia, South Africa, and Rest of MEA
Key Market Segments: Particle therapy Market
Particle Therapy Market By Type, 2020-2030, (USD Million)- Proton Therapy
- Heavy Ion Therapy
- Synchrotron
- Cyclotrons
- Prostate Cancer
- Lung Cancer
- Pediatric Cancer
- Breast Cancer
- Hospitals
- Research Centers
- North America
- Asia Pacific
- Europe
- South America
- Middle East And Africa
Exactitude Consultancy Services Key Objectives:
- Increasing sales and market share
- Developing new Product
- Improving profitability
- Entering new markets
- Enhancing brand reputation
Key Question Answered
- What is the expected growth rate of the particle therapy market over the next 7 years?
- Who are the major players in the particle therapy market and what is their market share?
- What are the end-user industries driving demand for market and what is their outlook?
- What are the opportunities for growth in emerging markets such as Asia-Pacific, Middle East, and Africa?
- How is the economic environment affecting the particle therapy market, including factors such as interest rates, inflation, and exchange rates?
- What is the expected impact of research centers policies and regulations on the particle therapy market?
- What is the current and forecasted size and growth rate of the global particle therapy market?
- What are the key drivers of growth in the particle therapy market?
- What are the distribution channels and supply chain dynamics in the particle therapy market?
- What are the technological advancements and innovations in the particle therapy market and their impact on product development and growth?
- What are the regulatory considerations and their impact on the market?
- What are the challenges faced by players in the particle therapy market and how are they addressing these challenges?
- What are the opportunities for growth and expansion in the particle therapy market?
- What are the product offerings and specifications of leading players in the market?
- INTRODUCTION
- MARKET DEFINITION
- MARKET SEGMENTATION
- RESEARCH TIMELINES
- ASSUMPTIONS AND LIMITATIONS
- RESEARCH METHODOLOGY
- DATA MINING
- SECONDARY RESEARCH
- PRIMARY RESEARCH
- SUBJECT-MATTER EXPERTS’ ADVICE
- QUALITY CHECKS
- FINAL REVIEW
- DATA TRIANGULATION
- BOTTOM-UP APPROACH
- TOP-DOWN APPROACH
- RESEARCH FLOW
- DATA SOURCES
- DATA MINING
- EXECUTIVE SUMMARY
- MARKET OVERVIEW
- GLOBAL PARTICLE THERAPY MARKET OUTLOOK
- MARKET DRIVERS
- MARKET RESTRAINTS
- MARKET OPPORTUNITIES
- IMPACT OF COVID-19 ON PARTICLE THERAPY MARKET
- PORTER’S FIVE FORCES MODEL
- THREAT FROM NEW ENTRANTS
- THREAT FROM SUBSTITUTES
- BARGAINING POWER OF SUPPLIERS
- BARGAINING POWER OF CUSTOMERS
- DEGREE OF COMPETITION
- END USER VALUE CHAIN ANALYSIS
- GLOBAL PARTICLE THERAPY MARKET OUTLOOK
- GLOBAL PARTICLE THERAPY MARKET BY TYPE (USD MILLION), 2020-2030
- PROTON THERAPY
- HEAVY ION THERAPY
- GLOBAL PARTICLE THERAPY MARKET BY PRODUCT (USD MILLION), 2020-2030
- SYNCHROTRON
- CYCLOTRONS
- GLOBAL PARTICLE THERAPY MARKET BY CANCER TYPE (USD MILLION), 2020-2030
- PROSTATE CANCER
- LUNG CANCER
- PEDIATRIC CANCER
- BREAST CANCER
- GLOBAL PARTICLE THERAPY MARKET BY END USER (USD MILLION), 2020-2030
- HOSPITALS
- RESEARCH CENTERS
- GLOBAL PARTICLE THERAPY MARKET BY REGION (USD MILLION), 2020-2030
- NORTH AMERICA
- US
- CANADA
- MEXICO
- SOUTH AMERICA
- BRAZIL
- ARGENTINA
- COLOMBIA
- REST OF SOUTH AMERICA
- EUROPE
- GERMANY
- UK
- FRANCE
- ITALY
- SPAIN
- RUSSIA
- REST OF EUROPE
- ASIA PACIFIC
- INDIA
- CHINA
- JAPAN
- SOUTH KOREA
- AUSTRALIA
- SOUTH-EAST ASIA
- REST OF ASIA PACIFIC
- MIDDLE EAST AND AFRICA
- UAE
- SAUDI ARABIA
- SOUTH AFRICA
- REST OF MIDDLE EAST AND AFRICA
- NORTH AMERICA
- COMPANY PROFILES*
(BUSINESS OVERVIEW, COMPANY SNAPSHOT, PRODUCTS OFFERED, RECENT DEVELOPMENTS)
- IBA WORLDWIDE
- MEVION MEDICAL SYSTEMS
- VARIAN MEDICAL SYSTEMS
- SUMITOMO HEAVY INDUSTRIES LTD
- HITACHI LTD
- TOSHIBA MEDICAL SYSTEMS CORP.
- PROVISION HEALTHCARE LLC.
- DANFYSIK A/S
- OPTIVUS PROTON THERAPY
- PROTOM INTERNATIONAL INC
- ADVANCED ONCOLOGY PLC
- ION BEAM APPLICATION SA
- ELEKTA AB
*THE COMPANY LIST IS INDICATIVE
LIST OF TABLES
TABLE 1 GLOBAL PARTICLE THERAPY MARKET BY TYPE (USD MILLION) 2020-2030
TABLE 2 GLOBAL PARTICLE THERAPY MARKET BY PRODUCT (USD MILLION) 2020-2030
TABLE 3 GLOBAL PARTICLE THERAPY MARKET BY CANCER TYPE (USD MILLION) 2020-2030
TABLE 4 GLOBAL PARTICLE THERAPY MARKET BY END USER (USD MILLION) 2020-2030
TABLE 5 GLOBAL PARTICLE THERAPY MARKET BY REGION (USD MILLION) 2020-2030
TABLE 6 NORTH AMERICA PARTICLE THERAPY MARKET BY COUNTRY (USD MILLION) 2020-2030
TABLE 7 NORTH AMERICA PARTICLE THERAPY MARKET BY TYPE (USD MILLION) 2020-2030
TABLE 8 NORTH AMERICA PARTICLE THERAPY MARKET BY PRODUCT (USD MILLION) 2020-2030
TABLE 9 NORTH AMERICA PARTICLE THERAPY MARKET BY CANCER TYPE (USD MILLION) 2020-2030
TABLE 10 NORTH AMERICA PARTICLE THERAPY MARKET BY END USER (USD MILLION) 2020-2030
TABLE 11 US PARTICLE THERAPY MARKET BY TYPE (USD MILLION) 2020-2030
TABLE 12 US PARTICLE THERAPY MARKET BY PRODUCT (USD MILLION) 2020-2030
TABLE 13 US PARTICLE THERAPY MARKET BY CANCER TYPE (USD MILLION) 2020-2030
TABLE 14 US PARTICLE THERAPY MARKET BY END USER (USD MILLION) 2020-2030
TABLE 15 CANADA PARTICLE THERAPY MARKET BY TYPE (USD MILLION) 2020-2030
TABLE 16 CANADA PARTICLE THERAPY MARKET BY PRODUCT (USD MILLION) 2020-2030
TABLE 17 CANADA PARTICLE THERAPY MARKET BY CANCER TYPE (USD MILLION) 2020-2030
TABLE 18 CANADA PARTICLE THERAPY MARKET BY END USER (USD MILLION) 2020-2030
TABLE 19 MEXICO PARTICLE THERAPY MARKET BY TYPE (USD MILLION) 2020-2030
TABLE 20 MEXICO PARTICLE THERAPY MARKET BY PRODUCT (USD MILLION) 2020-2030
TABLE 21 MEXICO PARTICLE THERAPY MARKET BY CANCER TYPE (USD MILLION) 2020-2030
TABLE 22 MEXICO PARTICLE THERAPY MARKET BY END USER (USD MILLION) 2020-2030
TABLE 23 SOUTH AMERICA PARTICLE THERAPY MARKET BY COUNTRY (USD MILLION) 2020-2030
TABLE 24 SOUTH AMERICA PARTICLE THERAPY MARKET BY TYPE (USD MILLION) 2020-2030
TABLE 25 SOUTH AMERICA PARTICLE THERAPY MARKET BY PRODUCT (USD MILLION) 2020-2030
TABLE 26 SOUTH AMERICA PARTICLE THERAPY MARKET BY CANCER TYPE (USD MILLION) 2020-2030
TABLE 27 SOUTH AMERICA PARTICLE THERAPY MARKET BY END USER (USD MILLION) 2020-2030
TABLE 28 BRAZIL PARTICLE THERAPY MARKET BY TYPE (USD MILLION) 2020-2030
TABLE 29 BRAZIL PARTICLE THERAPY MARKET BY PRODUCT (USD MILLION) 2020-2030
TABLE 30 BRAZIL PARTICLE THERAPY MARKET BY CANCER TYPE (USD MILLION) 2020-2030
TABLE 31 BRAZIL PARTICLE THERAPY MARKET BY END USER (USD MILLION) 2020-2030
TABLE 32 ARGENTINA PARTICLE THERAPY MARKET BY TYPE (USD MILLION) 2020-2030
TABLE 33 ARGENTINA PARTICLE THERAPY MARKET BY PRODUCT (USD MILLION) 2020-2030
TABLE 34 ARGENTINA PARTICLE THERAPY MARKET BY CANCER TYPE (USD MILLION) 2020-2030
TABLE 35 ARGENTINA PARTICLE THERAPY MARKET BY END USER (USD MILLION) 2020-2030
TABLE 36 COLOMBIA PARTICLE THERAPY MARKET BY TYPE (USD MILLION) 2020-2030
TABLE 37 COLOMBIA PARTICLE THERAPY MARKET BY PRODUCT (USD MILLION) 2020-2030
TABLE 38 COLOMBIA PARTICLE THERAPY MARKET BY CANCER TYPE (USD MILLION) 2020-2030
TABLE 39 COLOMBIA PARTICLE THERAPY MARKET BY END USER (USD MILLION) 2020-2030
TABLE 40 REST OF SOUTH AMERICA PARTICLE THERAPY MARKET BY TYPE (USD MILLION) 2020-2030
TABLE 41 REST OF SOUTH AMERICA PARTICLE THERAPY MARKET BY PRODUCT (USD MILLION) 2020-2030
TABLE 42 REST OF SOUTH AMERICA PARTICLE THERAPY MARKET BY CANCER TYPE (USD MILLION) 2020-2030
TABLE 43 REST OF SOUTH AMERICA PARTICLE THERAPY MARKET BY END USER (USD MILLION) 2020-2030
TABLE 44 ASIA-PACIFIC PARTICLE THERAPY MARKET BY COUNTRY (USD MILLION) 2020-2030
TABLE 45 ASIA-PACIFIC PARTICLE THERAPY MARKET BY TYPE (USD MILLION) 2020-2030
TABLE 46 ASIA-PACIFIC PARTICLE THERAPY MARKET BY PRODUCT (USD MILLION) 2020-2030
TABLE 47 ASIA-PACIFIC PARTICLE THERAPY MARKET BY CANCER TYPE (USD MILLION) 2020-2030
TABLE 48 ASIA-PACIFIC PARTICLE THERAPY MARKET BY END USER (USD MILLION) 2020-2030
TABLE 49 INDIA PARTICLE THERAPY MARKET BY TYPE (USD MILLION) 2020-2030
TABLE 50 INDIA PARTICLE THERAPY MARKET BY PRODUCT (USD MILLION) 2020-2030
TABLE 51 INDIA PARTICLE THERAPY MARKET BY CANCER TYPE (USD MILLION) 2020-2030
TABLE 52 INDIA PARTICLE THERAPY MARKET BY END USER (USD MILLION) 2020-2030
TABLE 53 CHINA PARTICLE THERAPY MARKET BY TYPE (USD MILLION) 2020-2030
TABLE 54 CHINA PARTICLE THERAPY MARKET BY PRODUCT (USD MILLION) 2020-2030
TABLE 55 CHINA PARTICLE THERAPY MARKET BY CANCER TYPE (USD MILLION) 2020-2030
TABLE 56 CHINA PARTICLE THERAPY MARKET BY END USER (USD MILLION) 2020-2030
TABLE 57 JAPAN PARTICLE THERAPY MARKET BY TYPE (USD MILLION) 2020-2030
TABLE 58 JAPAN PARTICLE THERAPY MARKET BY PRODUCT (USD MILLION) 2020-2030
TABLE 59 JAPAN PARTICLE THERAPY MARKET BY CANCER TYPE (USD MILLION) 2020-2030
TABLE 60 JAPAN PARTICLE THERAPY MARKET BY END USER (USD MILLION) 2020-2030
TABLE 61 SOUTH KOREA PARTICLE THERAPY MARKET BY TYPE (USD MILLION) 2020-2030
TABLE 62 SOUTH KOREA PARTICLE THERAPY MARKET BY PRODUCT (USD MILLION) 2020-2030
TABLE 63 SOUTH KOREA PARTICLE THERAPY MARKET BY CANCER TYPE (USD MILLION) 2020-2030
TABLE 64 SOUTH KOREA PARTICLE THERAPY MARKET BY END USER (USD MILLION) 2020-2030
TABLE 65 AUSTRALIA PARTICLE THERAPY MARKET BY TYPE (USD MILLION) 2020-2030
TABLE 66 AUSTRALIA PARTICLE THERAPY MARKET BY PRODUCT (USD MILLION) 2020-2030
TABLE 67 AUSTRALIA PARTICLE THERAPY MARKET BY CANCER TYPE (USD MILLION) 2020-2030
TABLE 68 AUSTRALIA PARTICLE THERAPY MARKET BY END USER (USD MILLION) 2020-2030
TABLE 69 SOUTH-EAST ASIA PARTICLE THERAPY MARKET BY TYPE (USD MILLION) 2020-2030
TABLE 70 SOUTH-EAST ASIA PARTICLE THERAPY MARKET BY PRODUCT (USD MILLION) 2020-2030
TABLE 71 SOUTH-EAST ASIA PARTICLE THERAPY MARKET BY CANCER TYPE (USD MILLION) 2020-2030
TABLE 72 SOUTH-EAST ASIA PARTICLE THERAPY MARKET BY END USER (USD MILLION) 2020-2030
TABLE 73 REST OF ASIA PACIFIC PARTICLE THERAPY MARKET BY TYPE (USD MILLION) 2020-2030
TABLE 74 REST OF ASIA PACIFIC PARTICLE THERAPY MARKET BY PRODUCT (USD MILLION) 2020-2030
TABLE 75 REST OF ASIA PACIFIC PARTICLE THERAPY MARKET BY CANCER TYPE (USD MILLION) 2020-2030
TABLE 76 REST OF ASIA PACIFIC PARTICLE THERAPY MARKET BY END USER (USD MILLION) 2020-2030
TABLE 77 EUROPE PARTICLE THERAPY MARKET BY COUNTRY (USD MILLION) 2020-2030
TABLE 78 EUROPE PARTICLE THERAPY MARKET BY TYPE (USD MILLION) 2020-2030
TABLE 79 EUROPE PARTICLE THERAPY MARKET BY PRODUCT (USD MILLION) 2020-2030
TABLE 80 EUROPE PARTICLE THERAPY MARKET BY CANCER TYPE (USD MILLION) 2020-2030
TABLE 81 EUROPE PARTICLE THERAPY MARKET BY END USER (USD MILLION) 2020-2030
TABLE 82 GERMANY PARTICLE THERAPY MARKET BY TYPE (USD MILLION) 2020-2030
TABLE 83 GERMANY PARTICLE THERAPY MARKET BY PRODUCT (USD MILLION) 2020-2030
TABLE 84 GERMANY PARTICLE THERAPY MARKET BY CANCER TYPE (USD MILLION) 2020-2030
TABLE 85 GERMANY PARTICLE THERAPY MARKET BY END USER (USD MILLION) 2020-2030
TABLE 86 UK PARTICLE THERAPY MARKET BY TYPE (USD MILLION) 2020-2030
TABLE 87 UK PARTICLE THERAPY MARKET BY PRODUCT (USD MILLION) 2020-2030
TABLE 88 UK PARTICLE THERAPY MARKET BY CANCER TYPE (USD MILLION) 2020-2030
TABLE 89 UK PARTICLE THERAPY MARKET BY END USER (USD MILLION) 2020-2030
TABLE 90 FRANCE PARTICLE THERAPY MARKET BY TYPE (USD MILLION) 2020-2030
TABLE 91 FRANCE PARTICLE THERAPY MARKET BY PRODUCT (USD MILLION) 2020-2030
TABLE 92 FRANCE PARTICLE THERAPY MARKET BY CANCER TYPE (USD MILLION) 2020-2030
TABLE 93 FRANCE PARTICLE THERAPY MARKET BY END USER (USD MILLION) 2020-2030
TABLE 94 ITALY PARTICLE THERAPY MARKET BY TYPE (USD MILLION) 2020-2030
TABLE 95 ITALY PARTICLE THERAPY MARKET BY PRODUCT (USD MILLION) 2020-2030
TABLE 96 ITALY PARTICLE THERAPY MARKET BY CANCER TYPE (USD MILLION) 2020-2030
TABLE 97 ITALY PARTICLE THERAPY MARKET BY END USER (USD MILLION) 2020-2030
TABLE 98 SPAIN PARTICLE THERAPY MARKET BY TYPE (USD MILLION) 2020-2030
TABLE 99 SPAIN PARTICLE THERAPY MARKET BY PRODUCT (USD MILLION) 2020-2030
TABLE 100 SPAIN PARTICLE THERAPY MARKET BY CANCER TYPE (USD MILLION) 2020-2030
TABLE 101 SPAIN PARTICLE THERAPY MARKET BY END USER (USD MILLION) 2020-2030
TABLE 102 RUSSIA PARTICLE THERAPY MARKET BY TYPE (USD MILLION) 2020-2030
TABLE 103 RUSSIA PARTICLE THERAPY MARKET BY PRODUCT (USD MILLION) 2020-2030
TABLE 104 RUSSIA PARTICLE THERAPY MARKET BY CANCER TYPE (USD MILLION) 2020-2030
TABLE 105 RUSSIA PARTICLE THERAPY MARKET BY END USER (USD MILLION) 2020-2030
TABLE 106 REST OF EUROPE PARTICLE THERAPY MARKET BY TYPE (USD MILLION) 2020-2030
TABLE 107 REST OF EUROPE PARTICLE THERAPY MARKET BY PRODUCT (USD MILLION) 2020-2030
TABLE 108 REST OF EUROPE PARTICLE THERAPY MARKET BY CANCER TYPE (USD MILLION) 2020-2030
TABLE 109 REST OF EUROPE PARTICLE THERAPY MARKET BY END USER (USD MILLION) 2020-2030
TABLE 110 MIDDLE EAST AND AFRICA PARTICLE THERAPY MARKET BY COUNTRY (USD MILLION) 2020-2030
TABLE 111 MIDDLE EAST AND AFRICA PARTICLE THERAPY MARKET BY TYPE (USD MILLION) 2020-2030
TABLE 112 MIDDLE EAST AND AFRICA PARTICLE THERAPY MARKET BY PRODUCT (USD MILLION) 2020-2030
TABLE 113 MIDDLE EAST AND AFRICA PARTICLE THERAPY MARKET BY CANCER TYPE (USD MILLION) 2020-2030
TABLE 114 MIDDLE EAST AND AFRICA PARTICLE THERAPY MARKET BY END USER (USD MILLION) 2020-2030
TABLE 115 UAE PARTICLE THERAPY MARKET BY TYPE (USD MILLION) 2020-2030
TABLE 116 UAE PARTICLE THERAPY MARKET BY PRODUCT (USD MILLION) 2020-2030
TABLE 117 UAE PARTICLE THERAPY MARKET BY CANCER TYPE (USD MILLION) 2020-2030
TABLE 118 UAE PARTICLE THERAPY MARKET BY END USER (USD MILLION) 2020-2030
TABLE 119 SAUDI ARABIA PARTICLE THERAPY MARKET BY TYPE (USD MILLION) 2020-2030
TABLE 120 SAUDI ARABIA PARTICLE THERAPY MARKET BY PRODUCT (USD MILLION) 2020-2030
TABLE 121 SAUDI ARABIA PARTICLE THERAPY MARKET BY CANCER TYPE (USD MILLION) 2020-2030
TABLE 122 SAUDI ARABIA PARTICLE THERAPY MARKET BY END USER (USD MILLION) 2020-2030
TABLE 123 SOUTH AFRICA PARTICLE THERAPY MARKET BY TYPE (USD MILLION) 2020-2030
TABLE 124 SOUTH AFRICA PARTICLE THERAPY MARKET BY PRODUCT (USD MILLION) 2020-2030
TABLE 125 SOUTH AFRICA PARTICLE THERAPY MARKET BY CANCER TYPE (USD MILLION) 2020-2030
TABLE 126 SOUTH AFRICA PARTICLE THERAPY MARKET BY END USER (USD MILLION) 2020-2030
TABLE 127 REST OF MIDDLE EAST AND AFRICA PARTICLE THERAPY MARKET BY TYPE (USD MILLION) 2020-2030
TABLE 128 REST OF MIDDLE EAST AND AFRICA PARTICLE THERAPY MARKET BY PRODUCT (USD MILLION) 2020-2030
TABLE 129 REST OF MIDDLE EAST AND AFRICA PARTICLE THERAPY MARKET BY CANCER TYPE (USD MILLION) 2020-2030
TABLE 130 REST OF MIDDLE EAST AND AFRICA PARTICLE THERAPY MARKET BY END USER (USD MILLION) 2020-2030
LIST OF FIGURES
FIGURE 1 MARKET DYNAMICS
FIGURE 2 REPORT TIMELINES: YEARS CONSIDERED
FIGURE 3 BOTTOM-UP APPROACH
FIGURE 4 RESEARCH FLOW
FIGURE 5 GLOBAL PARTICLE THERAPY MARKET BY TYPE, USD MILLION, 2020-2030
FIGURE 6 GLOBAL PARTICLE THERAPY MARKET BY PRODUCT, USD MILLION, 2020-2030
FIGURE 7 GLOBAL PARTICLE THERAPY MARKET BY CANCER TYPE, USD MILLION, 2020-2030
FIGURE 8 GLOBAL PARTICLE THERAPY MARKET BY END USER, USD MILLION, 2020-2030
FIGURE 9 GLOBAL PARTICLE THERAPY MARKET BY REGION, USD MILLION, 2020-2030
FIGURE 10 PORTER’S FIVE FORCES MODEL
FIGURE 11 GLOBAL PARTICLE THERAPY MARKET BY TYPE, USD MILLION, 2022
FIGURE 12 GLOBAL PARTICLE THERAPY MARKET BY PRODUCT, USD MILLION, 2022
FIGURE 13 GLOBAL PARTICLE THERAPY MARKET BY CANCER TYPE, USD MILLION, 2022
FIGURE 14 GLOBAL PARTICLE THERAPY MARKET BY END USER, USD MILLION, 2022
FIGURE 15 GLOBAL PARTICLE THERAPY MARKET BY REGION, USD MILLION, 2022
FIGURE 16 MARKET SHARE ANALYSIS
FIGURE 17 IBA WORLDWIDE: COMPANY SNAPSHOT
FIGURE 18 MEVION MEDICAL SYSTEMS: COMPANY SNAPSHOT
FIGURE 19 VARIAN MEDICAL SYSTEMS: COMPANY SNAPSHOT
FIGURE 20 SUMITOMO HEAVY INDUSTRIES LTD: COMPANY SNAPSHOT
FIGURE 21 HITACHI LTD: COMPANY SNAPSHOT
FIGURE 22 TOSHIBA MEDICAL SYSTEMS CORP.: COMPANY SNAPSHOT
FIGURE 23 PROVISION HEALTHCARE LLC.: COMPANY SNAPSHOT
FIGURE 24 DANFYSIK A/S: COMPANY SNAPSHOT
FIGURE 25 OPTIVUS PROTON THERAPY: COMPANY SNAPSHOT
FIGURE 26 PROTOM INTERNATIONAL INC: COMPANY SNAPSHOT
FIGURE 27 ADVANCED ONCOLOGY PLC: COMPANY SNAPSHOT
FIGURE 28 ION BEAM APPLICATION SA: COMPANY SNAPSHOT
FIGURE 29 ELEKTA AB: COMPANY SNAPSHOT
DOWNLOAD FREE SAMPLE REPORT
License Type
SPEAK WITH OUR ANALYST
Want to know more about the report or any specific requirement?
WANT TO CUSTOMIZE THE REPORT?
Our Clients Speak
We asked them to research ‘ Equipment market’ all over the world, and their whole arrangement was helpful to us. thehealthanalytics.com insightful analysis and reports contributed to our current analysis and in creating a future strategy. Besides, the te
Yosuke Mitsui
Senior Associate Construction Equipment Sales & Marketing
We asked them to research ‘Equipment market’ all over the world, and their whole arrangement was helpful to us. thehealthanalytics.com insightful analysis and reports contributed to our current analysis and in creating a future strategy. Besides, the te


