

Base Year Value ()
x.x %
x.x %
CAGR ()
x.x %
x.x %
Forecast Year Value ()
x.x %
x.x %
Historical Data Period
Largest Region
Forecast Period
Green and Bio-Solvents Market by Type (Bioalcohols, Bio Diols, Bioglycols, Lactate Esters, and D Limonene), Application (Adhesives & Sealants, Printing Ink, Industrial & Domestic Cleaners and Paints & Coatings), and by Region (North America, Europe, Asia Pacific, South America, Middle East, and Africa) Global Trends and Forecast from 2022 to 2029
Instant access to hundreds of data points and trends
- Market estimates from 2014-2029
- Competitive analysis, industry segmentation, financial benchmarks
- Incorporates SWOT, Porter's Five Forces and risk management frameworks
- PDF report or online database with Word, Excel and PowerPoint export options
- 100% money back guarantee
Green and Bio-Solvents Market Overview:
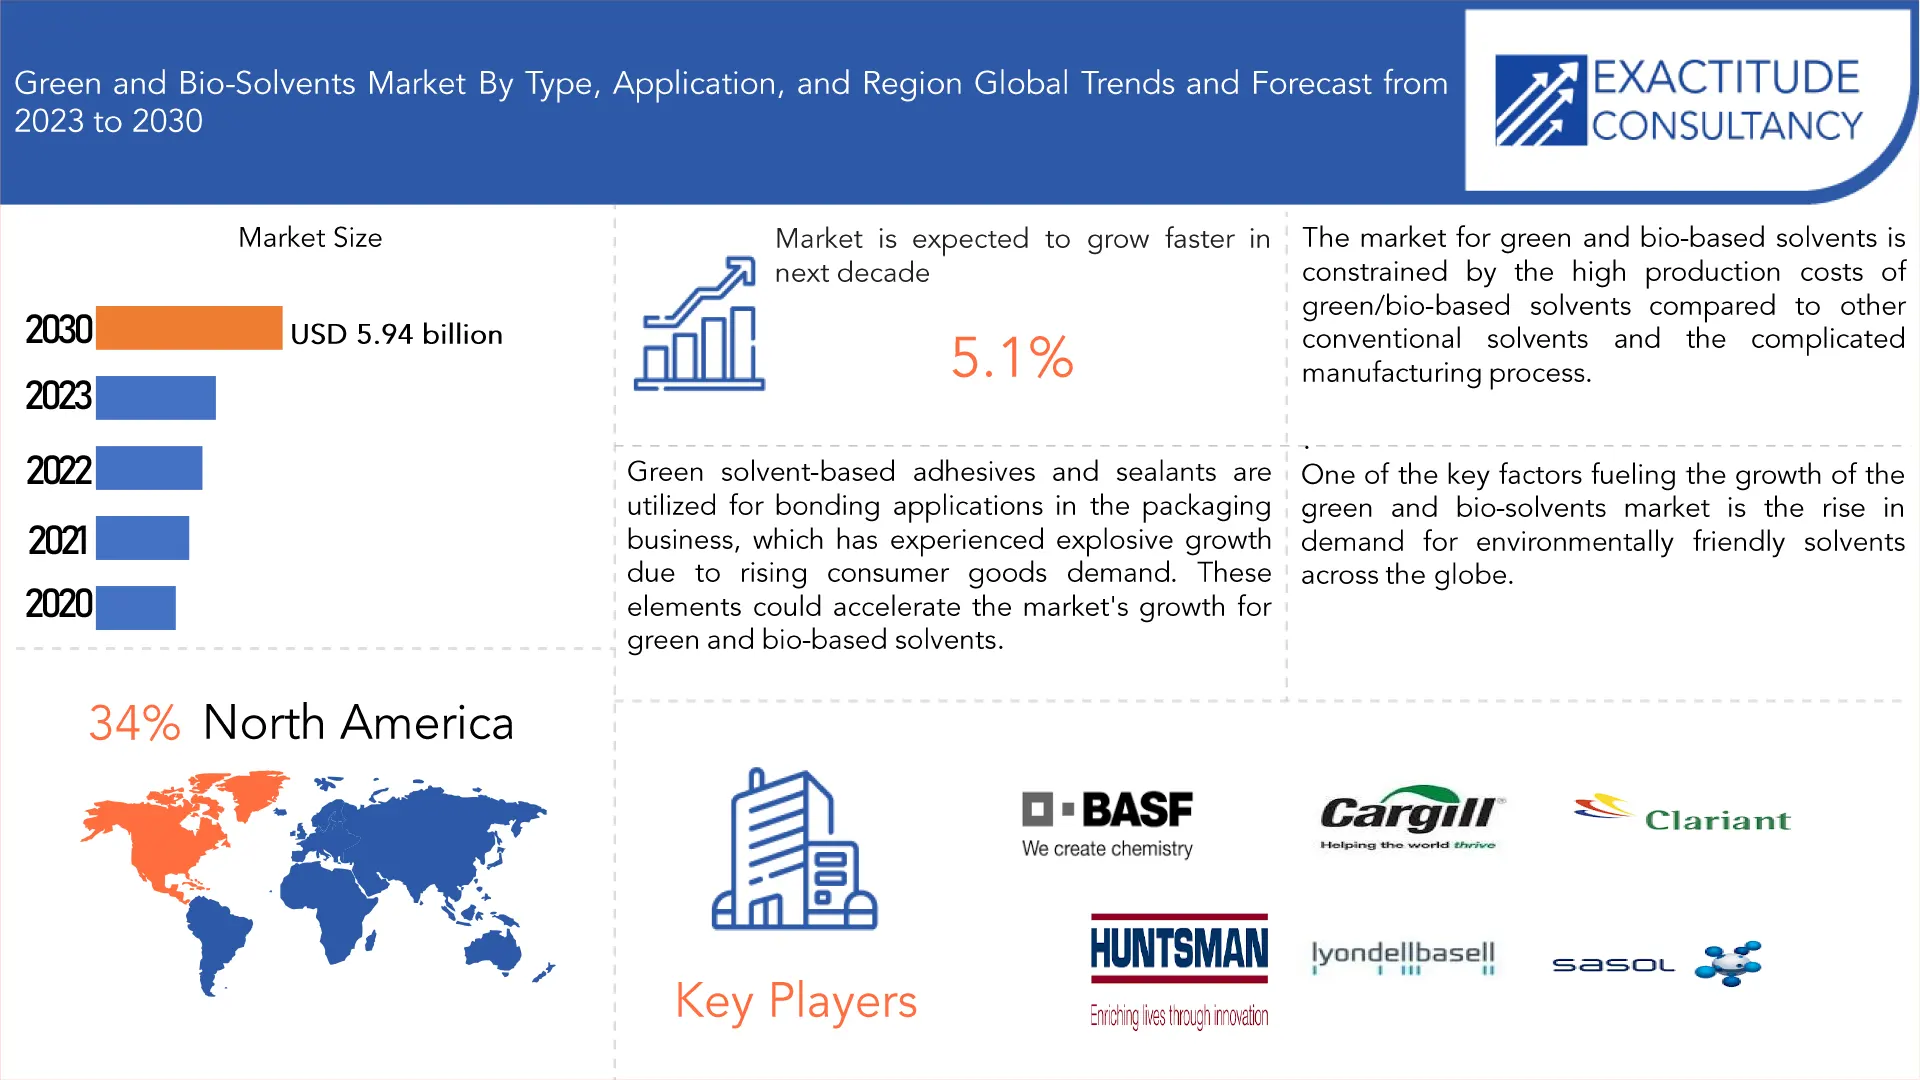
The global green and bio-solvents market was valued at 4.40 billion in 2022 and is projected to reach 6.24 billion by 2030, growing at a CAGR of 5.1% from 2023 to 2030.
Green and bio-based solvents originate from vegetable oils, lactic acid, bio-succinic acid, sugar beet, sugarcane, corn, and refined glycerin. Their production occurs within biorefineries employing equipment and processes for biomass conversion, which also yields fuel and power. These solvents contribute to the manufacture of chemical goods such as bio-glycols and bio-alcohols. Notably, they possess eco-friendly attributes, are recyclable, non-carcinogenic, non-corrosive, and biodegradable. Furthermore, they exhibit low miscibility, low toxicity, and a high boiling point, rendering them suitable alternatives to crude oil-based solvents. Predominantly, these solvents find application in sectors including paints and coatings, printing inks, industrial and domestic cleaners, adhesives, pharmaceuticals, and cosmetics.
The demand for green and bio-solvents surpasses that of conventional solvents, attributed to heightened environmental regulations, particularly in Europe and North America. Additionally, the market benefits from increased availability of green and bio-solvents with enhanced properties at reduced costs from both existing and new production facilities. These solvents serve various purposes including cleaning, plant-protection oil, wetting agents, and bio fluxing agents. Market expansion is further propelled by ongoing product innovation.
[caption id="attachment_31400" align="aligncenter" width="1920"]
The market growth is fueled by the escalating adoption of green and bio-based solvents across diverse applications such as paints and coatings, pharmaceuticals, and cosmetics. Their characteristics, notably low volatile organic compound (VOC) emissions and eco-friendly nature, position them as superior alternatives to chemical and crude oil-based solvents. Manufacturers increasingly pivot towards green solvents due to these advantageous properties, further stimulating demand across various applications.
| ATTRIBUTE | DETAILS |
| Study period | 2020-2030 |
| Base year | 2022 |
| Estimated year | 2023 |
| Forecasted year | 2023-2030 |
| Historical period | 2019-2021 |
| Unit | Value (USD Billion), Volume (Thousand Liters) |
| Segmentation | By Type, Application, and Region. |
| By Type
|
|
| By Application
|
|
| By Region
|
|
Frequently Asked Questions
• What is the worth of the global green and bio-solvents market?
The global green and bio-solvents market was valued at 4.40 billion in 2022 and is projected to reach 6.24 billion by 2030, growing at a CAGR of 5.1% from 2023 to 2030.
• Which market segments are covered in the report on the green and bio-solvents market?
Based on type, application, and region the green and bio-solvents market reports divisions are broken down.
• What is the CAGR of the green and bio-solvents market?
The global green and bio-solvents market registered a CAGR of 5.1% from 2023 to 2030. The industry segment was the highest revenue contributor to the market.
• Which are the top companies to hold the market share in the green and bio-solvents market?
Key players profiled in the report include BASF SE, Cargill Inc., Clariant, DuPont, Huntsman Corp, LyondellBasell Industries, Holdings B.V., OQ SAOC, Sasol, Solvay S.A, Vertec Biosolvents Inc., Cremer Oleo GmbH & Co. KG, GF Biochemicals, and others
• Which is the largest regional market for the green and bio-solvents market?
North America dominates the largest market for green and bio-solvents. Green and bio-solvents have a large market in North America. It has been a pioneer in terms of demand, product innovation, and the creation of applications. The US, which commands a sizable portion of the North American market, together with Canada and Mexico, are the important nations.
Green and Bio-Solvents Market Segment Analysis:
Based on type, application, and region, the global market for green and bio-solvents is divided into these categories. [caption id="attachment_31407" align="aligncenter" width="1920"]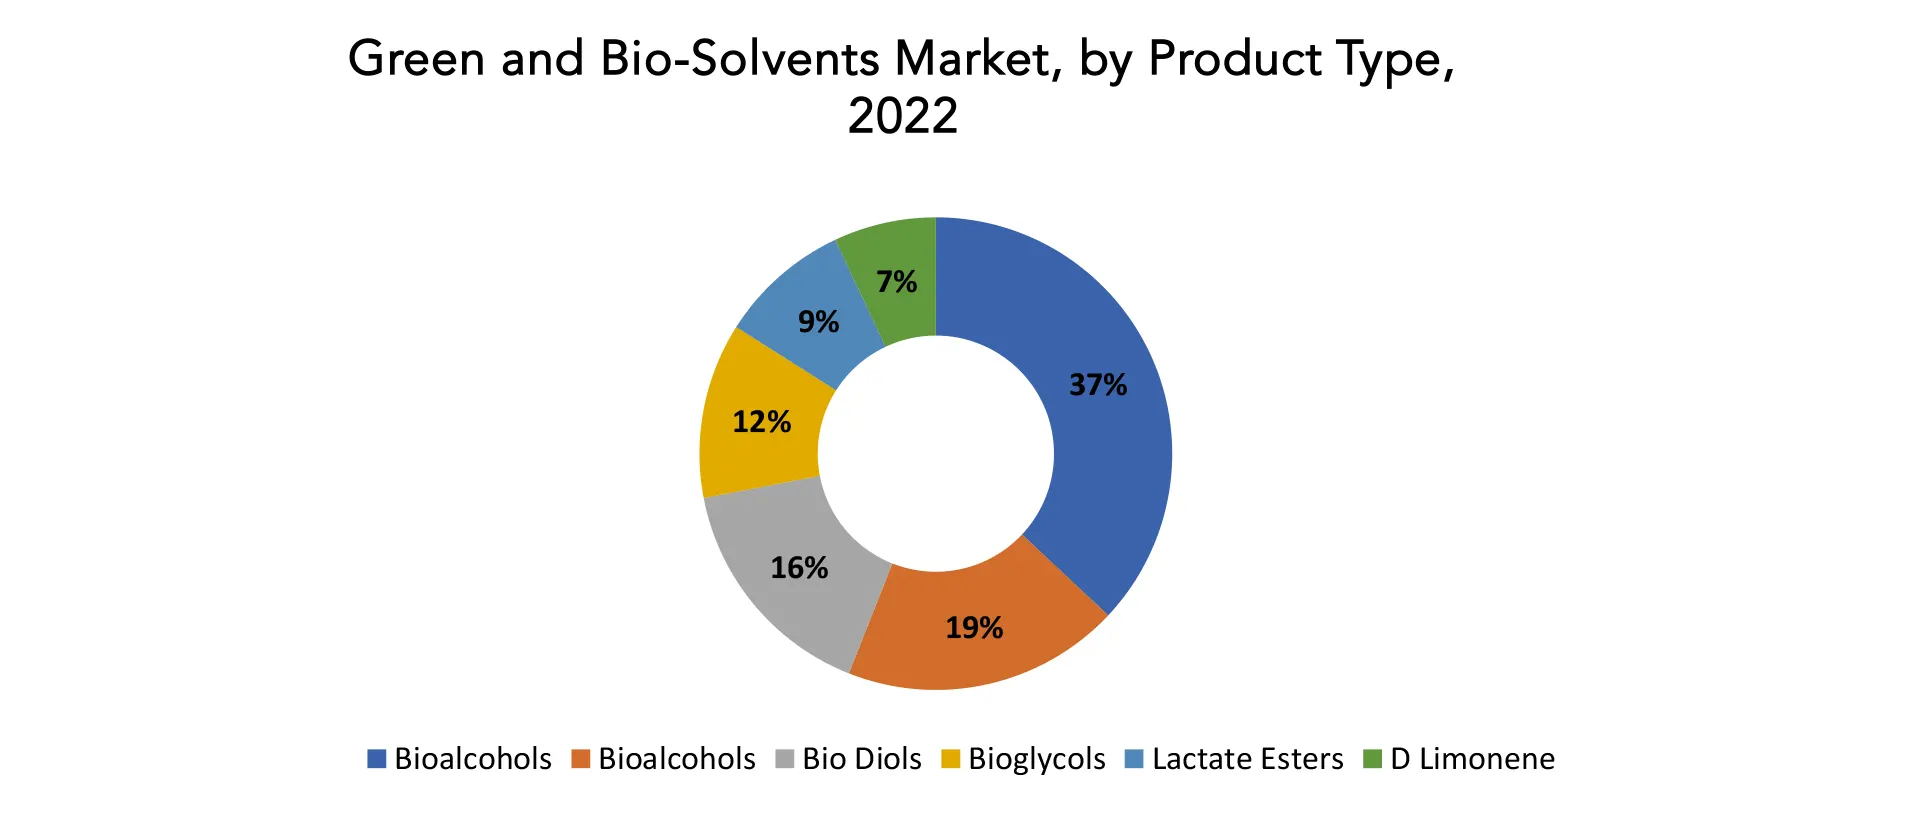
The market is segmented into bioalcohols, bio-diols, biogycols, lactate esters, and D limonene according on the type of green and bio-solvents. Bioalcohols are a fuel source for renewable energy and are also employed in the production of alcoholic beverages, cosmetics, and medications. Regarding cellulosic ethanol, in addition to employing trees, elephant yeast may also be used to produce ethanol from other crops, such as straw. Alcohols created from biological resources or biomass are known as bio-alcohols. They can be made from a variety of biomass substrates, including crops, lignocellulosic crops or leftovers, and food scraps. Due to first-generation bio-alcohols being made from crops, there may be a disagreement over whether they should be considered food or fuel. The lignocellulosic biomass substrates, such as forestry or agricultural leftovers, are used to make second-generation bio-alcohols. In a bioreactor, consolidated bioprocessing (CBP) is a multistep procedure that includes the generation of hydrolase, enzymatic hydrolysis, and microbial fermentation. BIO Distilled glycerin 99.7% and hydrogen undergo a catalytic process to produce propylene glycol. It is an environmentally friendly and renewable product manufactured of distilled glycerin from sustainably produced biodiesel, which uses vegetable oils in the transesterification process. Lactate Esters in the flavor, fragrance, and pharmaceutical industries, lactate esters are platform chemicals with a wide range of industrial applications. These esters are regarded as environmentally friendly solvents due to their favorable toxicological and environmental characteristics. While D-limonene has been used clinically to dissolve gallstones containing cholesterol since it is a solvent of cholesterol. It has also been used to treat heartburn and gastroesophageal reflux disease (GERD) due to its ability to neutralize gastric acid and encourage proper peristalsis.
[caption id="attachment_31408" align="aligncenter" width="1920"]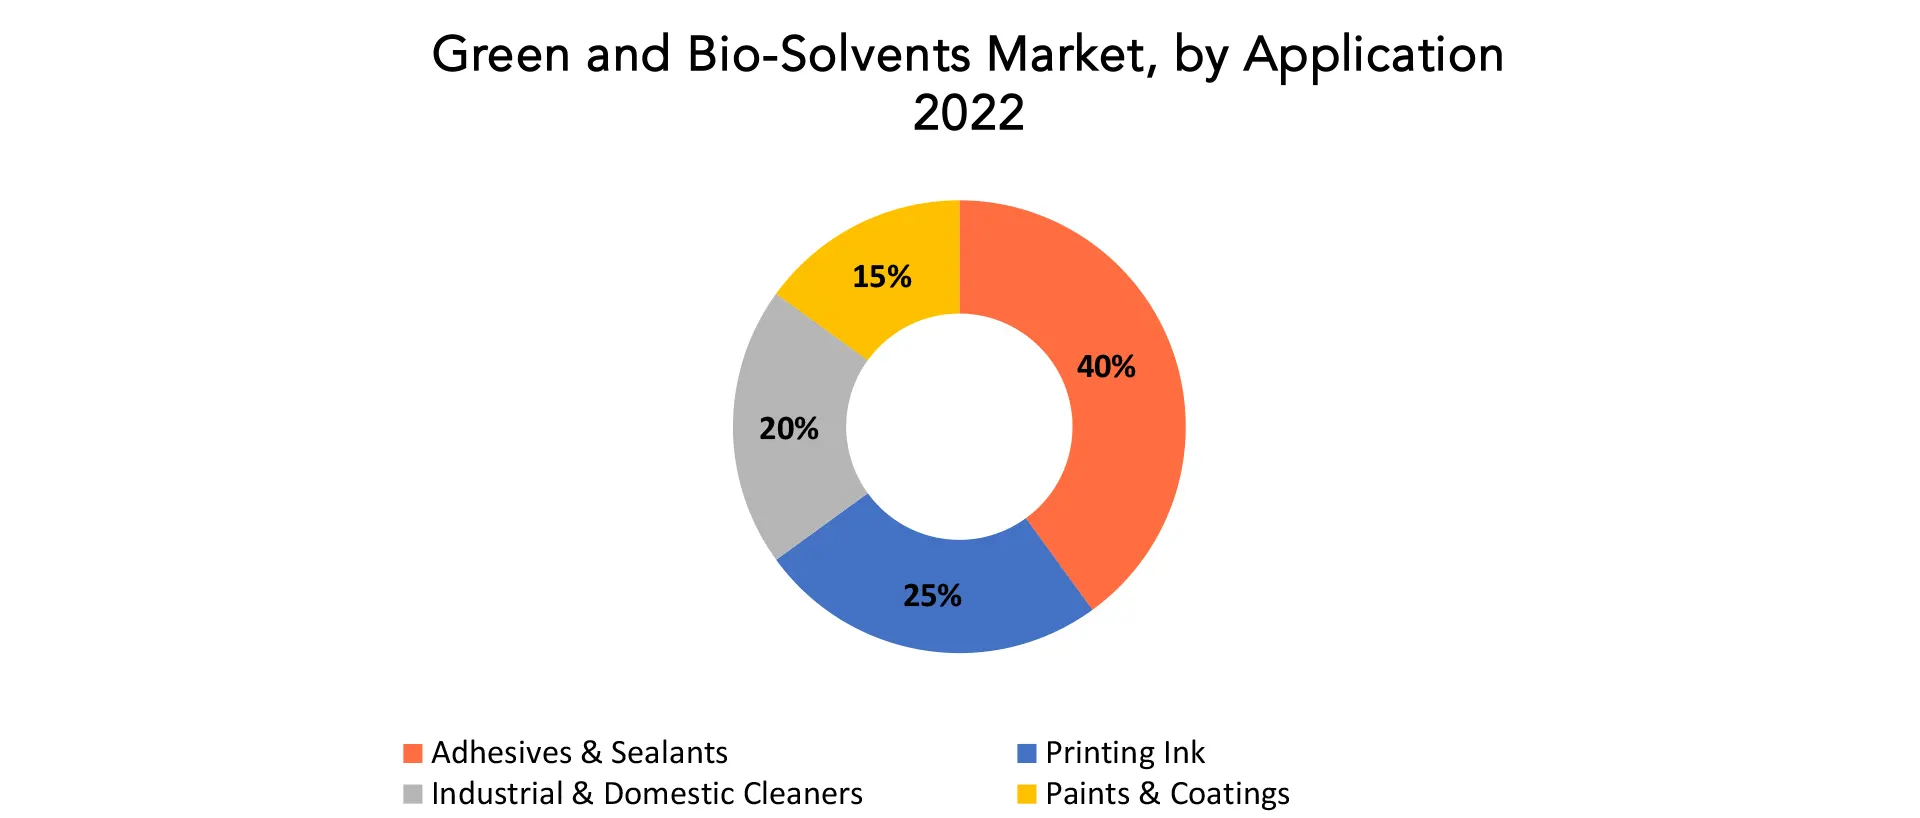
Applications of the green and bio-solvents market include adhesives and sealants, printing ink, domestic and industrial cleaners, and paints and coatings. The demand for eco-friendly paints and coatings has increased as a result of increased rules and regulations set forth by the Eco-Product Certification Scheme (ECS), the European Commission, and others in both developed and developing economies, where green/bio-based solvents are used to dissolve or disperse the components used in the paint formulation. Also, Green solvent-based adhesives and sealants are utilized for bonding applications in the packaging business, which has experienced explosive growth due to rising consumer goods demand. Green and Bio-Solvents are widely used in Industrial & Domestic Cleaners. Cleaning agents are used to get rid of impurities such as solder flux, grease, and other types of oil. The "cleaning solvent" sector of the SNAP program refers to replacements for non-aerosol solvents used in industrial cleaning processes such as vapor degreasing, cold batch cleaning, or automated cleaning machinery. Paints & Coatings is the second largest application in which Green and Bio-Solvents are used widely. Bio-solvents in paints and coatings dissolve or disperse various ingredients used in the composition of the paint (such as pigment and resin), giving the paint the correct consistency for application. Once the paint or coating is applied, the solvent evaporates, enabling resin and pigment to build a film of paint (a coat) and dry quickly. Glossy paints for indoor and outdoor use, durable and ornamental coatings, and other options are all made possible using solvents in paints. Demand for green and bio-solvents in this application category is anticipated to be driven by rising regulatory requirements in the area and rising green and bio-solvent manufacturing in China and Japan. As, the demand for eco-friendly paints and coatings has increased as a result of increased rules and regulations set forth by the Eco-Product Certification Scheme (ECS), the European Commission, and others in both developed and developing economies, where green/bio-based solvents are used to dissolve or disperse the components used in the paint formulation.
[caption id="attachment_31404" align="aligncenter" width="1920"]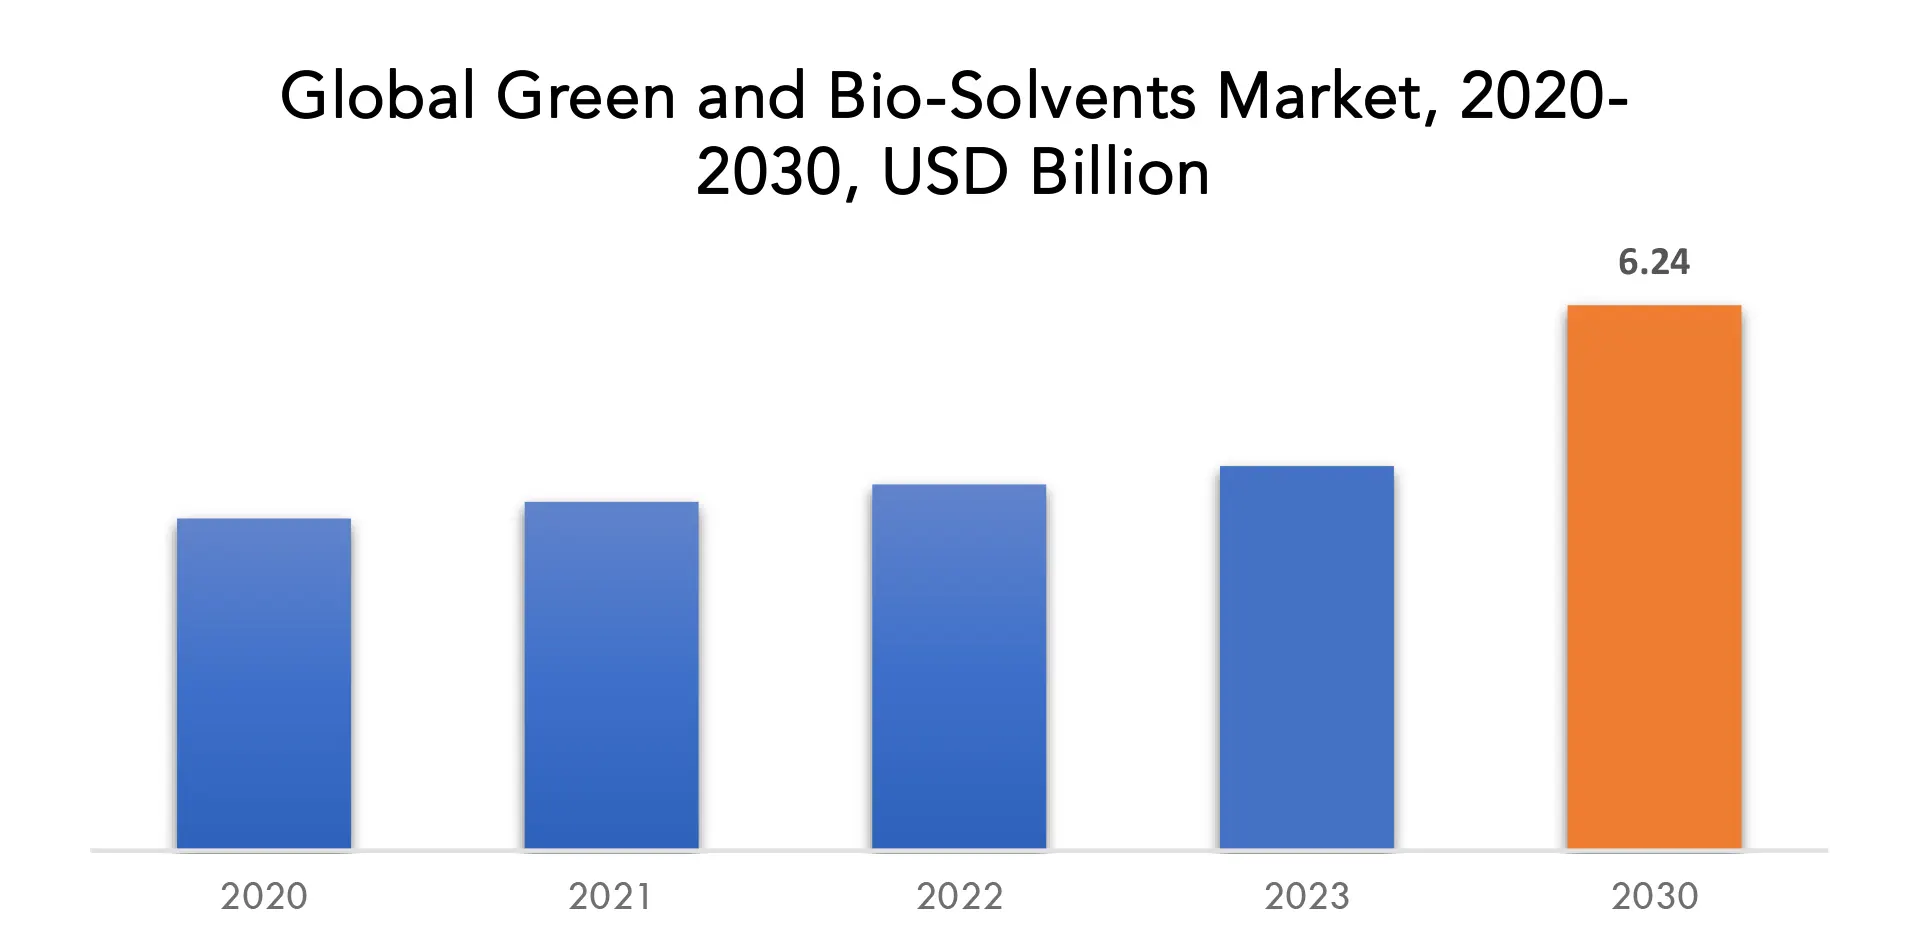
Green and Bio-Solvents Market Players:
The major players operating in the global green and bio-solvents industry include the major market players are BASF SE, Cargill Inc., Clariant, DuPont, Huntsman Corp, LyondellBasell Industries, Holdings B.V., OQ SAOC, Sasol, Solvay S.A, Vertec Biosolvents Inc., Cremer Oleo GmbH & Co. KG, GF Biochemicals, and others
Recent News- 2 May 2023: Spectrum Plastics Group was acquired by DuPont from AEA Investors.
- 1 November 2022: DuPont Terminated Intended Rogers Acquisition.
Who Should Buy? Or Key stakeholders
- Manufacturing
- End-Use Industries
- BFSI
- Automotive
- Manufacturing & Construction
- Regulatory Authorities
- Research Organizations
- Information Technology
- Materials & Chemicals
Green and Bio-Solvents Market Regional Analysis:
Geographically, the green and bio-solvents market is segmented into North America, South America, Europe, APAC, and MEA.- North America: includes the US, Canada, Mexico
- Europe: includes the UK, Germany, France, Italy, Spain, Russia, and the Rest of Europe
- Asia Pacific: includes China, Japan, South Korea, India, Australia, ASEAN, and the Rest of APAC
- South America: includes Brazil, Argentina, and the Rest of South America
- Middle East & Africa: includes Turkey, UAE, Saudi Arabia, South Africa, and the Rest of MEA
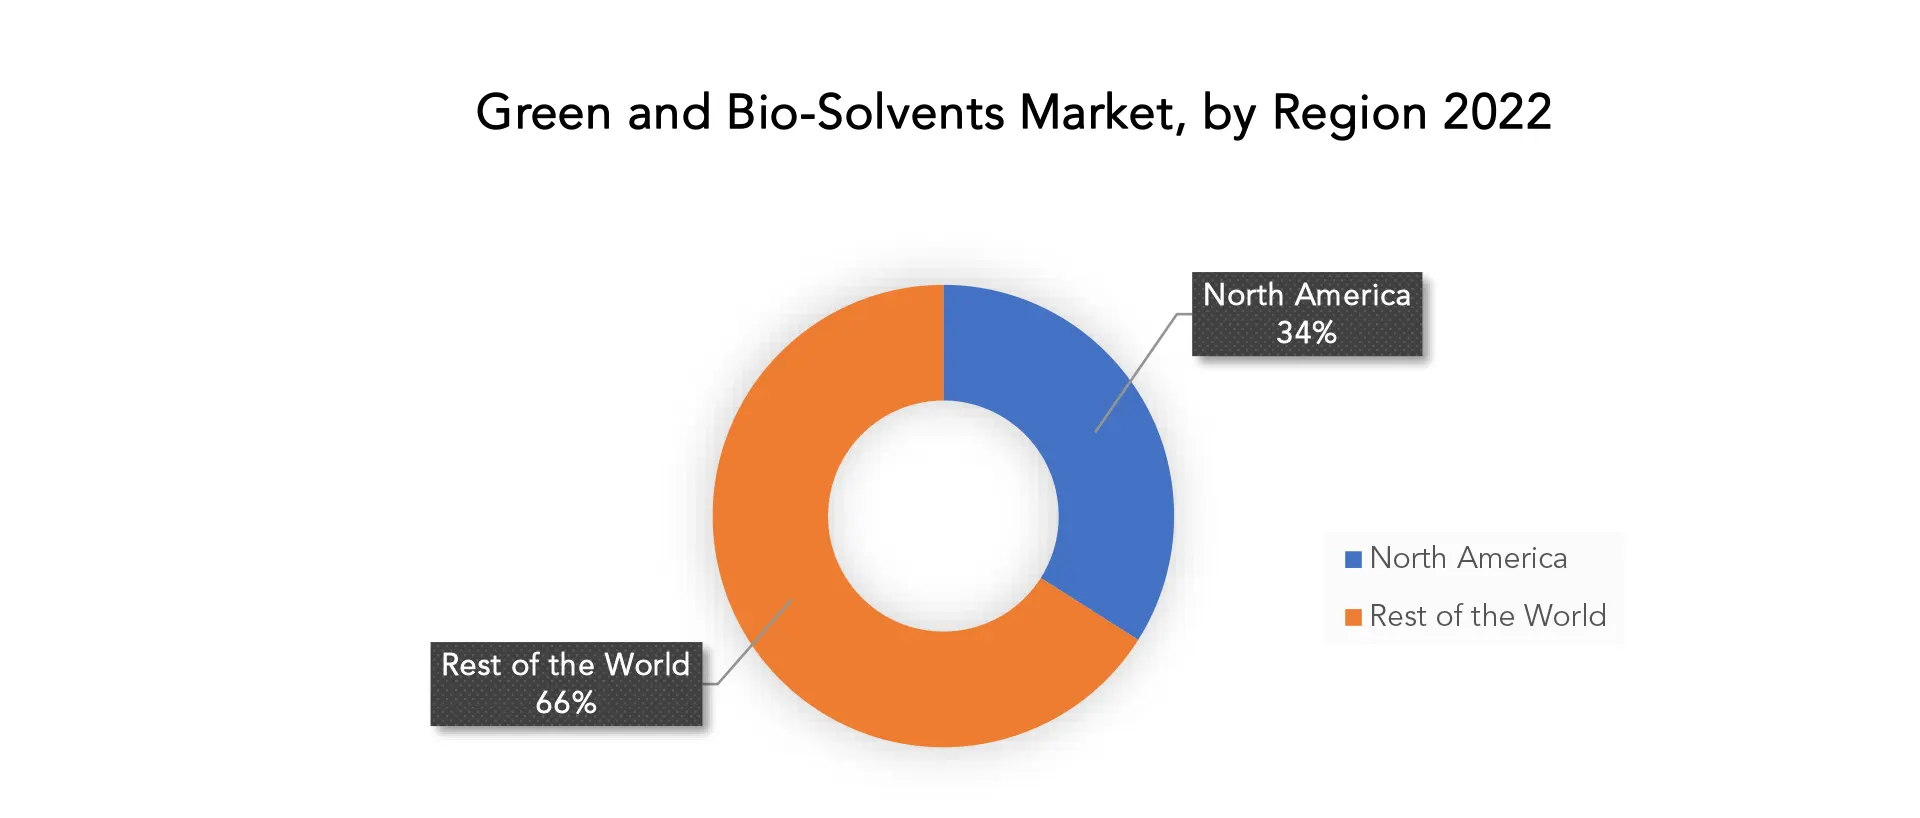
North America is the largest market for green and bio-solvents. It has been a pioneer in terms of demand, product innovation, and the creation of applications. The US, which commands a sizable portion of the North American market, together with Canada and Mexico, are the important nations. Although it is a small market, Mexico has seen encouraging demand, which is anticipated to continue soon. Government authorities and businesses in North America are being compelled by consumer demand for greener solvents to switch from petrochemical-based solvents to bio-solvents. Also, the rising availability of raw materials and the presence of significant manufacturers in North America can be largely blamed for the market's expansion. The increase in demand for bio-solvents in North America, which is supported by rising consumer awareness and ongoing product innovation in terms of quality and application development, is another factor contributing to the regional market's expansion. North American ethylene plants are switching from naphtha generated from petroleum to feedstock based on natural gas as shale gas production rises. Several commodity chemicals are finding competitive starting materials in sugars, glycerol, and other plant-based products. This is anticipated to accelerate market expansion in the area. So, North America contributes the largest market for the green and bio-solvents Market.
Key Market Segments: Green and Bio-Solvents Market
Green and Bio-Solvents Market by Type, 2020-2030, (USD Billion) (Thousand Liters)- Bioalcohols
- Bio Diols
- Biogycols
- Lactate Esters
- D Limonene
- Adhesives & Sealants
- Printing Ink
- Industrial & Domestic Cleaners
- Paints & Coatings
- North America
- Europe
- Asia Pacific
- South America
- Middle East and Africa
Exactitude Consultancy Services Key Objectives:
- Increasing sales and market share
- Developing new technology
- Improving profitability
- Entering new markets
- Enhancing brand reputation
Key Question Answered
- What is the expected growth rate of the green and bio-solvents market over the next 7 years?
- Who are the major players in the green and bio-solvents market and what is their market share?
- What are the end-user industries driving demand for the market and what is their outlook?
- What are the opportunities for growth in emerging markets such as Asia-Pacific, the middle east, and Africa?
- How is the economic environment affecting the green and bio-solvents market, including factors such as interest rates, inflation, and exchange rates?
- What is the expected impact of government policies and regulations on the green and bio-solvents market?
- What is the current and forecasted size and growth rate of the global green and bio-solvents market?
- What are the key drivers of growth in the green and bio-solvents market?
- Who are the major players in the market and what is their market share?
- What are the distribution channels and supply chain dynamics in the green and bio-solvents market?
- What are the technological advancements and innovations in the green and bio-solvents market and their impact on product development and growth?
- What are the regulatory considerations and their impact on the market?
- What are the challenges faced by players in the green and bio-solvents market and how are they addressing these challenges?
- What are the opportunities for growth and expansion in the green and bio-solvents market?
- What are the Product offerings and specifications of leading players in the market?
- INTRODUCTION
- MARKET DEFINITION
- MARKET SEGMENTATION
- RESEARCH TIMELINES
- ASSUMPTIONS AND LIMITATIONS
- RESEARCH METHODOLOGY
- DATA MINING
- SECONDARY RESEARCH
- PRIMARY RESEARCH
- SUBJECT-MATTER EXPERTS’ ADVICE
- QUALITY CHECKS
- FINAL REVIEW
- DATA TRIANGULATION
- BOTTOM-UP APPROACH
- TOP-DOWN APPROACH
- RESEARCH FLOW
- DATA SOURCES
- DATA MINING
- EXECUTIVE SUMMARY
- MARKET OVERVIEW
- GLOBAL GREEN AND BIO-BASED SOLVENTS MARKET OUTLOOK
- MARKET DRIVERS
- MARKET RESTRAINTS
- MARKET OPPORTUNITIES
- IMPACT OF COVID-19 ON THE GREEN AND BIO-BASED SOLVENTS MARKET
- PORTER’S FIVE FORCES MODEL
- THREAT FROM NEW ENTRANTS
- THREAT FROM SUBSTITUTES
- BARGAINING POWER OF SUPPLIERS
- BARGAINING POWER OF CUSTOMERS
- DEGREE OF COMPETITION
- INDUSTRY VALUE CHAIN ANALYSIS
- GLOBAL GREEN AND BIO-BASED SOLVENTS MARKET OUTLOOK
- GLOBAL GREEN AND BIO-BASED SOLVENTS MARKET BY TYPE, 2020-2030, (USD BILLION) (THOUSAND LITERS)
- BIOALCOHOLS
- BIO DIOLS
- BIOGYCOLS
- LACTATE ESTERS
- D LIMONENE
- GLOBAL GREEN AND BIO-BASED SOLVENTS MARKET BY APPLICATION, 2020-2030, (USD BILLION) (THOUSAND LITERS)
- ADHESIVES & SEALANTS
- PRINTING INK
- INDUSTRIAL & DOMESTIC CLEANERS
- PAINTS & COATINGS
- GLOBAL GREEN AND BIO-BASED SOLVENTS MARKET BY REGION, 2020-2030, (USD BILLION) (THOUSAND LITERS)
- NORTH AMERICA
- US
- CANADA
- MEXICO
- SOUTH AMERICA
- BRAZIL
- ARGENTINA
- COLOMBIA
- REST OF SOUTH AMERICA
- EUROPE
- GERMANY
- UK
- FRANCE
- ITALY
- SPAIN
- RUSSIA
- REST OF EUROPE
- ASIA PACIFIC
- INDIA
- CHINA
- JAPAN
- SOUTH KOREA
- AUSTRALIA
- SOUTH-EAST ASIA
- REST OF ASIA PACIFIC
- MIDDLE EAST AND AFRICA
- UAE
- SAUDI ARABIA
- SOUTH AFRICA
- REST OF MIDDLE EAST AND AFRICA
- NORTH AMERICA
- COMPANY PROFILES*
(BUSINESS OVERVIEW, COMPANY SNAPSHOT, PRODUCTS OFFERED, RECENT DEVELOPMENTS)
- BASF SE
- CARGILL INC.
- CLARIANT
- DUPONT
- HUNTSMAN CORP
- LYONDELLBASELL INDUSTRIES HOLDINGS B.V.
- OQ SAOC
- SASOL
- SOLVAY S.A
- VERTEC BIOSOLVENTS INC.
- CREMER OLEO GMBH & CO. KG
- GF BIOCHEMICALS *THE COMPANY LIST IS INDICATIVE
LIST OF TABLES
TABLE 1 GLOBAL GREEN AND BIO-BASED SOLVENTS MARKET BY TYPE (USD BILLION) 2020-2030
TABLE 2 GLOBAL GREEN AND BIO-BASED SOLVENTS MARKET BY TYPE (THOUSAND LITERS) 2020-2030
TABLE 3 GLOBAL GREEN AND BIO-BASED SOLVENTS MARKET BY APPLICATION (USD BILLION) 2020-2030
TABLE 4 GLOBAL GREEN AND BIO-BASED SOLVENTS MARKET BY APPLICATION (THOUSAND LITERS) 2020-2030
TABLE 5 GLOBAL GREEN AND BIO-BASED SOLVENTS MARKET BY REGION (USD BILLION) 2020-2030
TABLE 6 GLOBAL GREEN AND BIO-BASED SOLVENTS MARKET BY REGION (THOUSAND LITERS) 2020-2030
TABLE 7 NORTH AMERICA GREEN AND BIO-BASED SOLVENTS MARKET BY TYPE (USD BILLION) 2020-2030
TABLE 8 NORTH AMERICA GREEN AND BIO-BASED SOLVENTS MARKET BY TYPE (THOUSAND LITERS) 2020-2030
TABLE 9 NORTH AMERICA GREEN AND BIO-BASED SOLVENTS MARKET BY APPLICATION (USD BILLION) 2020-2030
TABLE 10 NORTH AMERICA GREEN AND BIO-BASED SOLVENTS MARKET BY APPLICATION (THOUSAND LITERS) 2020-2030
TABLE 11 NORTH AMERICA GREEN AND BIO-BASED SOLVENTS MARKET BY COUNTRY (USD BILLION) 2020-2030
TABLE 12 NORTH AMERICA GREEN AND BIO-BASED SOLVENTS MARKET BY COUNTRY (THOUSAND LITERS) 2020-2030
TABLE 13 US GREEN AND BIO-BASED SOLVENTS MARKET BY TYPE (USD BILLION) 2020-2030
TABLE 14 US GREEN AND BIO-BASED SOLVENTS MARKET BY TYPE (THOUSAND LITERS) 2020-2030
TABLE 15 US GREEN AND BIO-BASED SOLVENTS MARKET BY APPLICATION (USD BILLION) 2020-2030
TABLE 16 US GREEN AND BIO-BASED SOLVENTS MARKET BY APPLICATION (THOUSAND LITERS) 2020-2030
TABLE 17 CANADA GREEN AND BIO-BASED SOLVENTS MARKET BY TYPE (USD BILLION) 2020-2030
TABLE 18 CANADA GREEN AND BIO-BASED SOLVENTS MARKET BY TYPE (THOUSAND LITERS) 2020-2030
TABLE 19 CANADA GREEN AND BIO-BASED SOLVENTS MARKET BY APPLICATION (USD BILLION) 2020-2030
TABLE 20 CANADA GREEN AND BIO-BASED SOLVENTS MARKET BY APPLICATION (THOUSAND LITERS) 2020-2030
TABLE 21 MEXICO GREEN AND BIO-BASED SOLVENTS MARKET BY TYPE (USD BILLION) 2020-2030
TABLE 22 MEXICO GREEN AND BIO-BASED SOLVENTS MARKET BY TYPE (THOUSAND LITERS) 2020-2030
TABLE 23 MEXICO GREEN AND BIO-BASED SOLVENTS MARKET BY APPLICATION (USD BILLION) 2020-2030
TABLE 24 MEXICO GREEN AND BIO-BASED SOLVENTS MARKET BY APPLICATION (THOUSAND LITERS) 2020-2030
TABLE 25 SOUTH AMERICA GREEN AND BIO-BASED SOLVENTS MARKET BY TYPE (USD BILLION) 2020-2030
TABLE 26 SOUTH AMERICA GREEN AND BIO-BASED SOLVENTS MARKET BY TYPE (THOUSAND LITERS) 2020-2030
TABLE 27 SOUTH AMERICA GREEN AND BIO-BASED SOLVENTS MARKET BY APPLICATION (USD BILLION) 2020-2030
TABLE 28 SOUTH AMERICA GREEN AND BIO-BASED SOLVENTS MARKET BY APPLICATION (THOUSAND LITERS) 2020-2030
TABLE 29 SOUTH AMERICA GREEN AND BIO-BASED SOLVENTS MARKET BY COUNTRY (USD BILLION) 2020-2030
TABLE 30 SOUTH AMERICA GREEN AND BIO-BASED SOLVENTS MARKET BY COUNTRY (THOUSAND LITERS) 2020-2030
TABLE 31 BRAZIL GREEN AND BIO-BASED SOLVENTS MARKET BY TYPE (USD BILLION) 2020-2030
TABLE 32 BRAZIL GREEN AND BIO-BASED SOLVENTS MARKET BY TYPE (THOUSAND LITERS) 2020-2030
TABLE 33 BRAZIL GREEN AND BIO-BASED SOLVENTS MARKET BY APPLICATION (USD BILLION) 2020-2030
TABLE 34 BRAZIL GREEN AND BIO-BASED SOLVENTS MARKET BY APPLICATION (THOUSAND LITERS) 2020-2030
TABLE 35 ARGENTINA GREEN AND BIO-BASED SOLVENTS MARKET BY TYPE (USD BILLION) 2020-2030
TABLE 36 ARGENTINA GREEN AND BIO-BASED SOLVENTS MARKET BY TYPE (THOUSAND LITERS) 2020-2030
TABLE 37 ARGENTINA GREEN AND BIO-BASED SOLVENTS MARKET BY APPLICATION (USD BILLION) 2020-2030
TABLE 38 ARGENTINA GREEN AND BIO-BASED SOLVENTS MARKET BY APPLICATION (THOUSAND LITERS) 2020-2030
TABLE 39 COLOMBIA GREEN AND BIO-BASED SOLVENTS MARKET BY TYPE (USD BILLION) 2020-2030
TABLE 40 COLOMBIA GREEN AND BIO-BASED SOLVENTS MARKET BY TYPE (THOUSAND LITERS) 2020-2030
TABLE 41 COLOMBIA GREEN AND BIO-BASED SOLVENTS MARKET BY APPLICATION (USD BILLION) 2020-2030
TABLE 42 COLOMBIA GREEN AND BIO-BASED SOLVENTS MARKET BY APPLICATION (THOUSAND LITERS) 2020-2030
TABLE 43 REST OF SOUTH AMERICA GREEN AND BIO-BASED SOLVENTS MARKET BY TYPE (USD BILLION) 2020-2030
TABLE 44 REST OF SOUTH AMERICA GREEN AND BIO-BASED SOLVENTS MARKET BY TYPE (THOUSAND LITERS) 2020-2030
TABLE 45 REST OF SOUTH AMERICA GREEN AND BIO-BASED SOLVENTS MARKET BY APPLICATION (USD BILLION) 2020-2030
TABLE 46 REST OF SOUTH AMERICA GREEN AND BIO-BASED SOLVENTS MARKET BY APPLICATION (THOUSAND LITERS) 2020-2030
TABLE 47 ASIA-PACIFIC GREEN AND BIO-BASED SOLVENTS MARKET BY TYPE (USD BILLION) 2020-2030
TABLE 48 ASIA-PACIFIC GREEN AND BIO-BASED SOLVENTS MARKET BY TYPE (THOUSAND LITERS) 2020-2030
TABLE 49 ASIA-PACIFIC GREEN AND BIO-BASED SOLVENTS MARKET BY APPLICATION (USD BILLION) 2020-2030
TABLE 50 ASIA-PACIFIC GREEN AND BIO-BASED SOLVENTS MARKET BY APPLICATION (THOUSAND LITERS) 2020-2030
TABLE 51 ASIA-PACIFIC GREEN AND BIO-BASED SOLVENTS MARKET BY COUNTRY (USD BILLION) 2020-2030
TABLE 52 ASIA-PACIFIC GREEN AND BIO-BASED SOLVENTS MARKET BY COUNTRY (THOUSAND LITERS) 2020-2030
TABLE 53 INDIA GREEN AND BIO-BASED SOLVENTS MARKET BY TYPE (USD BILLION) 2020-2030
TABLE 54 INDIA GREEN AND BIO-BASED SOLVENTS MARKET BY TYPE (THOUSAND LITERS) 2020-2030
TABLE 55 INDIA GREEN AND BIO-BASED SOLVENTS MARKET BY APPLICATION (USD BILLION) 2020-2030
TABLE 56 INDIA GREEN AND BIO-BASED SOLVENTS MARKET BY APPLICATION (THOUSAND LITERS) 2020-2030
TABLE 57 CHINA GREEN AND BIO-BASED SOLVENTS MARKET BY TYPE (USD BILLION) 2020-2030
TABLE 58 CHINA GREEN AND BIO-BASED SOLVENTS MARKET BY TYPE (THOUSAND LITERS) 2020-2030
TABLE 59 CHINA GREEN AND BIO-BASED SOLVENTS MARKET BY APPLICATION (USD BILLION) 2020-2030
TABLE 60 CHINA GREEN AND BIO-BASED SOLVENTS MARKET BY APPLICATION (THOUSAND LITERS) 2020-2030
TABLE 61 JAPAN GREEN AND BIO-BASED SOLVENTS MARKET BY TYPE (USD BILLION) 2020-2030
TABLE 62 JAPAN GREEN AND BIO-BASED SOLVENTS MARKET BY TYPE (THOUSAND LITERS) 2020-2030
TABLE 63 JAPAN GREEN AND BIO-BASED SOLVENTS MARKET BY APPLICATION (USD BILLION) 2020-2030
TABLE 64 JAPAN GREEN AND BIO-BASED SOLVENTS MARKET BY APPLICATION (THOUSAND LITERS) 2020-2030
TABLE 65 SOUTH KOREA GREEN AND BIO-BASED SOLVENTS MARKET BY TYPE (USD BILLION) 2020-2030
TABLE 66 SOUTH KOREA GREEN AND BIO-BASED SOLVENTS MARKET BY TYPE (THOUSAND LITERS) 2020-2030
TABLE 67 SOUTH KOREA GREEN AND BIO-BASED SOLVENTS MARKET BY APPLICATION (USD BILLION) 2020-2030
TABLE 68 SOUTH KOREA GREEN AND BIO-BASED SOLVENTS MARKET BY APPLICATION (THOUSAND LITERS) 2020-2030
TABLE 69 AUSTRALIA GREEN AND BIO-BASED SOLVENTS MARKET BY TYPE (USD BILLION) 2020-2030
TABLE 70 AUSTRALIA GREEN AND BIO-BASED SOLVENTS MARKET BY TYPE (THOUSAND LITERS) 2020-2030
TABLE 71 AUSTRALIA GREEN AND BIO-BASED SOLVENTS MARKET BY APPLICATION (USD BILLION) 2020-2030
TABLE 72 AUSTRALIA GREEN AND BIO-BASED SOLVENTS MARKET BY APPLICATION (THOUSAND LITERS) 2020-2030
TABLE 73 SOUTH-EAST ASIA GREEN AND BIO-BASED SOLVENTS MARKET BY TYPE (USD BILLION) 2020-2030
TABLE 74 SOUTH-EAST ASIA GREEN AND BIO-BASED SOLVENTS MARKET BY TYPE (THOUSAND LITERS) 2020-2030
TABLE 75 SOUTH-EAST ASIA GREEN AND BIO-BASED SOLVENTS MARKET BY APPLICATION (USD BILLION) 2020-2030
TABLE 76 SOUTH-EAST ASIA GREEN AND BIO-BASED SOLVENTS MARKET BY APPLICATION (THOUSAND LITERS) 2020-2030
TABLE 77 REST OF ASIA PACIFIC GREEN AND BIO-BASED SOLVENTS MARKET BY TYPE (USD BILLION) 2020-2030
TABLE 78 REST OF ASIA PACIFIC GREEN AND BIO-BASED SOLVENTS MARKET BY TYPE (THOUSAND LITERS) 2020-2030
TABLE 79 REST OF ASIA PACIFIC GREEN AND BIO-BASED SOLVENTS MARKET BY APPLICATION (USD BILLION) 2020-2030
TABLE 80 REST OF ASIA PACIFIC GREEN AND BIO-BASED SOLVENTS MARKET BY APPLICATION (THOUSAND LITERS) 2020-2030
TABLE 81 EUROPE GREEN AND BIO-BASED SOLVENTS MARKET BY TYPE (USD BILLION) 2020-2030
TABLE 82 EUROPE GREEN AND BIO-BASED SOLVENTS MARKET BY TYPE (THOUSAND LITERS) 2020-2030
TABLE 83 EUROPE GREEN AND BIO-BASED SOLVENTS MARKET BY APPLICATION (USD BILLION) 2020-2030
TABLE 84 EUROPE GREEN AND BIO-BASED SOLVENTS MARKET BY APPLICATION (THOUSAND LITERS) 2020-2030
TABLE 85 EUROPE GREEN AND BIO-BASED SOLVENTS MARKET BY COUNTRY (USD BILLION) 2020-2030
TABLE 86 EUROPE GREEN AND BIO-BASED SOLVENTS MARKET BY COUNTRY (THOUSAND LITERS) 2020-2030
TABLE 87 GERMANY GREEN AND BIO-BASED SOLVENTS MARKET BY TYPE (USD BILLION) 2020-2030
TABLE 88 GERMANY GREEN AND BIO-BASED SOLVENTS MARKET BY TYPE (THOUSAND LITERS) 2020-2030
TABLE 89 GERMANY GREEN AND BIO-BASED SOLVENTS MARKET BY APPLICATION (USD BILLION) 2020-2030
TABLE 90 GERMANY GREEN AND BIO-BASED SOLVENTS MARKET BY APPLICATION (THOUSAND LITERS) 2020-2030
TABLE 91 UK GREEN AND BIO-BASED SOLVENTS MARKET BY TYPE (USD BILLION) 2020-2030
TABLE 92 UK GREEN AND BIO-BASED SOLVENTS MARKET BY TYPE (THOUSAND LITERS) 2020-2030
TABLE 93 UK GREEN AND BIO-BASED SOLVENTS MARKET BY APPLICATION (USD BILLION) 2020-2030
TABLE 94 UK GREEN AND BIO-BASED SOLVENTS MARKET BY APPLICATION (THOUSAND LITERS) 2020-2030
TABLE 95 FRANCE GREEN AND BIO-BASED SOLVENTS MARKET BY TYPE (USD BILLION) 2020-2030
TABLE 96 FRANCE GREEN AND BIO-BASED SOLVENTS MARKET BY TYPE (THOUSAND LITERS) 2020-2030
TABLE 97 FRANCE GREEN AND BIO-BASED SOLVENTS MARKET BY APPLICATION (USD BILLION) 2020-2030
TABLE 98 FRANCE GREEN AND BIO-BASED SOLVENTS MARKET BY APPLICATION (THOUSAND LITERS) 2020-2030
TABLE 99 ITALY GREEN AND BIO-BASED SOLVENTS MARKET BY TYPE (USD BILLION) 2020-2030
TABLE 100 ITALY GREEN AND BIO-BASED SOLVENTS MARKET BY TYPE (THOUSAND LITERS) 2020-2030
TABLE 101 ITALY GREEN AND BIO-BASED SOLVENTS MARKET BY APPLICATION (USD BILLION) 2020-2030
TABLE 102 ITALY GREEN AND BIO-BASED SOLVENTS MARKET BY APPLICATION (THOUSAND LITERS) 2020-2030
TABLE 103 SPAIN GREEN AND BIO-BASED SOLVENTS MARKET BY TYPE (USD BILLION) 2020-2030
TABLE 104 SPAIN GREEN AND BIO-BASED SOLVENTS MARKET BY TYPE (THOUSAND LITERS) 2020-2030
TABLE 105 SPAIN GREEN AND BIO-BASED SOLVENTS MARKET BY APPLICATION (USD BILLION) 2020-2030
TABLE 106 SPAIN GREEN AND BIO-BASED SOLVENTS MARKET BY APPLICATION (THOUSAND LITERS) 2020-2030
TABLE 107 RUSSIA GREEN AND BIO-BASED SOLVENTS MARKET BY TYPE (USD BILLION) 2020-2030
TABLE 108 RUSSIA GREEN AND BIO-BASED SOLVENTS MARKET BY TYPE (THOUSAND LITERS) 2020-2030
TABLE 109 RUSSIA GREEN AND BIO-BASED SOLVENTS MARKET BY APPLICATION (USD BILLION) 2020-2030
TABLE 110 RUSSIA GREEN AND BIO-BASED SOLVENTS MARKET BY APPLICATION (THOUSAND LITERS) 2020-2030
TABLE 111 REST OF EUROPE GREEN AND BIO-BASED SOLVENTS MARKET BY TYPE (USD BILLION) 2020-2030
TABLE 112 REST OF EUROPE GREEN AND BIO-BASED SOLVENTS MARKET BY TYPE (THOUSAND LITERS) 2020-2030
TABLE 113 REST OF EUROPE GREEN AND BIO-BASED SOLVENTS MARKET BY APPLICATION (USD BILLION) 2020-2030
TABLE 114 REST OF EUROPE GREEN AND BIO-BASED SOLVENTS MARKET BY APPLICATION (THOUSAND LITERS) 2020-2030
TABLE 115 MIDDLE EAST AND AFRICA GREEN AND BIO-BASED SOLVENTS MARKET BY TYPE (USD BILLION) 2020-2030
TABLE 116 MIDDLE EAST AND AFRICA GREEN AND BIO-BASED SOLVENTS MARKET BY TYPE (THOUSAND LITERS) 2020-2030
TABLE 117 MIDDLE EAST AND AFRICA GREEN AND BIO-BASED SOLVENTS MARKET BY APPLICATION (USD BILLION) 2020-2030
TABLE 118 MIDDLE EAST AND AFRICA GREEN AND BIO-BASED SOLVENTS MARKET BY APPLICATION (THOUSAND LITERS) 2020-2030
TABLE 119 MIDDLE EAST AND AFRICA GREEN AND BIO-BASED SOLVENTS MARKET BY COUNTRY (USD BILLION) 2020-2030
TABLE 120 MIDDLE EAST AND AFRICA GREEN AND BIO-BASED SOLVENTS MARKET BY COUNTRY (THOUSAND LITERS) 2020-2030
TABLE 121 UAE GREEN AND BIO-BASED SOLVENTS MARKET BY TYPE (USD BILLION) 2020-2030
TABLE 122 UAE GREEN AND BIO-BASED SOLVENTS MARKET BY TYPE (THOUSAND LITERS) 2020-2030
TABLE 123 UAE GREEN AND BIO-BASED SOLVENTS MARKET BY APPLICATION (USD BILLION) 2020-2030
TABLE 124 UAE GREEN AND BIO-BASED SOLVENTS MARKET BY APPLICATION (THOUSAND LITERS) 2020-2030
TABLE 125 SAUDI ARABIA GREEN AND BIO-BASED SOLVENTS MARKET BY TYPE (USD BILLION) 2020-2030
TABLE 126 SAUDI ARABIA GREEN AND BIO-BASED SOLVENTS MARKET BY TYPE (THOUSAND LITERS) 2020-2030
TABLE 127 SAUDI ARABIA GREEN AND BIO-BASED SOLVENTS MARKET BY APPLICATION (USD BILLION) 2020-2030
TABLE 128 SAUDI ARABIA GREEN AND BIO-BASED SOLVENTS MARKET BY APPLICATION (THOUSAND LITERS) 2020-2030
TABLE 129 SOUTH AFRICA GREEN AND BIO-BASED SOLVENTS MARKET BY TYPE (USD BILLION) 2020-2030
TABLE 130 SOUTH AFRICA GREEN AND BIO-BASED SOLVENTS MARKET BY TYPE (THOUSAND LITERS) 2020-2030
TABLE 131 SOUTH AFRICA GREEN AND BIO-BASED SOLVENTS MARKET BY APPLICATION (USD BILLION) 2020-2030
TABLE 132 SOUTH AFRICA GREEN AND BIO-BASED SOLVENTS MARKET BY APPLICATION (THOUSAND LITERS) 2020-2030
TABLE 133 REST OF MIDDLE EAST AND AFRICA GREEN AND BIO-BASED SOLVENTS MARKET BY TYPE (USD BILLION) 2020-2030
TABLE 134 REST OF MIDDLE EAST AND AFRICA GREEN AND BIO-BASED SOLVENTS MARKET BY TYPE (THOUSAND LITERS) 2020-2030
TABLE 135 REST OF MIDDLE EAST AND AFRICA GREEN AND BIO-BASED SOLVENTS MARKET BY APPLICATION (USD BILLION) 2020-2030
TABLE 136 REST OF MIDDLE EAST AND AFRICA GREEN AND BIO-BASED SOLVENTS MARKET BY APPLICATION (THOUSAND LITERS) 2020-2030
LIST OF FIGURES
FIGURE 1 MARKET DYNAMICS
FIGURE 2 MARKET SEGMENTATION
FIGURE 3 REPORT TIMELINES: YEARS CONSIDERED
FIGURE 4 DATA TRIANGULATION
FIGURE 5 BOTTOM-UP APPROACH
FIGURE 6 TOP-DOWN APPROACH
FIGURE 7 RESEARCH FLOW
FIGURE 8 GLOBAL GREEN AND BIO-BASED SOLVENTS MARKET BY TYPE, USD BILLION, 2020-2030
FIGURE 9 GLOBAL GREEN AND BIO-BASED SOLVENTS MARKET BY APPLICATION, USD BILLION, 2020-2030
FIGURE 10 GLOBAL GREEN AND BIO-BASED SOLVENTS MARKET BY REGION, USD BILLION, 2020-2030
FIGURE 11 PORTER’S FIVE FORCES MODEL
FIGURE 12 GLOBAL GREEN AND BIO-BASED SOLVENTS MARKET BY TYPE, USD BILLION, 2022
FIGURE 13 GLOBAL GREEN AND BIO-BASED SOLVENTS MARKET BY APPLICATION, USD BILLION, 2022
FIGURE 14 GLOBAL GREEN AND BIO-BASED SOLVENTS MARKET BY REGION, USD BILLION 2022
FIGURE 15 MARKET SHARE ANALYSIS
FIGURE 16 BASF SE: COMPANY SNAPSHOT
FIGURE 17 CARGILL INC.: COMPANY SNAPSHOT
FIGURE 18 CLARIANT: COMPANY SNAPSHOT
FIGURE 19 DUPONT: COMPANY SNAPSHOT
FIGURE 20 HUNTSMAN CORP: COMPANY SNAPSHOT
FIGURE 21 LYONDELLBASELL INDUSTRIES HOLDINGS B.V.: COMPANY SNAPSHOT
FIGURE 22 OQ SAOC: COMPANY SNAPSHOT
FIGURE 23 SASOL: COMPANY SNAPSHOT
FIGURE 24 SOLVAY S.A: COMPANY SNAPSHOT
FIGURE 25 VERTEC BIOSOLVENTS INC.: COMPANY SNAPSHOT
FIGURE 26 CREMER OLEO GMBH & CO. KG: COMPANY SNAPSHOT
FIGURE 27 GF BIOCHEMICALS: COMPANY SNAPSHOT
DOWNLOAD FREE SAMPLE REPORT
License Type
SPEAK WITH OUR ANALYST
Want to know more about the report or any specific requirement?
WANT TO CUSTOMIZE THE REPORT?
Our Clients Speak
We asked them to research ‘ Equipment market’ all over the world, and their whole arrangement was helpful to us. thehealthanalytics.com insightful analysis and reports contributed to our current analysis and in creating a future strategy. Besides, the te
Yosuke Mitsui
Senior Associate Construction Equipment Sales & Marketing
We asked them to research ‘Equipment market’ all over the world, and their whole arrangement was helpful to us. thehealthanalytics.com insightful analysis and reports contributed to our current analysis and in creating a future strategy. Besides, the te


