

Base Year Value ()
x.x %
x.x %
CAGR ()
x.x %
x.x %
Forecast Year Value ()
x.x %
x.x %
Historical Data Period
Largest Region
Forecast Period
Green Marine Fuel Market Analysis by Type (Hydrogen, Ammonia, Methanol, Biofuels, Others), by Application (Tankers/Carriers, Barges/Cargo Vessels, Tugboats, Defence Vessels, Ferries, Yachts, Cruise Ships, Others) and Region, Global Trends and forecast from 2023 to 2030
Instant access to hundreds of data points and trends
- Market estimates from 2014-2029
- Competitive analysis, industry segmentation, financial benchmarks
- Incorporates SWOT, Porter's Five Forces and risk management frameworks
- PDF report or online database with Word, Excel and PowerPoint export options
- 100% money back guarantee
Market Overview
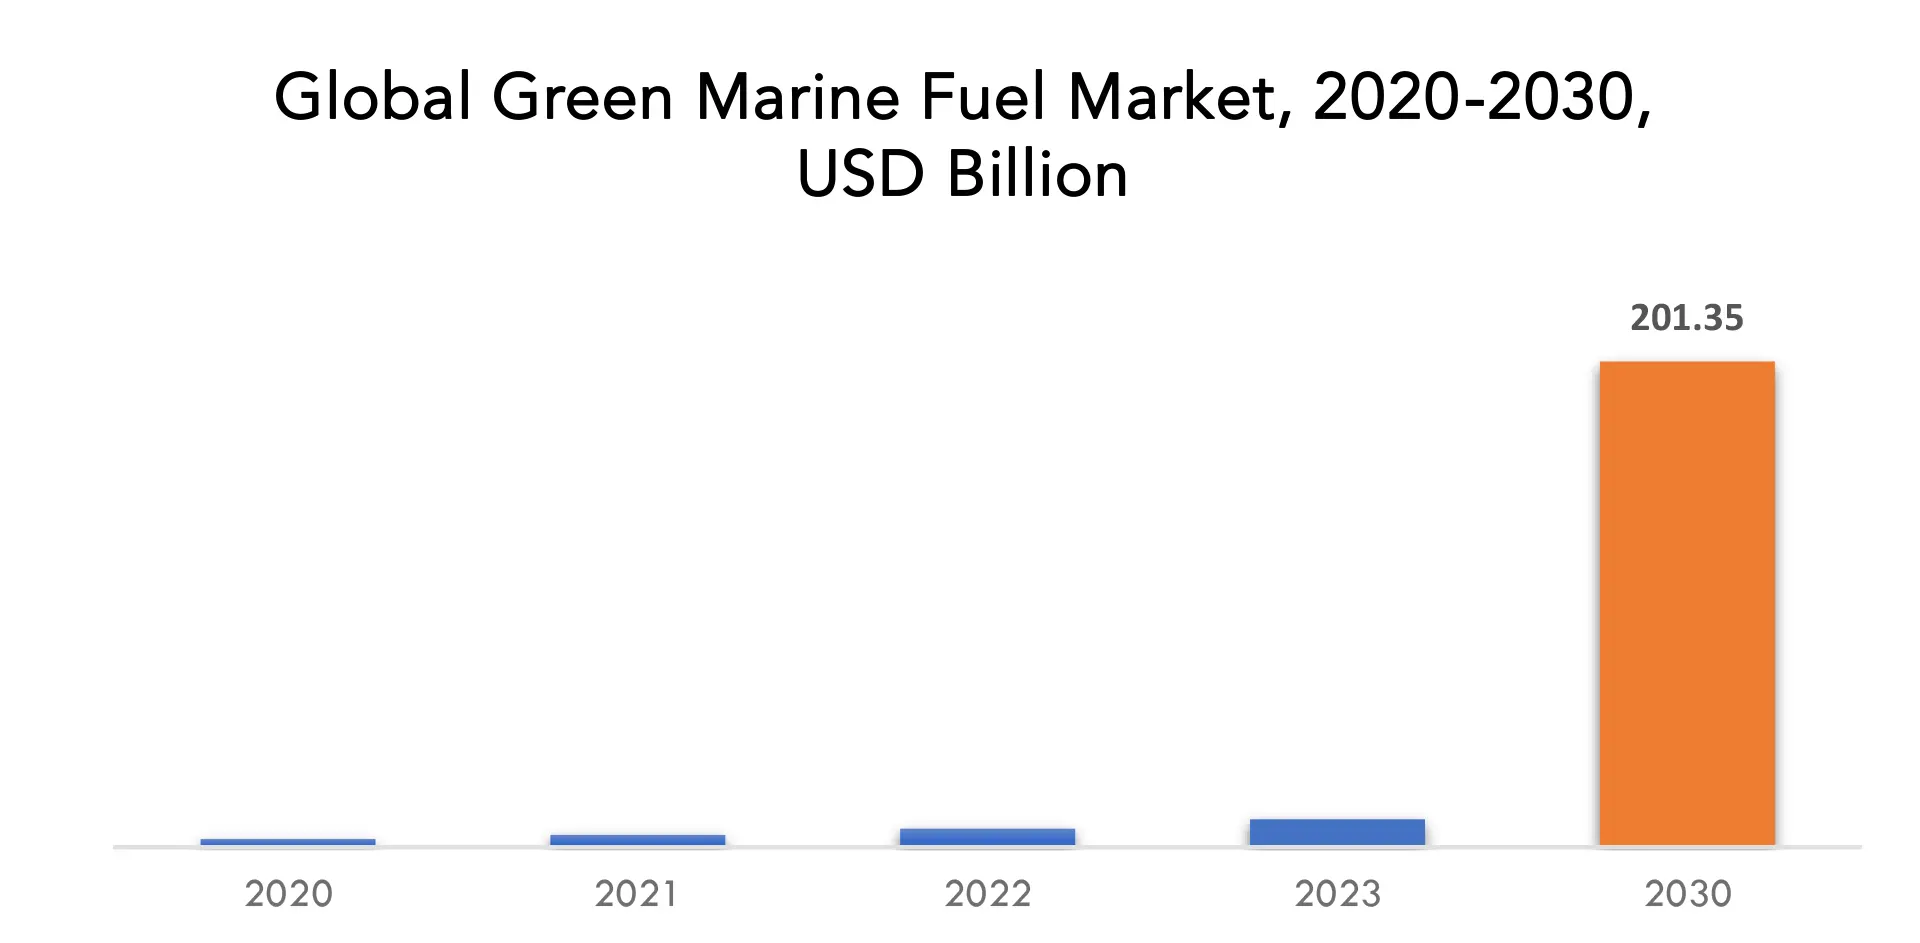
The global green marine fuel market is anticipated to grow from 11.57 billion in 2023 to USD 201.35 Billion by 2030, at a CAGR of 50.4% during the forecast period.
The capacity to offer transport services and infrastructure that is dependable, safe, inclusive, and accessible is a prerequisite for marine fuel sustainability. In addition, these services are economical, transparent, fuel-efficient, and environmentally beneficial. Comparing eco-friendly marine fuel to HFO and other petroleum-based marine fuels is a known strategy to reduce greenhouse gas (GHG) emissions. Without the need to install expensive emission controls to marine engines, it supports environmental protection and helps to improve air quality in port towns. Because green marine fuels naturally contain less Sulphur, they emit less Sulphur oxide, nitrogen oxide, and particulate matter in the air.
[caption id="attachment_31653" align="aligncenter" width="1920"]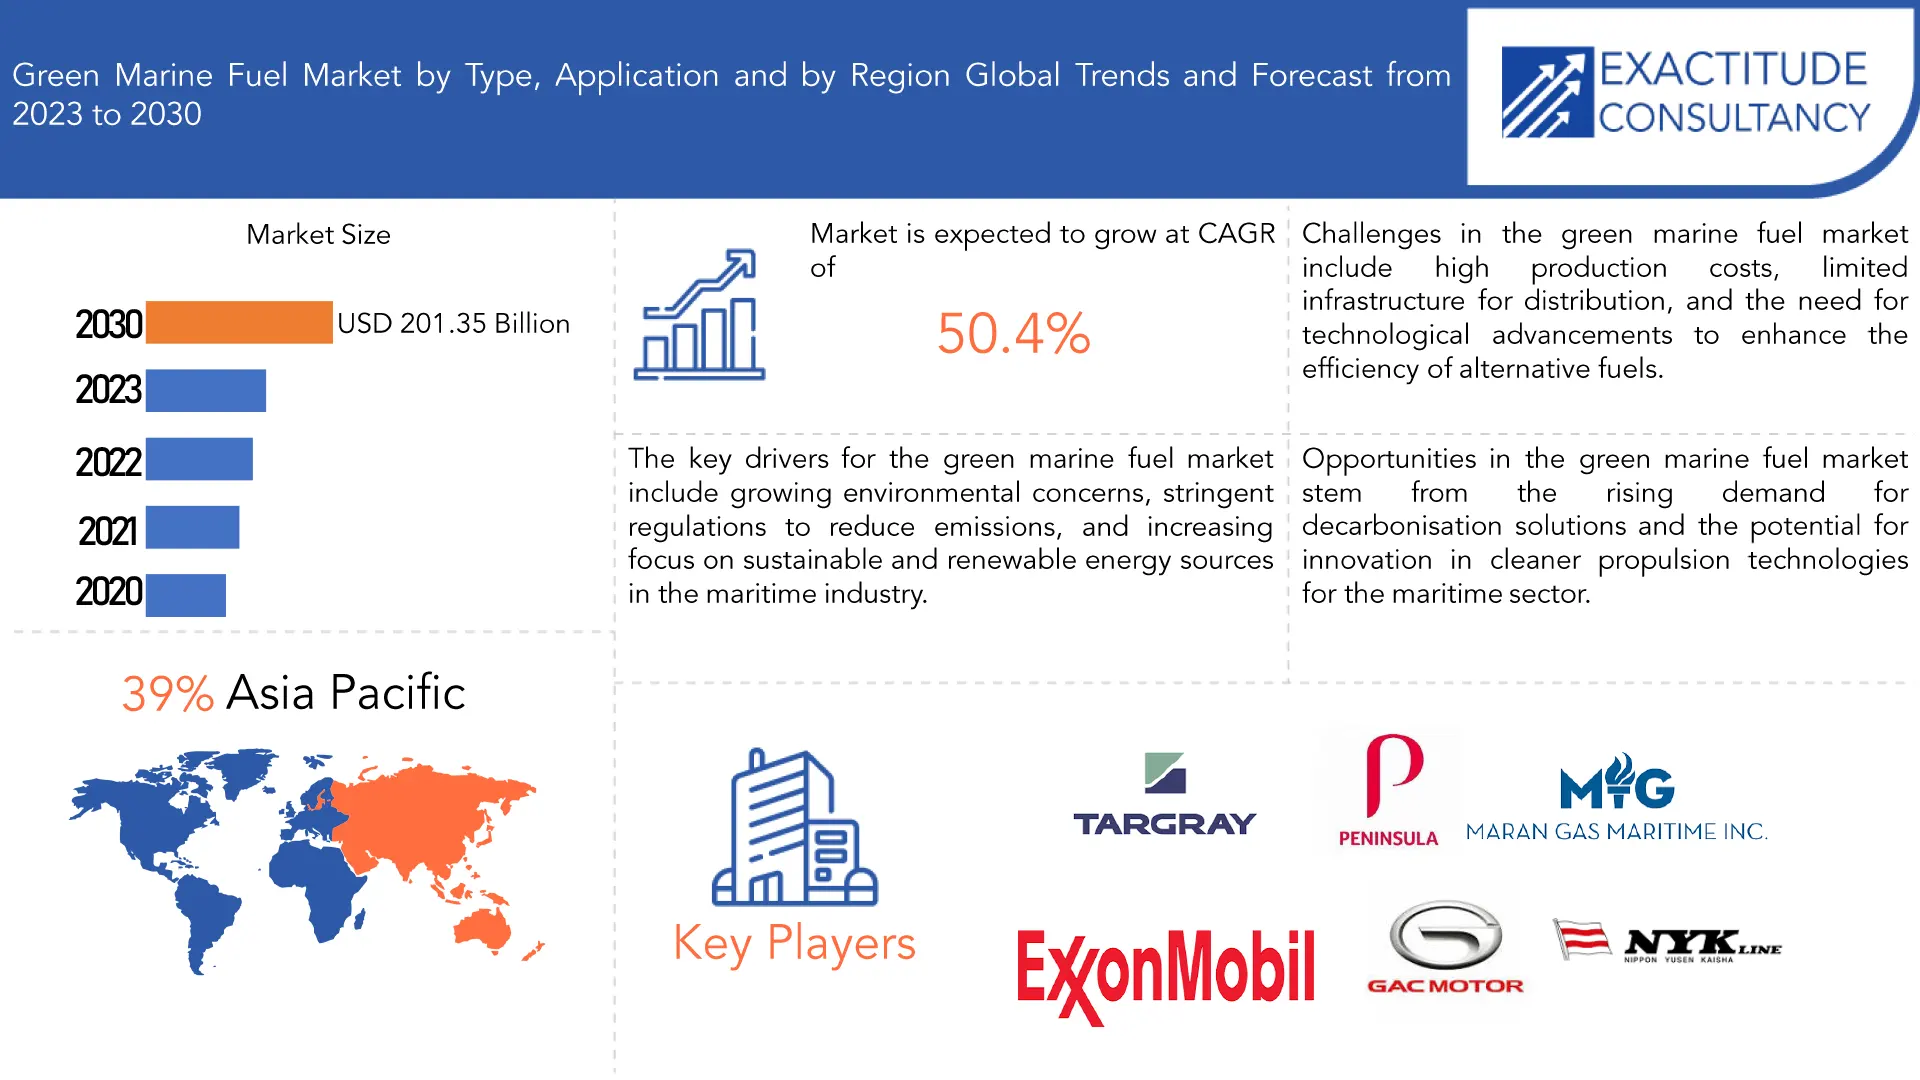
Green Marine Fuel Market | Exactitude Consultancy [/caption]
Furthermore, using sustainable marine fuels in a dual-fuel combustion engine may significantly reduce carbon emissions. A range of innovative sustainable marine fuels may also be used to cut greenhouse gas emissions from well to wake by more than 50%. Over 2% of global carbon emissions are thought to be caused by the shipping industry. It is thought that the adoption of policies that are favorable of the market drives its expansion. For example, in 2020, the International Maritime Organization (IMO) set a global limit Sulphur level of around 0.4% for marine fuels. Furthermore, fuel oil with a Sulphur content of more than 0.50 percent m/m cannot be transported by ships, which has led to the use of low-sulfur fuels or alternatives such liquefied natural gas (LNG) or other marine diesel oil that have a sulfur content of less than or 0.50% m/m.
An increase in laws that favor clean, low-carbon fuels is probably going to help the industry grow. Encouraging measures from the government are required to boost the production and use of sustainable fuels. To regulate these policies, strong and efficient regulatory structures must be put in place. Major portions of the globe however continue to run on fuels high in carbon and emissions. Technological developments in emission reduction, onboard carbon collection, and the efficiency of burning fossil fuels might support these areas' energy transformation.
The marine industry's adoption of low-emission and sustainable fuel alternatives is largely driven by the growing environmental restrictions and concerns that are driving the green marine fuel market. Shipping corporations are being compelled to invest in green marine fuels due to growing awareness of climate change and a desire to decrease greenhouse gas emissions. The use of eco-friendly fuels is encouraged by government laws and incentives, which further speed up industry expansion. The market is growing as a result of technological developments and advances in the generation of green fuels like hydrogen and biofuels. The market for green marine fuel is also being shaped by consumers' desire for eco-friendly shipping options and growing corporate sustainability objectives.
The global green marine fuel market is anticipated to grow from 11.57 billion in 2023 to USD 201.35 Billion by 2030, at a CAGR of 50.4% during the forecast period.
The capacity to offer transport services and infrastructure that is dependable, safe, inclusive, and accessible is a prerequisite for marine fuel sustainability. In addition, these services are economical, transparent, fuel-efficient, and environmentally beneficial. Comparing eco-friendly marine fuel to HFO and other petroleum-based marine fuels is a known strategy to reduce greenhouse gas (GHG) emissions. Without the need to install expensive emission controls to marine engines, it supports environmental protection and helps to improve air quality in port towns. Because green marine fuels naturally contain less Sulphur, they emit less Sulphur oxide, nitrogen oxide, and particulate matter in the air.
[caption id="attachment_31653" align="aligncenter" width="1920"]
Furthermore, using sustainable marine fuels in a dual-fuel combustion engine may significantly reduce carbon emissions. A range of innovative sustainable marine fuels may also be used to cut greenhouse gas emissions from well to wake by more than 50%. Over 2% of global carbon emissions are thought to be caused by the shipping industry. It is thought that the adoption of policies that are favorable of the market drives its expansion. For example, in 2020, the International Maritime Organization (IMO) set a global limit Sulphur level of around 0.4% for marine fuels. Furthermore, fuel oil with a Sulphur content of more than 0.50 percent m/m cannot be transported by ships, which has led to the use of low-sulfur fuels or alternatives such liquefied natural gas (LNG) or other marine diesel oil that have a sulfur content of less than or 0.50% m/m.
An increase in laws that favor clean, low-carbon fuels is probably going to help the industry grow. Encouraging measures from the government are required to boost the production and use of sustainable fuels. To regulate these policies, strong and efficient regulatory structures must be put in place. Major portions of the globe however continue to run on fuels high in carbon and emissions. Technological developments in emission reduction, onboard carbon collection, and the efficiency of burning fossil fuels might support these areas' energy transformation.
The marine industry's adoption of low-emission and sustainable fuel alternatives is largely driven by the growing environmental restrictions and concerns that are driving the green marine fuel market. Shipping corporations are being compelled to invest in green marine fuels due to growing awareness of climate change and a desire to decrease greenhouse gas emissions. The use of eco-friendly fuels is encouraged by government laws and incentives, which further speed up industry expansion. The market is growing as a result of technological developments and advances in the generation of green fuels like hydrogen and biofuels. The market for green marine fuel is also being shaped by consumers' desire for eco-friendly shipping options and growing corporate sustainability objectives.
| ATTRIBUTE | DETAILS |
| Study period | 2020-2030 |
| Base year | 2022 |
| Estimated year | 2023 |
| Forecasted year | 2023-2030 |
| Historical period | 2019-2021 |
| Unit | Value (USD Billion) |
| Segmentation | By Type, By Application and By Region |
| By Type |
|
| By Application | Tankers/Carriers
|
| By Region
|
|
Frequently Asked Questions
• What is the market size for the green marine fuel market?
The global green marine fuel market is anticipated to grow from 11.57 Billion in 2023 to USD 201.35 Billion by 2030, at a CAGR of 50.4% during the forecast period.
• Which region is domaining in the green marine fuel market?
Asia Pacific accounted for the largest market in the green marine fuel market. Asia Pacific accounted for 39% market share of the global market value.
• Who are the major key players in the green marine fuel market?
Neste Oyj, Targray, ExxonMobil Corporation, GoodNRG B.V., Chevron Corporation, Peninsula, Nordic Marine Oil A/S, TotalEnergies, GAC, Methanex Corporation, Titan LNG, Goodfuels, FueLNG, TGE Marine Gas, Gas Maritime, ESL Shipping, CMA CGM, Trafigura, MISC, NYK Line
• What is the latest trend in the green marine fuel market?
Biofuels made from sustainable sources, such waste materials and algae, are gaining popularity. These biofuels provide a low-emission, renewable substitute, and current patterns indicate that the marine industry is placing more emphasis on the research and application of these fuels.
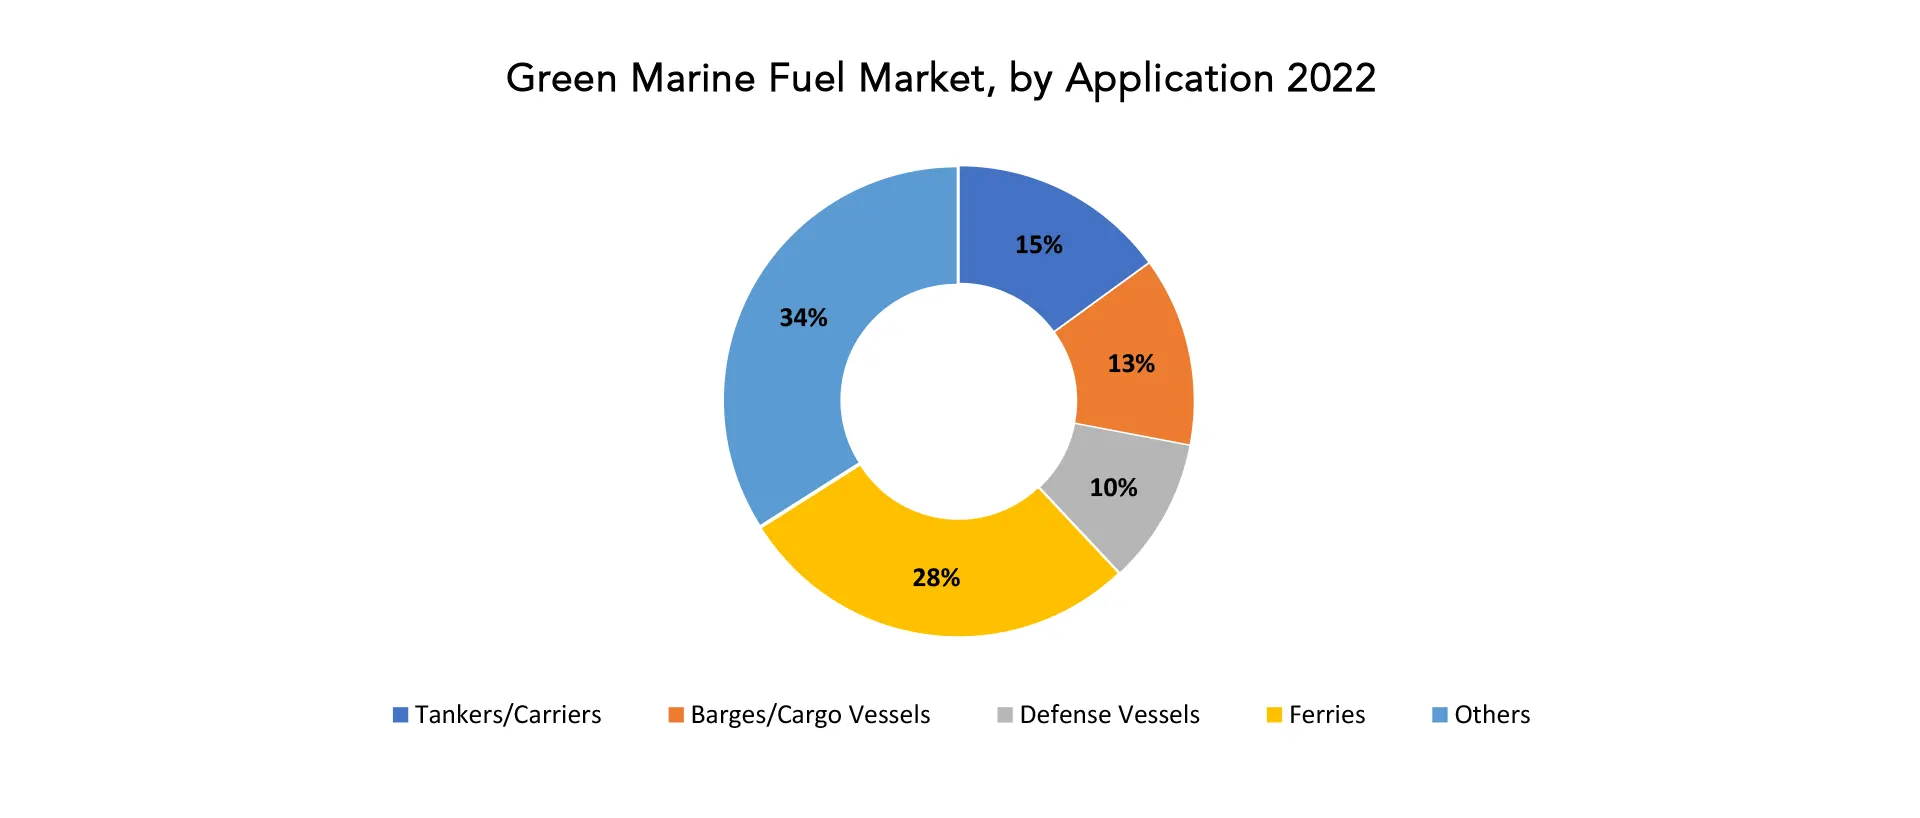
Green Marine Fuel Market Segmentation Analysis
Three categories—type, application, and region—are used to categorize the global market for green marine fuel. The green marine fuel market encompasses a variety of fuel types, including hydrogen, ammonia, methanol, biofuels, and other sustainable options. These fuels find applications across a spectrum of marine vessels, such as tankers/carriers, barges/cargo vessels, tugboats, defense vessels, ferries, yachts, cruise ships, and other maritime platforms. [caption id="attachment_31654" align="aligncenter" width="1920"]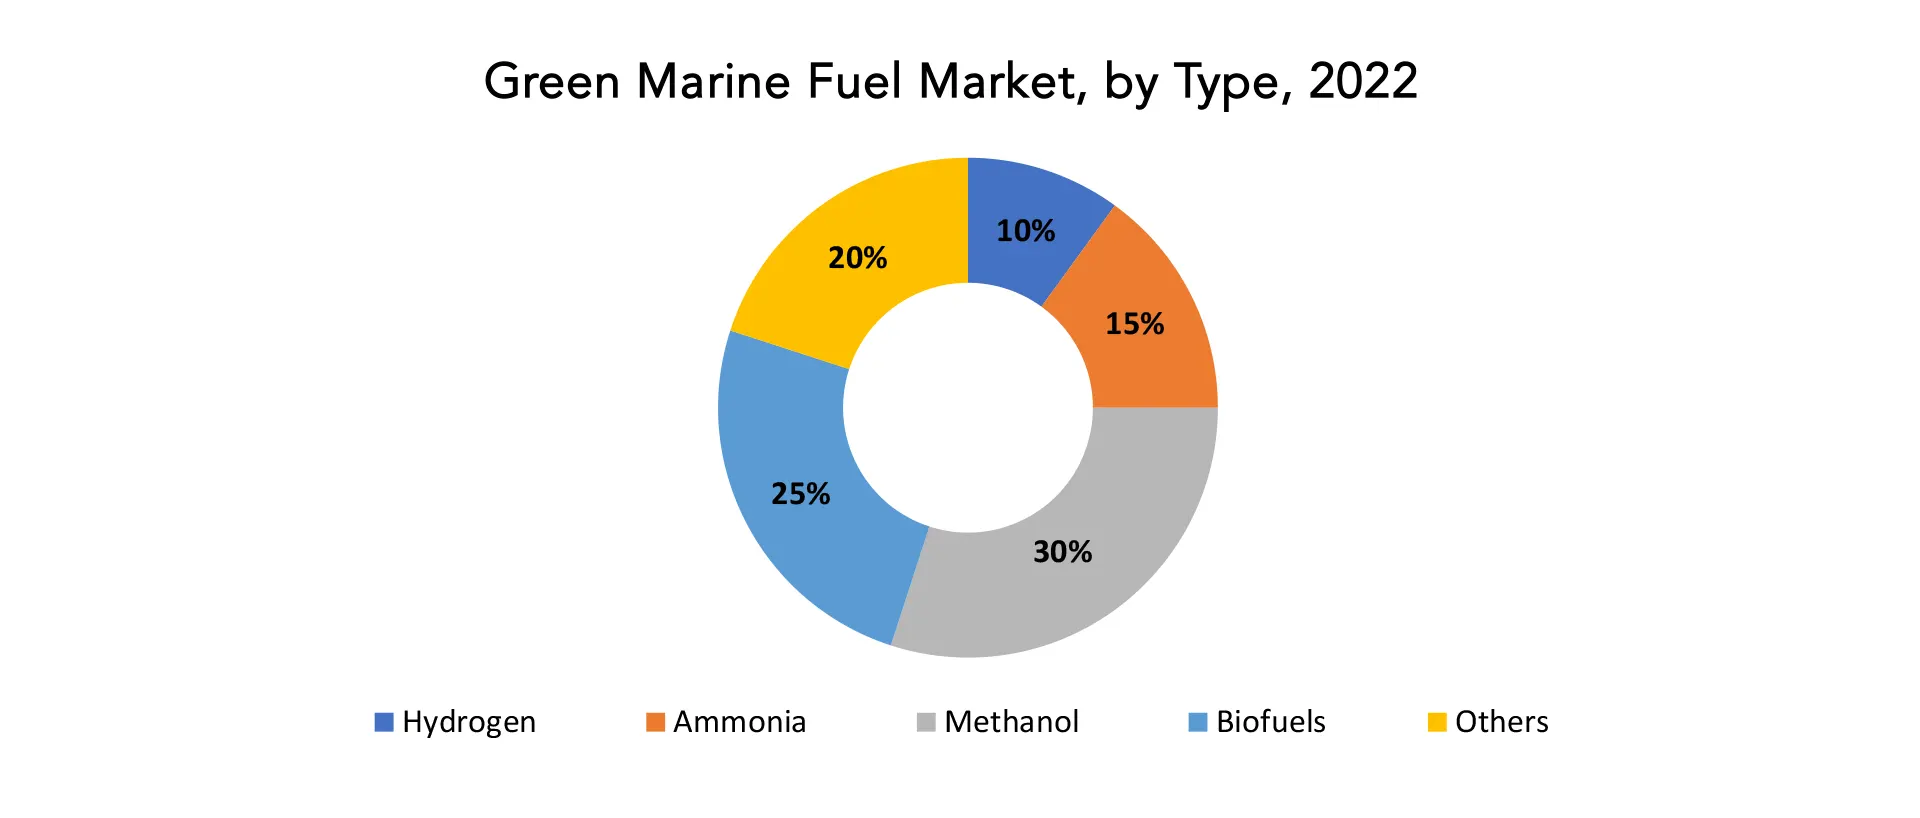
Green Marine Fuel Market Dynamics
Driver The global market for green marine fuel is expected to rise as environmental concerns increase. The impetus to embrace cleaner alternatives is mounting on the marine sector as worries about emissions and climate change grow. The growing need for green marine fuels is a result of strict environmental laws and programme designed to lower carbon footprints. The marine industry is increasingly pursuing the use of biofuels, ammonia, methanol, hydrogen, and other cleaner and more sustainable energy sources. The industry is expanding because to the policies and incentives being implemented by governments and international organizations to promote the adoption of green fuels. Shipowners and operators are investing more in environmentally friendly alternatives as a result of rising awareness of the negative environmental effects of conventional marine fuels. The worldwide shift towards renewable energy sources is consistent with the marine sector's objective of accomplishing decarbonization. It is anticipated that this paradigm shift would stimulate innovation in green fuel technologies and encourage stakeholder engagement to establish an ecosystem for maritime transportation that is more environmentally conscious and sustainable. Because of this, the market for green marine fuel is poised to develop rapidly in response to the growing environmental concerns throughout the world. Restraint The primary obstacle to the market's expansion is the high cost of green marine fuels. The generation and delivery of green marine fuels, such hydrogen, ammonia, and biofuels, frequently need sophisticated technology and infrastructure, which drives up their cost relative to conventional fuels. The financial barrier is further increased by the cost of building new boats or adapting old ones to use alternative fuels. Furthermore, energy-intensive technologies are frequently used in the production processes of various green fuels, such as ammonia and hydrogen, which raises the overall cost of production. With their worries over the economic viability and return on investment, shipowners and operators are hesitant to use green marine fuels. Even if organizations and governments are putting in place incentives and subsidies to promote the switch to green fuels, the initial expenses continue to be a major barrier. The financial obstacles related to green marine fuels must be addressed through continuous technological progress, economies of scale, and policies that encourage the use of these alternatives. Only then will environmentally sustainably practices in the maritime sector be more widely adopted. Opportunities Green marine fuel suppliers have a growing market potential as more shipping firms commit to decarbonization targets. Suppliers of green marine fuel are expected to see significant growth in the industry as more shipping companies commit to aggressive decarbonization goals. Given the increased emphasis on the marine sector to lower its greenhouse gas emissions, these providers are essential in offering sustainable fuel substitutes. There is an increasing need for dependable and expandable suppliers of green marine fuels as a result of shipping firms' increased pledges to attain net-zero emissions. Suppliers that can provide innovative and reasonably priced solutions will profit from this expanding industry. Green fuel providers play a critical role in easing the shift as maritime company’s priorities environmental sustainability in order to conform with global climate targets. The market potential for green marine fuels may be further solidified by suppliers and shipping firms forming strategic alliances that can result in long-term collaborations. The growing scrutiny from investors, customers, and regulatory agencies is supporting this trend and encouraging shipping firms to look for reliable and compliant suppliers of green fuels. The industry's realization that sustainable practices are not only ecologically responsible but also necessary to be competitive in a changing global market that is focused on eco-friendly solutions increases the market potential for green marine fuel providers.Green Marine Fuel Market Trends
- Increasing Adoption of Biofuels: Biofuels made from sustainable sources, such waste materials and algae, are gaining popularity. These biofuels provide a low-emission, renewable substitute, and current patterns indicate that the marine industry is placing more emphasis on the research and application of these fuels.
- Technological Developments in Ammonia and Hydrogen: Ammonia and hydrogen production technologies are expected to be the subject of ongoing research and development, as interest in these fuels as possible zero-emission alternatives for the maritime sector grows. The viability of using ammonia and hydrogen in marine applications is being investigated through pilot programme and partnerships.
- Expanding Infrastructure Investments: As green marine fuels are produced, stored, and distributed, more money is being invested in the necessary infrastructure. In order to satisfy the growing demand, this also entails building infrastructure and bunkering facilities to facilitate the expansion of sustainable fuel production.
- Emphasis on Carbon Capture and Offsetting: A comprehensive approach to decarbonization, incorporating carbon capture and offsetting techniques, is one of the latest developments. There may be an increase in the use of technologies and programme that absorb and store carbon emissions or fund carbon offset projects.
Competitive Landscape
The competitive landscape of the green marine fuel market was dynamic, with several prominent companies competing to provide innovative and advanced green marine fuels.- Neste Oyj
- Targray
- ExxonMobil Corporation
- GoodNRG B.V.
- Chevron Corporation
- Peninsula
- Nordic Marine Oil A/S
- TotalEnergies
- GAC
- Methanex Corporation
- Titan LNG
- Goodfuels
- FueLNG
- TGE Marine Gas
- Gas Maritime
- ESL Shipping
- CMA CGM
- Trafigura
- MISC
- NYK Line
Regional Analysis
By 2022, the sustainable marine fuel market in Asia Pacific had the biggest share of 39%, driven by the adoption of clean energy regulations in the maritime industry. For example, the National Centre of Excellence in Green Port and Shipping (NCoEGPS) was recently established by the Indian government to identify technologies, alternative fuels, renewable energy sources, and targets for the shipping and port industry. The goal of the NCoEGPS is to enable the use of sustainable biofuels and their blends as fuel in Indian ships to reduce the use of fossil fuels and promote the use of renewable energy in ship operations. This is anticipated to feed the region's need for sustainable marine fuels. [caption id="attachment_31657" align="aligncenter" width="1920"]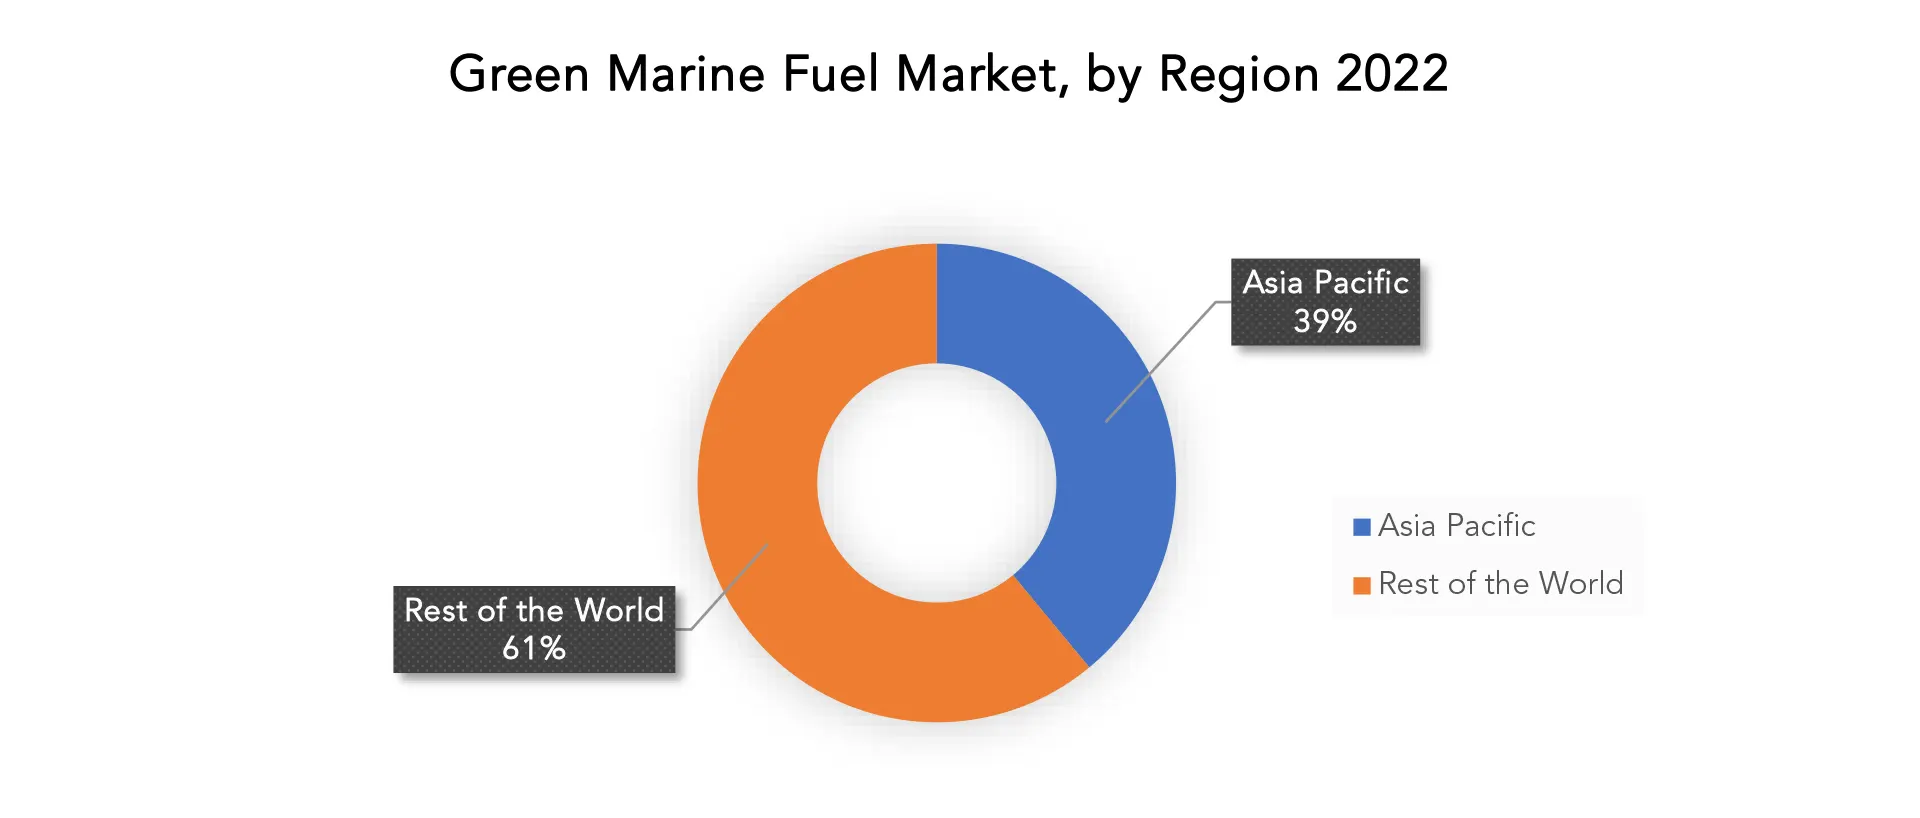
Target Audience for Green Marine Fuel Market
- Shipping companies
- Maritime industry stakeholders
- Governments and regulatory bodies
- Investors and financiers
- Environmental organizations
- Research and development institutions
- Green technology providers
- Bunker fuel suppliers
- Shipbuilders and manufacturers
- Energy and fuel infrastructure companies
Segments Covered in the Green Marine Fuel Market Report
Green Marine Fuel Market by Type- Hydrogen
- Ammonia
- Methanol
- Biofuels
- Others
- Tankers/Carriers
- Barges/Cargo Vessels
- Tugboats
- Defense Vessels
- Ferries
- Yachts
- Cruise Ships
- Others
- North America
- Europe
- Asia Pacific
- South America
- Middle East and Africa
Key Question Answered
- What is the expected growth rate of the green marine fuel market over the next 7 years?
- Who are the major players in the green marine fuel market and what is their market share?
- What are the end-user industries driving market demand and what is their outlook?
- What are the opportunities for growth in emerging markets such as Asia-pacific, the middle east, and Africa?
- How is the economic environment affecting the green marine fuel market, including factors such as interest rates, inflation, and exchange rates?
- What is the expected impact of government policies and regulations on the green marine fuel market?
- What is the current and forecasted size and growth rate of the green marine fuel market?
- What are the key drivers of growth in the green marine fuel market?
- Who are the major players in the market and what is their market share?
- What are the distribution channels and supply chain dynamics in the green marine fuel market?
- What are the technological advancements and innovations in the green marine fuel market and their impact on product development and growth?
- What are the regulatory considerations and their impact on the market?
- What are the challenges faced by players in the green marine fuel market and how are they addressing these challenges?
- What are the opportunities for growth and expansion in the green marine fuel market?
- What are the services offered and specifications of leading players in the market?
- INTRODUCTION
- MARKET DEFINITION
- MARKET SEGMENTATION
- RESEARCH TIMELINES
- ASSUMPTIONS AND LIMITATIONS
- RESEARCH METHODOLOGY
- DATA MINING
- SECONDARY RESEARCH
- PRIMARY RESEARCH
- SUBJECT-MATTER EXPERTS’ ADVICE
- QUALITY CHECKS
- FINAL REVIEW
- DATA TRIANGULATION
- BOTTOM-UP APPROACH
- TOP-DOWN APPROACH
- RESEARCH FLOW
- DATA SOURCES
- DATA MINING
- EXECUTIVE SUMMARY
- MARKET OVERVIEW
- GREEN MARINE FUEL MARKET OUTLOOK
- MARKET DRIVERS
- MARKET RESTRAINTS
- MARKET OPPORTUNITIES
- IMPACT OF COVID-19 ON GREEN MARINE FUEL MARKET
- PORTER’S FIVE FORCES MODEL
- THREAT FROM NEW ENTRANTS
- THREAT FROM SUBSTITUTES
- BARGAINING POWER OF SUPPLIERS
- BARGAINING POWER OF CUSTOMERS
- DEGREE OF COMPETITION
- INDUSTRY VALUE CHAIN ANALYSIS
- GREEN MARINE FUEL MARKET OUTLOOK
- GLOBAL GREEN MARINE FUEL MARKET BY TYPE, 2020-2030, (USD BILLION)
- HYDROGEN
- AMMONIA
- METHANOL
- BIOFUELS
- OTHERS
- GLOBAL GREEN MARINE FUEL MARKET BY APPLICATION, 2020-2030, (USD BILLION)
- TANKERS/CARRIERS
- BARGES/CARGO VESSELS
- TUGBOATS
- DEFENSE VESSELS
- FERRIES
- YACHTS
- CRUISE SHIPS
- OTHERS
- GLOBAL GREEN MARINE FUEL MARKET BY REGION, 2020-2030, (USD BILLION)
- NORTH AMERICA
- US
- CANADA
- MEXICO
- SOUTH AMERICA
- BRAZIL
- ARGENTINA
- COLOMBIA
- REST OF SOUTH AMERICA
- EUROPE
- GERMANY
- UK
- FRANCE
- ITALY
- SPAIN
- RUSSIA
- REST OF EUROPE
- ASIA PACIFIC
- INDIA
- CHINA
- JAPAN
- SOUTH KOREA
- AUSTRALIA
- SOUTH-EAST ASIA
- REST OF ASIA PACIFIC
- MIDDLE EAST AND AFRICA
- UAE
- SAUDI ARABIA
- SOUTH AFRICA
- REST OF MIDDLE EAST AND AFRICA
- NORTH AMERICA
- COMPANY PROFILES*
(BUSINESS OVERVIEW, COMPANY SNAPSHOT, PRODUCTS OFFERED, RECENT DEVELOPMENTS)
- NESTE OYJ
- TARGRAY
- EXXONMOBIL CORPORATION
- GOODNRG B.V.
- CHEVRON CORPORATION
- PENINSULA
- NORDIC MARINE OIL A/S
- TOTALENERGIES
- GAC
- METHANEX CORPORATION
- TITAN LNG
- GOODFUELS
- FUELNG
- TGE MARINE GAS
- GAS MARITIME
- ESL SHIPPING
- CMA CGM
- TRAFIGURA
- MISC
- NYK LINE
*THE COMPANY LIST IS INDICATIVE
LIST OF TABLES
TABLE 1 GLOBAL GREEN MARINE FUEL MARKET BY TYPE (USD BILLION) 2020-2030
TABLE 2 GLOBAL GREEN MARINE FUEL MARKET BY APPLICATION (USD BILLION) 2020-2030
TABLE 3 GLOBAL GREEN MARINE FUEL MARKET BY REGION (USD BILLION) 2020-2030
TABLE 4 NORTH AMERICA GREEN MARINE FUEL MARKET BY COUNTRY (USD BILLION) 2020-2030
TABLE 5 NORTH AMERICA GREEN MARINE FUEL MARKET BY TYPE (USD BILLION) 2020-2030
TABLE 6 NORTH AMERICA GREEN MARINE FUEL MARKET BY APPLICATION (USD BILLION) 2020-2030
TABLE 7 US GREEN MARINE FUEL MARKET BY TYPE (USD BILLION) 2020-2030
TABLE 8 US GREEN MARINE FUEL MARKET BY APPLICATION (USD BILLION) 2020-2030
TABLE 9 CANADA GREEN MARINE FUEL MARKET BY TYPE (USD BILLION) 2020-2030
TABLE 10 CANADA GREEN MARINE FUEL MARKET BY APPLICATION (USD BILLION) 2020-2030
TABLE 11 MEXICO GREEN MARINE FUEL MARKET BY TYPE (USD BILLION) 2020-2030
TABLE 12 MEXICO GREEN MARINE FUEL MARKET BY APPLICATION (USD BILLION) 2020-2030
TABLE 13 SOUTH AMERICA GREEN MARINE FUEL MARKET BY COUNTRY (USD BILLION) 2020-2030
TABLE 14 SOUTH AMERICA GREEN MARINE FUEL MARKET BY TYPE (USD BILLION) 2020-2030
TABLE 15 SOUTH AMERICA GREEN MARINE FUEL MARKET BY APPLICATION (USD BILLION) 2020-2030
TABLE 16 BRAZIL GREEN MARINE FUEL MARKET BY TYPE (USD BILLION) 2020-2030
TABLE 17 BRAZIL GREEN MARINE FUEL MARKET BY APPLICATION (USD BILLION) 2020-2030
TABLE 18 ARGENTINA GREEN MARINE FUEL MARKET BY TYPE (USD BILLION) 2020-2030
TABLE 19 ARGENTINA GREEN MARINE FUEL MARKET BY APPLICATION (USD BILLION) 2020-2030
TABLE 20 COLOMBIA GREEN MARINE FUEL MARKET BY TYPE (USD BILLION) 2020-2030
TABLE 21 COLOMBIA GREEN MARINE FUEL MARKET BY APPLICATION (USD BILLION) 2020-2030
TABLE 22 REST OF SOUTH AMERICA GREEN MARINE FUEL MARKET BY TYPE (USD BILLION) 2020-2030
TABLE 23 REST OF SOUTH AMERICA GREEN MARINE FUEL MARKET BY APPLICATION (USD BILLION) 2020-2030
TABLE 24 ASIA-PACIFIC GREEN MARINE FUEL MARKET BY COUNTRY (USD BILLION) 2020-2030
TABLE 25 ASIA-PACIFIC GREEN MARINE FUEL MARKET BY TYPE (USD BILLION) 2020-2030
TABLE 26 ASIA-PACIFIC GREEN MARINE FUEL MARKET BY APPLICATION (USD BILLION) 2020-2030
TABLE 27 INDIA GREEN MARINE FUEL MARKET BY TYPE (USD BILLION) 2020-2030
TABLE 28 INDIA GREEN MARINE FUEL MARKET BY APPLICATION (USD BILLION) 2020-2030
TABLE 29 CHINA GREEN MARINE FUEL MARKET BY TYPE (USD BILLION) 2020-2030
TABLE 30 CHINA GREEN MARINE FUEL MARKET BY APPLICATION (USD BILLION) 2020-2030
TABLE 31 JAPAN GREEN MARINE FUEL MARKET BY TYPE (USD BILLION) 2020-2030
TABLE 32 JAPAN GREEN MARINE FUEL MARKET BY APPLICATION (USD BILLION) 2020-2030
TABLE 33 SOUTH KOREA GREEN MARINE FUEL MARKET BY TYPE (USD BILLION) 2020-2030
TABLE 34 SOUTH KOREA GREEN MARINE FUEL MARKET BY APPLICATION (USD BILLION) 2020-2030
TABLE 35 AUSTRALIA GREEN MARINE FUEL MARKET BY TYPE (USD BILLION) 2020-2030
TABLE 36 AUSTRALIA GREEN MARINE FUEL MARKET BY APPLICATION (USD BILLION) 2020-2030
TABLE 37 SOUTH-EAST ASIA GREEN MARINE FUEL MARKET BY TYPE (USD BILLION) 2020-2030
TABLE 38 SOUTH-EAST ASIA GREEN MARINE FUEL MARKET BY APPLICATION (USD BILLION) 2020-2030
TABLE 39 REST OF ASIA PACIFIC GREEN MARINE FUEL MARKET BY TYPE (USD BILLION) 2020-2030
TABLE 40 REST OF ASIA PACIFIC GREEN MARINE FUEL MARKET BY APPLICATION (USD BILLION) 2020-2030
TABLE 41 EUROPE GREEN MARINE FUEL MARKET BY COUNTRY (USD BILLION) 2020-2030
TABLE 42 EUROPE GREEN MARINE FUEL MARKET BY TYPE (USD BILLION) 2020-2030
TABLE 43 EUROPE GREEN MARINE FUEL MARKET BY APPLICATION (USD BILLION) 2020-2030
TABLE 44 GERMANY GREEN MARINE FUEL MARKET BY TYPE (USD BILLION) 2020-2030
TABLE 45 GERMANY GREEN MARINE FUEL MARKET BY APPLICATION (USD BILLION) 2020-2030
TABLE 46 UK GREEN MARINE FUEL MARKET BY TYPE (USD BILLION) 2020-2030
TABLE 47 UK GREEN MARINE FUEL MARKET BY APPLICATION (USD BILLION) 2020-2030
TABLE 48 FRANCE GREEN MARINE FUEL MARKET BY TYPE (USD BILLION) 2020-2030
TABLE 49 FRANCE GREEN MARINE FUEL MARKET BY APPLICATION (USD BILLION) 2020-2030
TABLE 50 ITALY GREEN MARINE FUEL MARKET BY TYPE (USD BILLION) 2020-2030
TABLE 51 ITALY GREEN MARINE FUEL MARKET BY APPLICATION (USD BILLION) 2020-2030
TABLE 52 SPAIN GREEN MARINE FUEL MARKET BY TYPE (USD BILLION) 2020-2030
TABLE 53 SPAIN GREEN MARINE FUEL MARKET BY APPLICATION (USD BILLION) 2020-2030
TABLE 54 RUSSIA GREEN MARINE FUEL MARKET BY TYPE (USD BILLION) 2020-2030
TABLE 55 RUSSIA GREEN MARINE FUEL MARKET BY APPLICATION (USD BILLION) 2020-2030
TABLE 56 REST OF EUROPE GREEN MARINE FUEL MARKET BY TYPE (USD BILLION) 2020-2030
TABLE 57 REST OF EUROPE GREEN MARINE FUEL MARKET BY APPLICATION (USD BILLION) 2020-2030
TABLE 58 MIDDLE EAST AND AFRICA GREEN MARINE FUEL MARKET BY COUNTRY (USD BILLION) 2020-2030
TABLE 59 MIDDLE EAST AND AFRICA GREEN MARINE FUEL MARKET BY TYPE (USD BILLION) 2020-2030
TABLE 60 MIDDLE EAST AND AFRICA GREEN MARINE FUEL MARKET BY APPLICATION (USD BILLION) 2020-2030
TABLE 61 UAE GREEN MARINE FUEL MARKET BY TYPE (USD BILLION) 2020-2030
TABLE 62 UAE GREEN MARINE FUEL MARKET BY APPLICATION (USD BILLION) 2020-2030
TABLE 63 SAUDI ARABIA GREEN MARINE FUEL MARKET BY TYPE (USD BILLION) 2020-2030
TABLE 64 SAUDI ARABIA GREEN MARINE FUEL MARKET BY APPLICATION (USD BILLION) 2020-2030
TABLE 65 SOUTH AFRICA GREEN MARINE FUEL MARKET BY TYPE (USD BILLION) 2020-2030
TABLE 66 SOUTH AFRICA GREEN MARINE FUEL MARKET BY APPLICATION (USD BILLION) 2020-2030
TABLE 67 REST OF MIDDLE EAST AND AFRICA GREEN MARINE FUEL MARKET BY TYPE (USD BILLION) 2020-2030
TABLE 68 REST OF MIDDLE EAST AND AFRICA GREEN MARINE FUEL MARKET BY APPLICATION (USD BILLION) 2020-2030
LIST OF FIGURES
FIGURE 1 MARKET DYNAMICS
FIGURE 2 MARKET SEGMENTATION
FIGURE 3 REPORT TIMELINES: YEARS CONSIDERED
FIGURE 4 DATA TRIANGULATION
FIGURE 5 BOTTOM-UP APPROACH
FIGURE 6 TOP-DOWN APPROACH
FIGURE 7 RESEARCH FLOW
FIGURE 8 GLOBAL GREEN MARINE FUEL MARKET BY TYPE, USD BILLION, 2020-2030
FIGURE 9 GLOBAL GREEN MARINE FUEL MARKET BY APPLICATION, USD BILLION, 2020-2030
FIGURE 10 GLOBAL GREEN MARINE FUEL MARKET BY REGION, USD BILLION, 2020-2030
FIGURE 11 PORTER’S FIVE FORCES MODEL
FIGURE 12 GLOBAL GREEN MARINE FUEL MARKET BY TYPE, USD BILLION, 2022
FIGURE 13 GLOBAL GREEN MARINE FUEL MARKET BY APPLICATION, USD BILLION, 2022
FIGURE 14 GLOBAL GREEN MARINE FUEL MARKET BY REGION, USD BILLION, 2022
FIGURE 15 MARKET SHARE ANALYSIS
FIGURE 16 NESTE OYJ: COMPANY SNAPSHOT
FIGURE 17 TARGRAY: COMPANY SNAPSHOT
FIGURE 18 EXXONMOBIL CORPORATION: COMPANY SNAPSHOT
FIGURE 19 GOODNRG B.V.: COMPANY SNAPSHOT
FIGURE 20 CHEVRON CORPORATION: COMPANY SNAPSHOT
FIGURE 21 PENINSULA: COMPANY SNAPSHOT
FIGURE 22 NORDIC MARINE OIL A/S: COMPANY SNAPSHOT
FIGURE 23 TOTALENERGIES: COMPANY SNAPSHOT
FIGURE 24 GAC: COMPANY SNAPSHOT
FIGURE 25 METHANEX CORPORATION: COMPANY SNAPSHOT
FIGURE 26 TITAN LNG: COMPANY SNAPSHOT
FIGURE 27 GOODFUELS: COMPANY SNAPSHOT
FIGURE 28 FUELNG: COMPANY SNAPSHOT
FIGURE 29 TGE MARINE GAS: COMPANY SNAPSHOT
FIGURE 30 GAS MARITIME: COMPANY SNAPSHOT
FIGURE 31 ESL SHIPPING: COMPANY SNAPSHOT
FIGURE 32 CMA CGM: COMPANY SNAPSHOT
FIGURE 33 TRAFIGURA: COMPANY SNAPSHOT
FIGURE 34 MISC: COMPANY SNAPSHOT
FIGURE 35 NYK LINE: COMPANY SNAPSHOT
DOWNLOAD FREE SAMPLE REPORT
License Type
SPEAK WITH OUR ANALYST
Want to know more about the report or any specific requirement?
WANT TO CUSTOMIZE THE REPORT?
Our Clients Speak
We asked them to research ‘ Equipment market’ all over the world, and their whole arrangement was helpful to us. thehealthanalytics.com insightful analysis and reports contributed to our current analysis and in creating a future strategy. Besides, the te
Yosuke Mitsui
Senior Associate Construction Equipment Sales & Marketing
We asked them to research ‘Equipment market’ all over the world, and their whole arrangement was helpful to us. thehealthanalytics.com insightful analysis and reports contributed to our current analysis and in creating a future strategy. Besides, the te


