

Base Year Value ()
x.x %
x.x %
CAGR ()
x.x %
x.x %
Forecast Year Value ()
x.x %
x.x %
Historical Data Period
Largest Region
Forecast Period
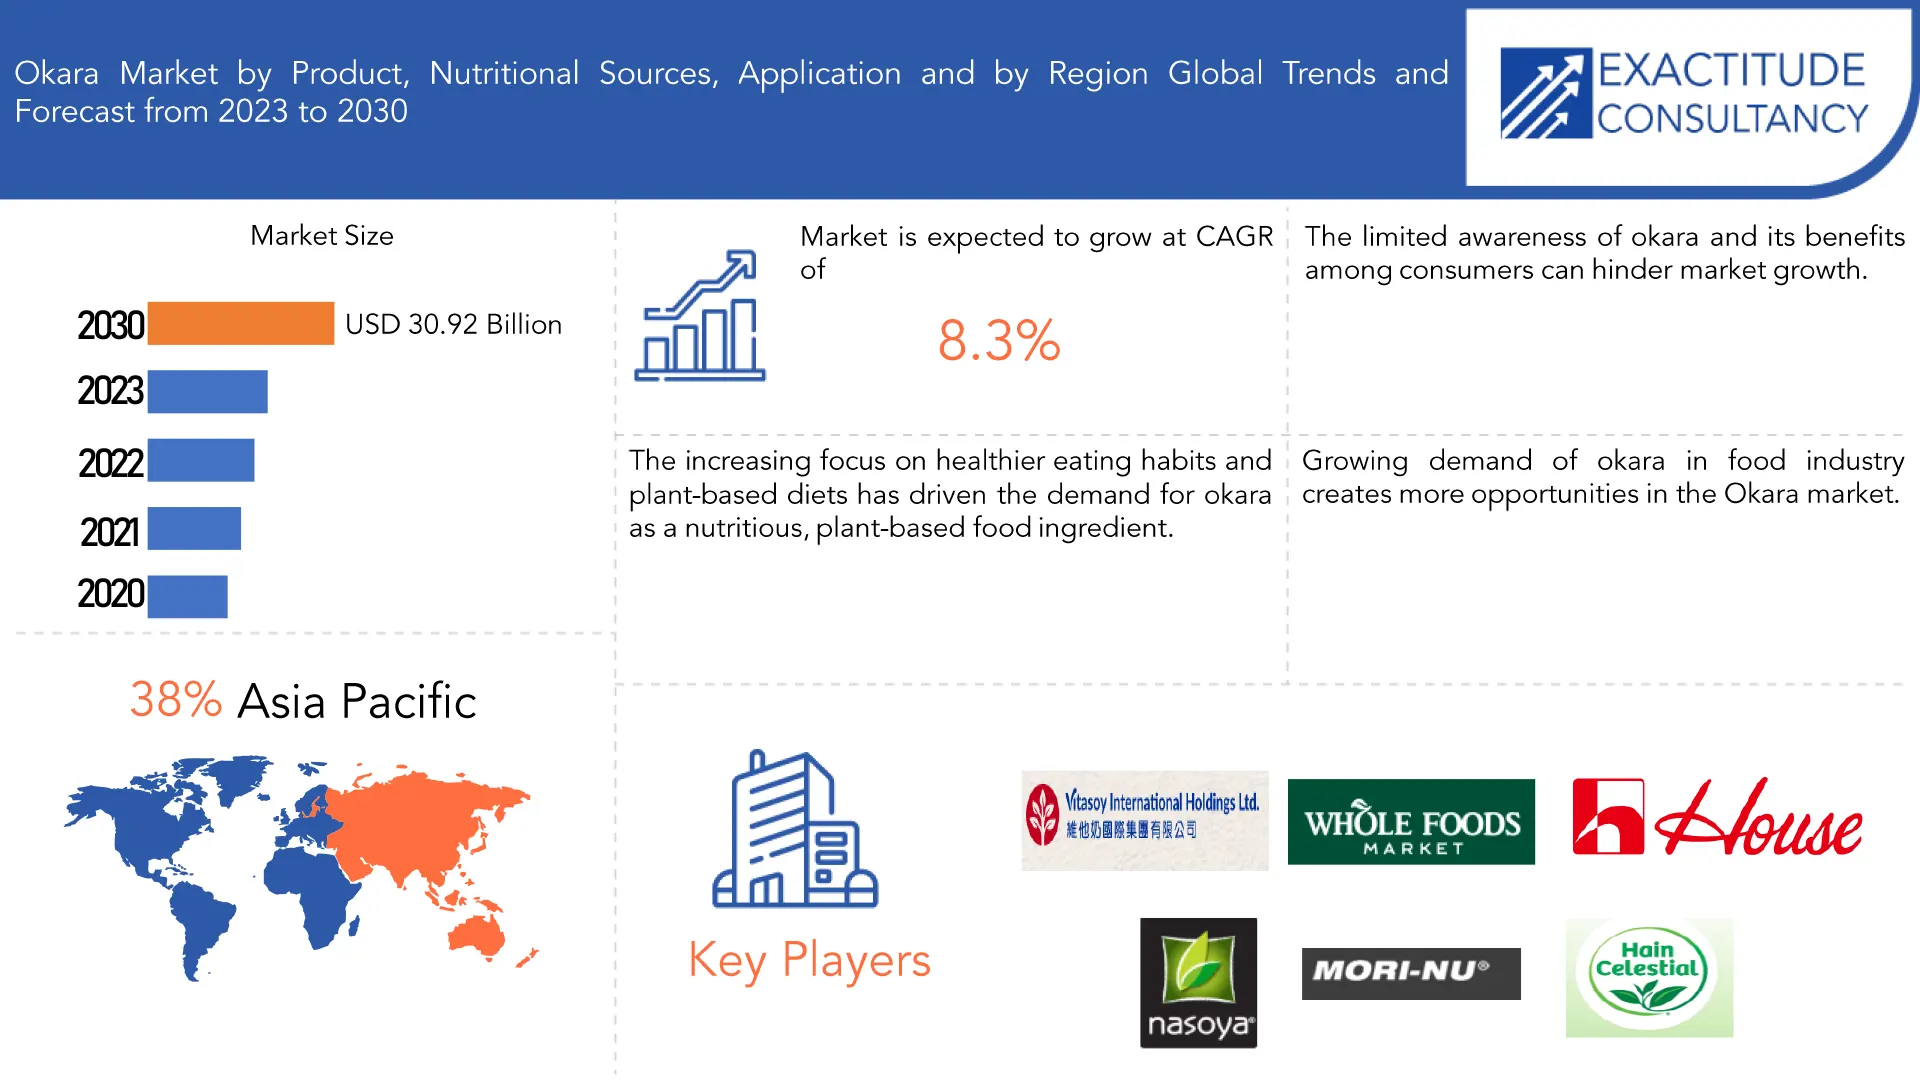
Okara Market by Product (Bakery, Noodles, Others), Nutritional Sources (Protein, Fat, Calcium, Minerals, Dietary Fiber) Application (Hotels, Restaurants and Catering, Food Processing, Household, Others) and Region, Global Trends and forecast from 2023 to 2030
Instant access to hundreds of data points and trends
- Market estimates from 2014-2029
- Competitive analysis, industry segmentation, financial benchmarks
- Incorporates SWOT, Porter's Five Forces and risk management frameworks
- PDF report or online database with Word, Excel and PowerPoint export options
- 100% money back guarantee
Market Overview
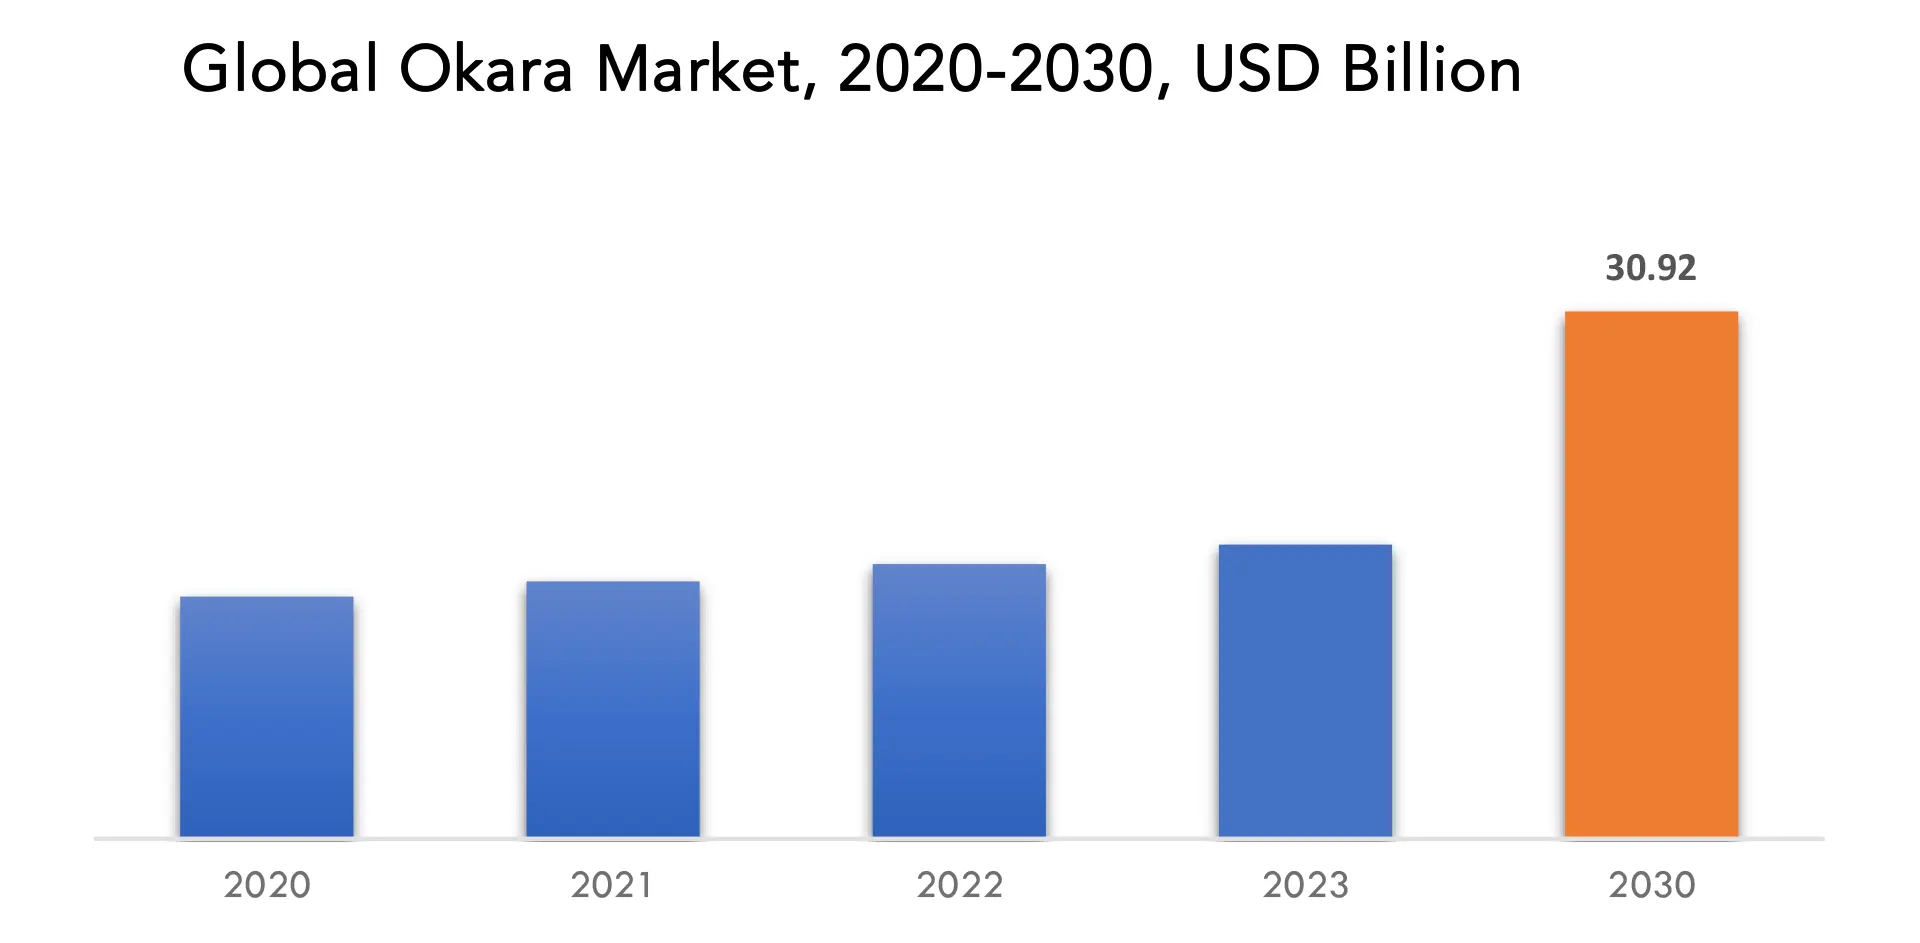
The Global Okara Market is anticipated to grow from USD 1.53 Billion in 2023 to USD 3.67 Billion by 2030, at a CAGR of 8.3% during the forecast period.
Okara, also known as soy pulp or tofu dregs, is a byproduct of the tofu-making process. Tofu, a popular plant-based protein source, is made from soybeans, and okara is what remains after the soy milk is extracted and the soybean solids are strained out. Okara has a mild, slightly nutty flavor and a soft, moist texture. Okara is a nutritious food and a good source of plant-based protein. It also covers fiber, vitamins, and minerals, making it a healthy addition to your diet. Okara can be used in a variety of dishes. It's often used in both sweet and savory recipes. For example, it can be added to smoothies, soups, stews, or used as a meat substitute in various dishes.
[caption id="attachment_32750" align="aligncenter" width="1920"]
The growth of dietary trends such as flexitarianism, where people reduce their meat consumption, and the adoption of veganism and vegetarianism, is fueling the demand for plant-based protein sources like okara. Okara is a sustainable food source because it is a byproduct of soy milk and tofu production, reducing food waste. Consumers who are concerned about sustainability and reducing their environmental footprint are more likely to choose products made from okara. As global food trends spread, traditional Asian ingredients like okara are gaining popularity in Western markets. This globalization of cuisines and ingredients is driving the demand for okara. Companies are actively promoting okara-based products, including tofu, yogurt, and meat substitutes. Innovative marketing and product development efforts are raising awareness and increasing its availability in the market. Ongoing research on soy-derived products, including okara, has led to positive health claims and endorsements, which further boost its appeal to health-conscious consumers. Given the increasing prevalence of food allergies and intolerances, okra’s allergen-free properties make it an attractive option for individuals seeking safe and nutritious alternatives. Some governments and health organizations support the promotion of plant-based diets for health and sustainability reasons. This support can influence consumer choices and encourage the food industry to offer more okara-based products.
| ATTRIBUTE | DETAILS |
| Study period | 2020-2030 |
| Base year | 2022 |
| Estimated year | 2023 |
| Forecasted year | 2023-2030 |
| Historical period | 2019-2021 |
| Unit | Value (USD Billion) (Kilotons) |
| Segmentation | By Product, By Nutritional Sources, By Application and By Region |
| By Product |
|
| By Nutritional Sources |
|
| By Application |
|
|
By Region |
|
Frequently Asked Questions
What is the market size for the Okara market?
The global Okara market is anticipated to grow from USD 1.53 Billion in 2023 to USD 3.67 Billion by 2030, at a CAGR of 8.3% during the forecast period.
Which region is domaining in the Okara market?
Asia pacific accounted for the largest market in the Okara market. Asia pacific accounted for the 38 percent market share of the global market value.
Who are the major key players in the Okara market?
Hain Celestial Group, House Foods Group, Morinaga & Co., Eden Foods, Sunrise Soya Foods, Pulmuone, Twin Oaks Tofu, Mori-Nu, Azumaya.
What are the Opportunties in the Okara market?
Okara can be used to create a variety of plant-based food products, such as vegan burgers, sausages, and meat alternatives. As the demand for plant-based diets continues to grow, there is a significant opportunity to develop and market innovative okara-based products to cater to this market segment.
Okara Market Segmentation Analysis
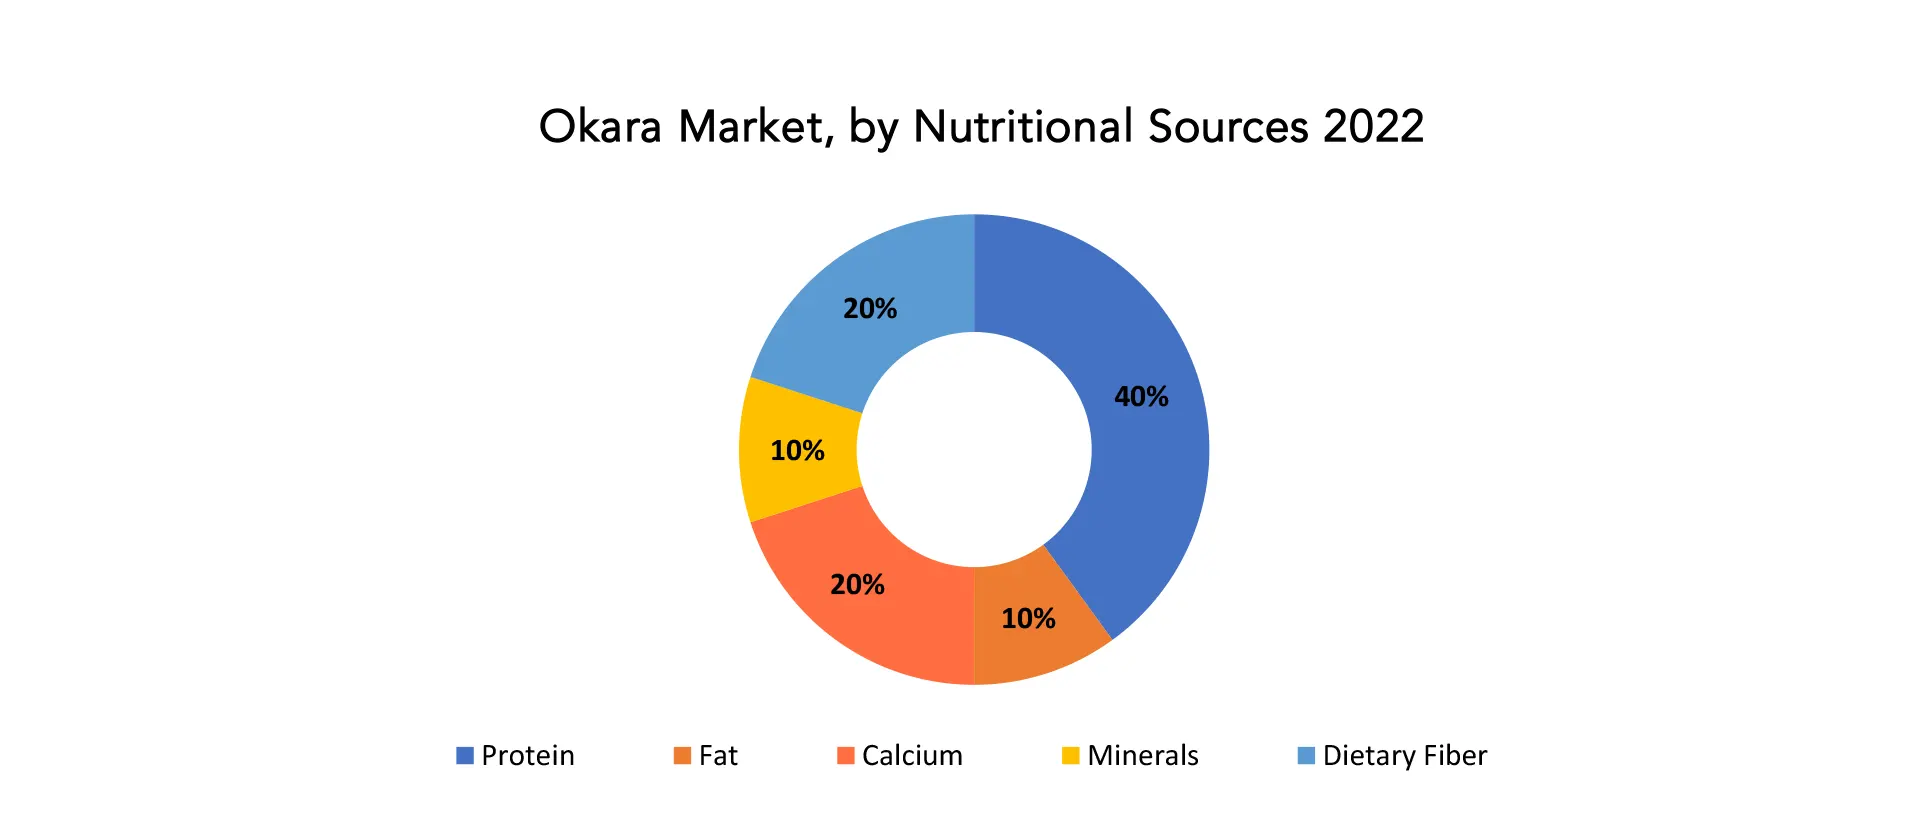
The global Okara market is divided into 4 segments product, Nutritional Sources, Application and region. by product the market is bifurcated into Bakery, Noodles, Others. By Nutritional Sources the market is bifurcated into Protein, Fat, Calcium, Minerals, Dietary Fiber. By application the market is bifurcated into Hotels, Restaurants and Catering, Food Processing, Household, Others. [caption id="attachment_32749" align="aligncenter" width="1920"]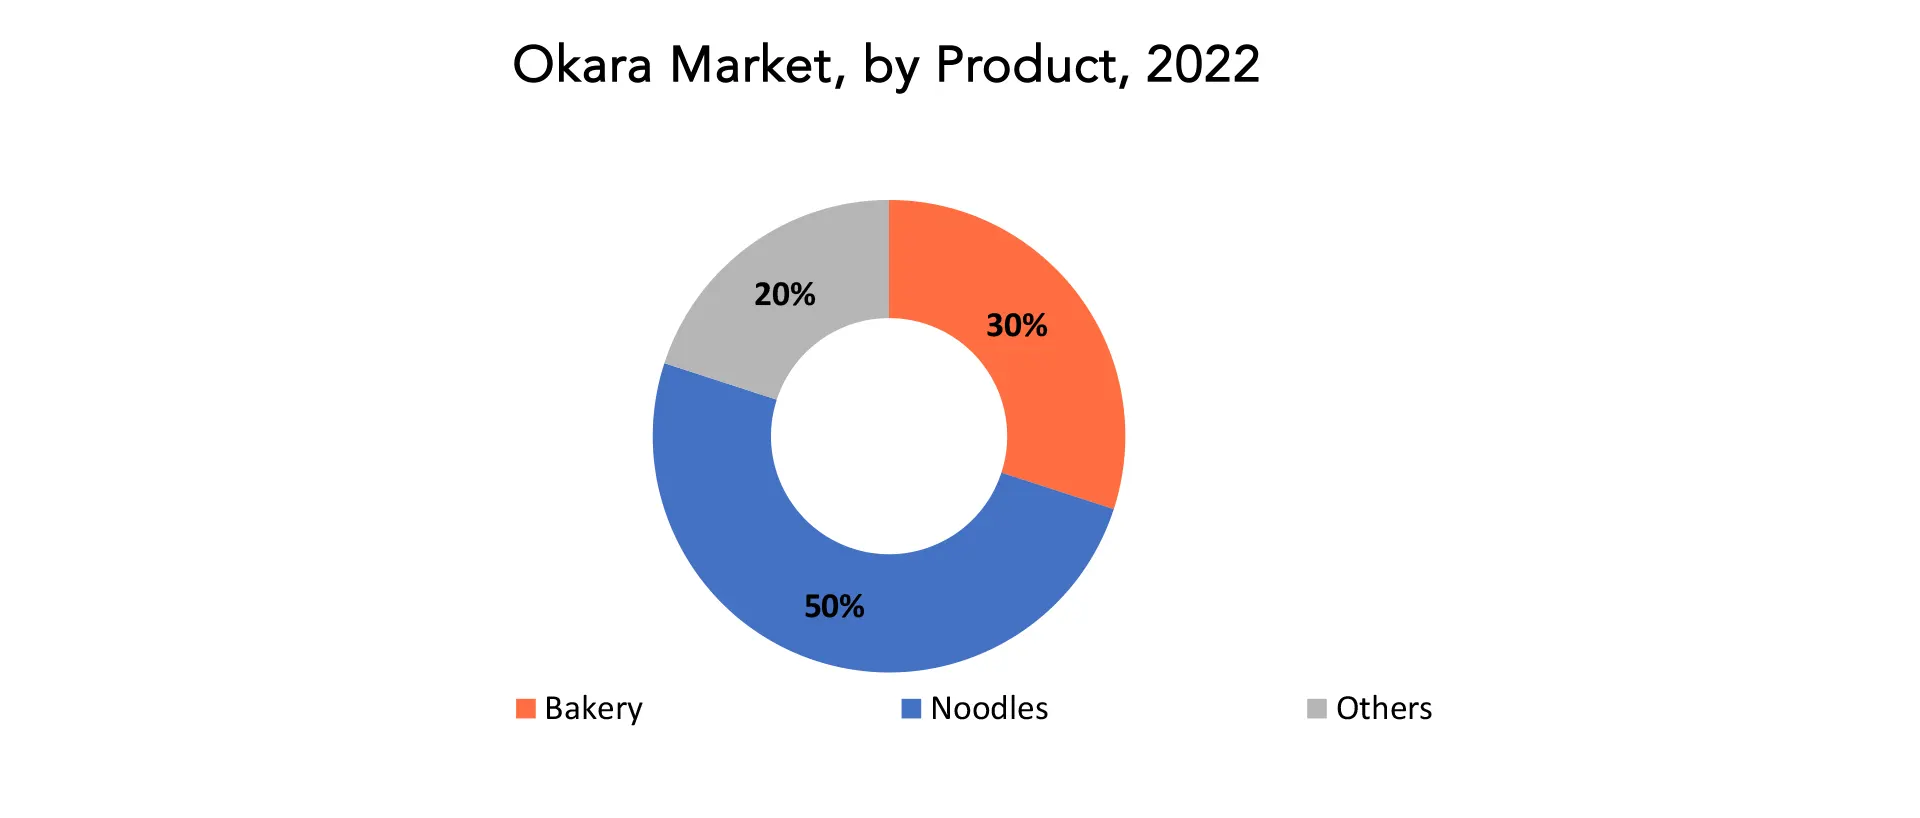
Okara Market Trends
- While okara has been a staple ingredient in traditional Asian cuisines, it is increasingly gaining popularity in Western countries. This expansion is due to the globalization of food trends and the incorporation of okara into various international cuisines.
- Okara is used as an ingredient in functional foods and dietary supplements, particularly in the form of protein supplements for athletes and health-conscious consumers.
- The rise of e-commerce has made okara products more accessible to a global audience. Many specialty and local producers sell their products online, broadening the market reach.
- Brands often tailor their marketing strategies to target specific consumer groups, such as fitness enthusiasts, seniors, and individuals looking for meat alternatives. Customized messaging helps reach a wider audience.
- Ongoing research on okara's nutritional properties and its applications in the food industry has led to the development of new okara-based products and improvements in existing ones.
- Consumers are increasingly interested in foods with clean labels and minimal processing. Okara products that are minimally processed and free from additives or preservatives align with this trend.
- Okara is being incorporated into culinary arts and showcased in upscale restaurants, which contributes to its status as a gourmet ingredient.
Competitive Landscape
The competitive landscape of the okara market is dynamic and includes various players ranging from producers of okara-based products to food manufacturers- Hain Celestial Group
- House Foods Group
- Morinaga & Co.
- Eden Foods
- Sunrise Soya Foods
- Pulmuone
- Twin Oaks Tofu
- Mori-Nu
- Azumaya
- Whole Foods Market
- Silk (WhiteWave Foods)
- Nasoya
- Vitasoy International
- Hodo
- The Bridge
- The Hain Daniels Group
- Harris Teeter
- Otokomae Tofu
- San Jose Tofu
- Karoun Dairies
Recent Developments:
13 October, 2021: Abokichi introduced its ABO Ramen, which includes okara for extra protein in the noodles to combat climate change and the recycling movement. () 17 September 2020: To support brain health, the Oh Soy team in Singapore created soy-based okara items such cream cheese, cream soup powder, and cheese slices with extra DHA. ()Regional Analysis
Asia pacific accounted for the largest market in the Okara market. Asia pacific accounted for the 38 % market share of the global market value. The Asia-Pacific region, mainly countries like China, Japan, and South Korea, is a important hub for tofu production. The popularity of tofu in Asian cuisines means that there is a substantial supply of okara as a natural byproduct. Okara is a nutritious food rich in protein, fiber, and other essential nutrients. This appeals to health-conscious consumers, and the nutritional profile aligns with Asian dietary preferences. In recent years, there has been invention in utilizing okara in various food products, including okara-based snacks, beverages, and meat substitutes. Food companies in the Asia-Pacific region have been active in developing and marketing these products. [caption id="attachment_32753" align="aligncenter" width="1920"]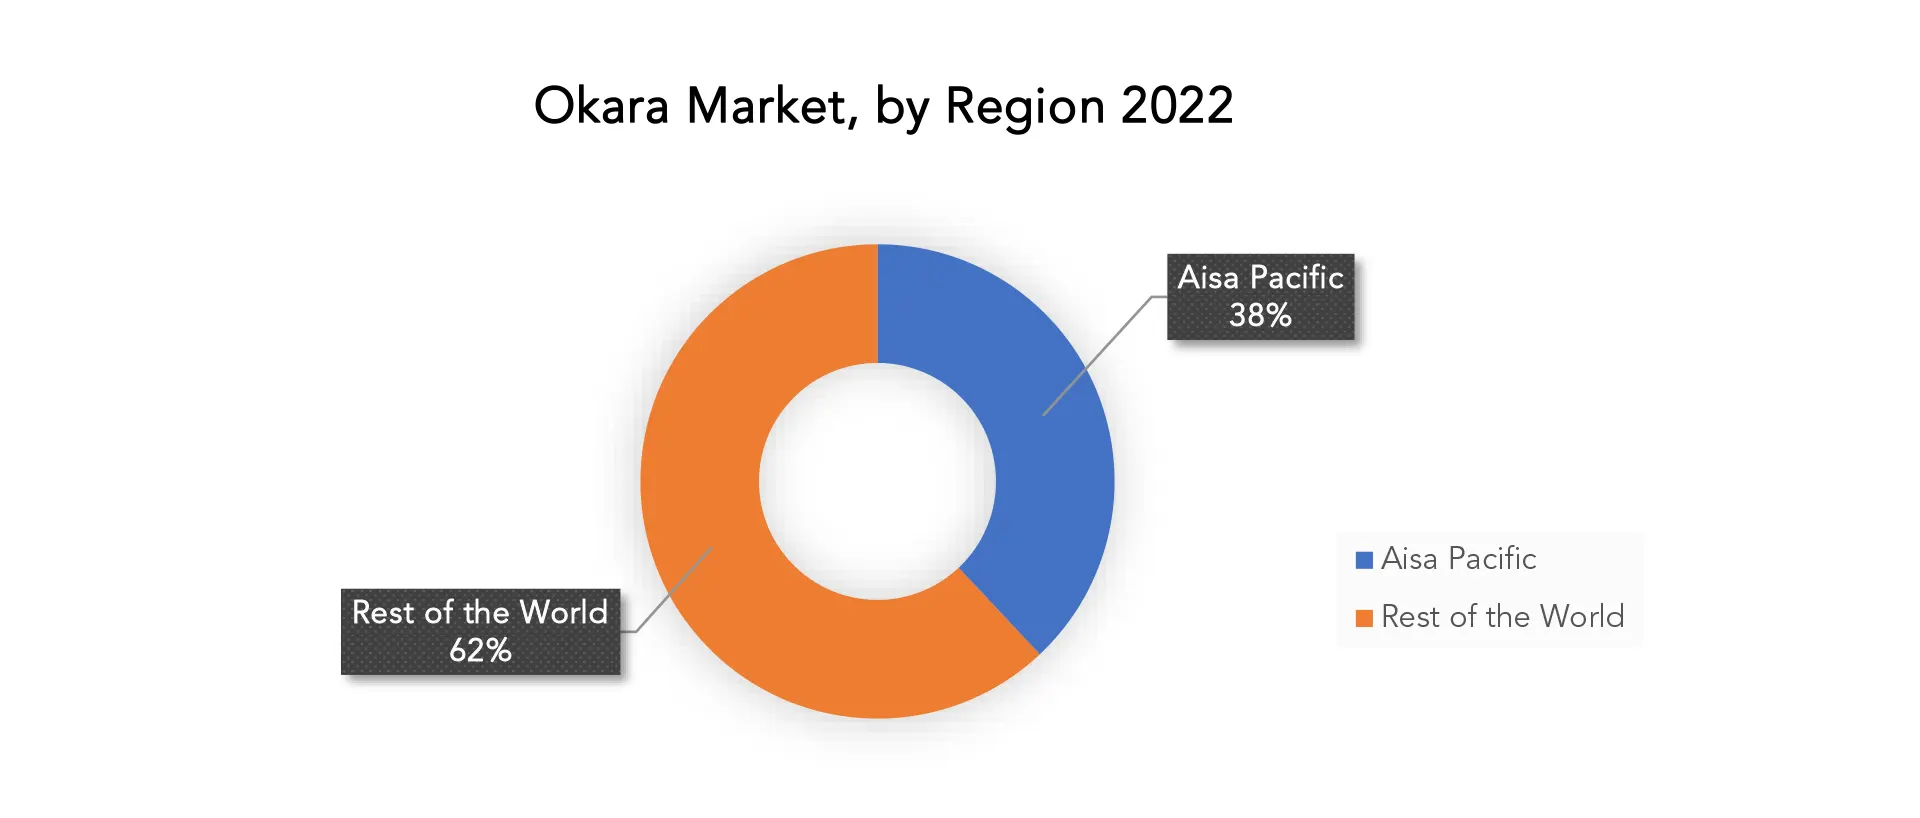
Target Audience for Okara Market
- Semiconductor Manufacturers
- NFC Device Manufacturers
- NFC Reader and Writer Hardware Providers
- Consumers and Individuals
- Businesses and Organizations
- Financial Institutions
- Payment Service Providers (PSPs)
- Retailers
- E-commerce Platforms
- Healthcare Providers
- Pharmaceutical Companies
- Transportation and Transit Authorities
- Airlines and Travel Companies
- Smart City Initiatives
- Government Agencies
- Manufacturers
- Supply Chain Companies
- Marketing and Advertising Agencies
- IoT Developers
- IoT Solution Providers
- Security and Authentication Providers
- Educational Institutions
- Event Organizers and Venue Managers
- Government Regulatory Bodies
- Standards Organizations
- Investors and Stakeholders
- Consulting and Advisory Services
Import & Export Data for Okara Market
Exactitude consultancy provides import and export data for the recent years. It also offers insights on production and consumption volume of the product. Understanding the import and export data is pivotal for any player in the Okara market. This knowledge equips businesses with strategic advantages, such as:- Identifying emerging markets with untapped potential.
- Adapting supply chain strategies to optimize cost-efficiency and market responsiveness.
- Navigating competition by assessing major players' trade dynamics.
Key insights
- Trade volume trends: our report dissects import and export data spanning the last five years to reveal crucial trends and growth patterns within the global Area Scan Camera Market. This data-driven exploration empowers readers with a deep understanding of the market's trajectory.
- Market players: gain insights into the leading players driving the Surgical Drill trade. From established giants to emerging contenders, our analysis highlights the key contributors to the import and export landscape.
- Geographical dynamics: delve into the geographical distribution of trade activities. Uncover which regions dominate exports and which ones hold the reins on imports, painting a comprehensive picture of the industry's global footprint.
- Product breakdown: by segmenting data based on Surgical Drill types –– we provide a granular view of trade preferences and shifts, enabling businesses to align strategies with the evolving technological landscape.
Segments Covered in the Okara Market Report
Okara Market by Product 2020-2030, USD Billion, (Kilotons)- Bakery
- Noodles
- Others
- Protein
- Fat
- Calcium
- Minerals
- Dietary Fiber
- Hotels
- Restaurants and Catering
- Food Processing
- Household
- Others
- North America
- Europe
- Asia Pacific
- South America
- Middle East and Africa
Key Question Answered
- What is the expected growth rate of the okara market over the next 7 years?
- Who are the major players in the okara market and what is their market share?
- What are the end-user industries driving market demand and what is their outlook?
- What are the opportunities for growth in emerging markets such as Asia-pacific, the middle east, and africa?
- How is the economic environment affecting the okara market, including factors such as interest rates, inflation, and exchange rates?
- What is the expected impact of government policies and regulations on the okara market?
- What is the current and forecasted size and growth rate of the okara market?
- What are the key drivers of growth in the okara market?
- Who are the major players in the market and what is their market share?
- What are the distribution channels and supply chain dynamics in the okara market?
- What are the technological advancements and innovations in the okara market and their impact on product development and growth?
- What are the regulatory considerations and their impact on the market?
- What are the challenges faced by players in the okara market and how are they addressing these challenges?
- What are the opportunities for growth and expansion in the okara market?
- What are the product products and specifications of leading players in the market?
- INTRODUCTION
- MARKET DEFINITION
- MARKET SEGMENTATION
- RESEARCH TIMELINES
- ASSUMPTIONS AND LIMITATIONS
- RESEARCH METHODOLOGY
- DATA MINING
- SECONDARY RESEARCH
- PRIMARY RESEARCH
- SUBJECT-MATTER EXPERTS’ ADVICE
- QUALITY CHECKS
- FINAL REVIEW
- DATA TRIANGULATION
- BOTTOM-UP APPROACH
- TOP-DOWN APPROACH
- RESEARCH FLOW
- DATA SOURCES
- DATA MINING
- EXECUTIVE SUMMARY
- MARKET OVERVIEW
- OKARA MARKET OUTLOOK
- MARKET DRIVERS
- MARKET RESTRAINTS
- MARKET OPPORTUNITIES
- IMPACT OF COVID-19 ON OKARA MARKET
- PORTER’S FIVE FORCES MODEL
- THREAT FROM NEW ENTRANTS
- THREAT FROM SUBSTITUTES
- BARGAINING POWER OF SUPPLIERS
- BARGAINING POWER OF CUSTOMERS
- DEGREE OF COMPETITION
- INDUSTRY VALUE CHAIN ANALYSIS
- OKARA MARKET OUTLOOK
- GLOBAL OKARA MARKET BY NUTRITIONAL SOURCES, 2020-2030, (USD BILLION) (KILOTONS)
- PROTEIN
- FAT
- CALCIUM
- MINERALS
- DIETARY FIBER
- GLOBAL OKARA MARKET BY PRODUCT, 2020-2030, (USD BILLION) (KILOTONS)
- BAKERY
- NOODLES
- OTHERS
- GLOBAL OKARA MARKET BY APPLICATION, 2020-2030, (USD BILLION) (KILOTONS)
- HOTELS
- RESTAURANTS AND CATERING
- FOOD PROCESSING
- HOUSEHOLD
- OTHERS
- GLOBAL OKARA MARKET BY REGION, 2020-2030, (USD BILLION) (KILOTONS)
- NORTH AMERICA
- US
- CANADA
- MEXICO
- SOUTH AMERICA
- BRAZIL
- ARGENTINA
- COLOMBIA
- REST OF SOUTH AMERICA
- EUROPE
- GERMANY
- UK
- FRANCE
- ITALY
- SPAIN
- RUSSIA
- REST OF EUROPE
- ASIA PACIFIC
- INDIA
- CHINA
- JAPAN
- SOUTH KOREA
- AUSTRALIA
- SOUTH-EAST ASIA
- REST OF ASIA PACIFIC
- MIDDLE EAST AND AFRICA
- UAE
- SAUDI ARABIA
- SOUTH AFRICA
- REST OF MIDDLE EAST AND AFRICA
- NORTH AMERICA
- COMPANY PROFILES* (BUSINESS OVERVIEW, COMPANY SNAPSHOT, PRODUCTS OFFERED, RECENT DEVELOPMENTS)
- HAIN CELESTIAL GROUP
- HOUSE FOODS GROUP
- MORINAGA & CO.
- EDEN FOODS
- SUNRISE SOYA FOODS
- PULMUONE
- TWIN OAKS TOFU
- MORI-NU
- AZUMAYA
- WHOLE FOODS MARKET
- SILK (WHITEWAVE FOODS)
- NASOYA
- VITASOY INTERNATIONAL
- HODO
- THE BRIDGE
- THE HAIN DANIELS GROUP
- HARRIS TEETER
- OTOKOMAE TOFU
- SAN JOSE TOFU
- KAROUN DAIRIES *THE COMPANY LIST IS INDICATIVE
LIST OF TABLES
TABLE 1 GLOBAL OKARA MARKET BY NUTRITIONAL SOURCES (USD BILLION) 2020-2030
TABLE 2 GLOBAL OKARA MARKET BY NUTRITIONAL SOURCES (KILOTONS) 2020-2030
TABLE 3 GLOBAL OKARA MARKET BY PRODUCT (USD BILLION) 2020-2030
TABLE 4 GLOBAL OKARA MARKET BY PRODUCT (KILOTONS) 2020-2030
TABLE 5 GLOBAL OKARA MARKET BY APPLICATION (USD BILLION) 2020-2030
TABLE 6 GLOBAL OKARA MARKET BY APPLICATION (KILOTONS) 2020-2030
TABLE 7 GLOBAL OKARA MARKET BY REGION (USD BILLION) 2020-2030
TABLE 8 GLOBAL OKARA MARKET BY REGION (KILOTONS) 2020-2030
TABLE 9 NORTH AMERICA OKARA MARKET BY COUNTRY (USD BILLION) 2020-2030
TABLE 10 NORTH AMERICA OKARA MARKET BY COUNTRY (KILOTONS) 2020-2030
TABLE 11 NORTH AMERICA OKARA MARKET BY NUTRITIONAL SOURCES (USD BILLION) 2020-2030
TABLE 12 NORTH AMERICA OKARA MARKET BY NUTRITIONAL SOURCES (KILOTONS) 2020-2030
TABLE 13 NORTH AMERICA OKARA MARKET BY PRODUCT (USD BILLION) 2020-2030
TABLE 14 NORTH AMERICA OKARA MARKET BY PRODUCT (KILOTONS) 2020-2030
TABLE 15 NORTH AMERICA OKARA MARKET BY APPLICATION (USD BILLION) 2020-2030
TABLE 16 NORTH AMERICA OKARA MARKET BY APPLICATION (KILOTONS) 2020-2030
TABLE 17 US OKARA MARKET BY NUTRITIONAL SOURCES (USD BILLION) 2020-2030
TABLE 18 US OKARA MARKET BY NUTRITIONAL SOURCES (KILOTONS) 2020-2030
TABLE 19 US OKARA MARKET BY PRODUCT (USD BILLION) 2020-2030
TABLE 20 US OKARA MARKET BY PRODUCT (KILOTONS) 2020-2030
TABLE 21 US OKARA MARKET BY APPLICATION (USD BILLION) 2020-2030
TABLE 22 US OKARA MARKET BY APPLICATION (KILOTONS) 2020-2030
TABLE 23 CANADA OKARA MARKET BY NUTRITIONAL SOURCES (USD BILLION) 2020-2030
TABLE 24 CANADA OKARA MARKET BY NUTRITIONAL SOURCES (KILOTONS) 2020-2030
TABLE 25 CANADA OKARA MARKET BY PRODUCT (USD BILLION) 2020-2030
TABLE 26 CANADA OKARA MARKET BY PRODUCT (KILOTONS) 2020-2030
TABLE 27 CANADA OKARA MARKET BY APPLICATION (USD BILLION) 2020-2030
TABLE 28 CANADA OKARA MARKET BY APPLICATION (KILOTONS) 2020-2030
TABLE 29 MEXICO OKARA MARKET BY NUTRITIONAL SOURCES (USD BILLION) 2020-2030
TABLE 30 MEXICO OKARA MARKET BY NUTRITIONAL SOURCES (KILOTONS) 2020-2030
TABLE 31 MEXICO OKARA MARKET BY PRODUCT (USD BILLION) 2020-2030
TABLE 32 MEXICO OKARA MARKET BY PRODUCT (KILOTONS) 2020-2030
TABLE 33 MEXICO OKARA MARKET BY APPLICATION (USD BILLION) 2020-2030
TABLE 34 MEXICO OKARA MARKET BY APPLICATION (KILOTONS) 2020-2030
TABLE 35 SOUTH AMERICA OKARA MARKET BY COUNTRY (USD BILLION) 2020-2030
TABLE 36 SOUTH AMERICA OKARA MARKET BY COUNTRY (KILOTONS) 2020-2030
TABLE 37 SOUTH AMERICA OKARA MARKET BY NUTRITIONAL SOURCES (USD BILLION) 2020-2030
TABLE 38 SOUTH AMERICA OKARA MARKET BY NUTRITIONAL SOURCES (KILOTONS) 2020-2030
TABLE 39 SOUTH AMERICA OKARA MARKET BY PRODUCT (USD BILLION) 2020-2030
TABLE 40 SOUTH AMERICA OKARA MARKET BY PRODUCT (KILOTONS) 2020-2030
TABLE 41 SOUTH AMERICA OKARA MARKET BY APPLICATION (USD BILLION) 2020-2030
TABLE 42 SOUTH AMERICA OKARA MARKET BY APPLICATION (KILOTONS) 2020-2030
TABLE 43 BRAZIL OKARA MARKET BY NUTRITIONAL SOURCES (USD BILLION) 2020-2030
TABLE 44 BRAZIL OKARA MARKET BY NUTRITIONAL SOURCES (KILOTONS) 2020-2030
TABLE 45 BRAZIL OKARA MARKET BY PRODUCT (USD BILLION) 2020-2030
TABLE 46 BRAZIL OKARA MARKET BY PRODUCT (KILOTONS) 2020-2030
TABLE 47 BRAZIL OKARA MARKET BY APPLICATION (USD BILLION) 2020-2030
TABLE 48 BRAZIL OKARA MARKET BY APPLICATION (KILOTONS) 2020-2030
TABLE 49 ARGENTINA OKARA MARKET BY NUTRITIONAL SOURCES (USD BILLION) 2020-2030
TABLE 50 ARGENTINA OKARA MARKET BY NUTRITIONAL SOURCES (KILOTONS) 2020-2030
TABLE 51 ARGENTINA OKARA MARKET BY PRODUCT (USD BILLION) 2020-2030
TABLE 52 ARGENTINA OKARA MARKET BY PRODUCT (KILOTONS) 2020-2030
TABLE 53 ARGENTINA OKARA MARKET BY APPLICATION (USD BILLION) 2020-2030
TABLE 54 ARGENTINA OKARA MARKET BY APPLICATION (KILOTONS) 2020-2030
TABLE 55 COLOMBIA OKARA MARKET BY NUTRITIONAL SOURCES (USD BILLION) 2020-2030
TABLE 56 COLOMBIA OKARA MARKET BY NUTRITIONAL SOURCES (KILOTONS) 2020-2030
TABLE 57 COLOMBIA OKARA MARKET BY PRODUCT (USD BILLION) 2020-2030
TABLE 58 COLOMBIA OKARA MARKET BY PRODUCT (KILOTONS) 2020-2030
TABLE 59 COLOMBIA OKARA MARKET BY APPLICATION (USD BILLION) 2020-2030
TABLE 60 COLOMBIA OKARA MARKET BY APPLICATION (KILOTONS) 2020-2030
TABLE 61 REST OF SOUTH AMERICA OKARA MARKET BY NUTRITIONAL SOURCES (USD BILLION) 2020-2030
TABLE 62 REST OF SOUTH AMERICA OKARA MARKET BY NUTRITIONAL SOURCES (KILOTONS) 2020-2030
TABLE 63 REST OF SOUTH AMERICA OKARA MARKET BY PRODUCT (USD BILLION) 2020-2030
TABLE 64 REST OF SOUTH AMERICA OKARA MARKET BY PRODUCT (KILOTONS) 2020-2030
TABLE 65 REST OF SOUTH AMERICA OKARA MARKET BY APPLICATION (USD BILLION) 2020-2030
TABLE 66 REST OF SOUTH AMERICA OKARA MARKET BY APPLICATION (KILOTONS) 2020-2030
TABLE 67 ASIA-PACIFIC OKARA MARKET BY COUNTRY (USD BILLION) 2020-2030
TABLE 68 ASIA-PACIFIC OKARA MARKET BY COUNTRY (KILOTONS) 2020-2030
TABLE 69 ASIA-PACIFIC OKARA MARKET BY NUTRITIONAL SOURCES (USD BILLION) 2020-2030
TABLE 70 ASIA-PACIFIC OKARA MARKET BY NUTRITIONAL SOURCES (KILOTONS) 2020-2030
TABLE 71 ASIA-PACIFIC OKARA MARKET BY PRODUCT (USD BILLION) 2020-2030
TABLE 72 ASIA-PACIFIC OKARA MARKET BY PRODUCT (KILOTONS) 2020-2030
TABLE 73 ASIA-PACIFIC OKARA MARKET BY APPLICATION (USD BILLION) 2020-2030
TABLE 74 ASIA-PACIFIC OKARA MARKET BY APPLICATION (KILOTONS) 2020-2030
TABLE 75 INDIA OKARA MARKET BY NUTRITIONAL SOURCES (USD BILLION) 2020-2030
TABLE 76 INDIA OKARA MARKET BY NUTRITIONAL SOURCES (KILOTONS) 2020-2030
TABLE 77 INDIA OKARA MARKET BY PRODUCT (USD BILLION) 2020-2030
TABLE 78 INDIA OKARA MARKET BY PRODUCT (KILOTONS) 2020-2030
TABLE 79 INDIA OKARA MARKET BY APPLICATION (USD BILLION) 2020-2030
TABLE 80 INDIA OKARA MARKET BY APPLICATION (KILOTONS) 2020-2030
TABLE 81 CHINA OKARA MARKET BY NUTRITIONAL SOURCES (USD BILLION) 2020-2030
TABLE 82 CHINA OKARA MARKET BY NUTRITIONAL SOURCES (KILOTONS) 2020-2030
TABLE 83 CHINA OKARA MARKET BY PRODUCT (USD BILLION) 2020-2030
TABLE 84 CHINA OKARA MARKET BY PRODUCT (KILOTONS) 2020-2030
TABLE 85 CHINA OKARA MARKET BY APPLICATION (USD BILLION) 2020-2030
TABLE 86 CHINA OKARA MARKET BY APPLICATION (KILOTONS) 2020-2030
TABLE 87 JAPAN OKARA MARKET BY NUTRITIONAL SOURCES (USD BILLION) 2020-2030
TABLE 88 JAPAN OKARA MARKET BY NUTRITIONAL SOURCES (KILOTONS) 2020-2030
TABLE 89 JAPAN OKARA MARKET BY PRODUCT (USD BILLION) 2020-2030
TABLE 90 JAPAN OKARA MARKET BY PRODUCT (KILOTONS) 2020-2030
TABLE 91 JAPAN OKARA MARKET BY APPLICATION (USD BILLION) 2020-2030
TABLE 92 JAPAN OKARA MARKET BY APPLICATION (KILOTONS) 2020-2030
TABLE 93 SOUTH KOREA OKARA MARKET BY NUTRITIONAL SOURCES (USD BILLION) 2020-2030
TABLE 94 SOUTH KOREA OKARA MARKET BY NUTRITIONAL SOURCES (KILOTONS) 2020-2030
TABLE 95 SOUTH KOREA OKARA MARKET BY PRODUCT (USD BILLION) 2020-2030
TABLE 96 SOUTH KOREA OKARA MARKET BY PRODUCT (KILOTONS) 2020-2030
TABLE 97 SOUTH KOREA OKARA MARKET BY APPLICATION (USD BILLION) 2020-2030
TABLE 98 SOUTH KOREA OKARA MARKET BY APPLICATION (KILOTONS) 2020-2030
TABLE 99 AUSTRALIA OKARA MARKET BY NUTRITIONAL SOURCES (USD BILLION) 2020-2030
TABLE 100 AUSTRALIA OKARA MARKET BY NUTRITIONAL SOURCES (KILOTONS) 2020-2030
TABLE 101 AUSTRALIA OKARA MARKET BY PRODUCT (USD BILLION) 2020-2030
TABLE 102 AUSTRALIA OKARA MARKET BY PRODUCT (KILOTONS) 2020-2030
TABLE 103 AUSTRALIA OKARA MARKET BY APPLICATION (USD BILLION) 2020-2030
TABLE 104 AUSTRALIA OKARA MARKET BY APPLICATION (KILOTONS) 2020-2030
TABLE 105 SOUTH-EAST ASIA OKARA MARKET BY NUTRITIONAL SOURCES (USD BILLION) 2020-2030
TABLE 106 SOUTH-EAST ASIA OKARA MARKET BY NUTRITIONAL SOURCES (KILOTONS) 2020-2030
TABLE 107 SOUTH-EAST ASIA OKARA MARKET BY PRODUCT (USD BILLION) 2020-2030
TABLE 108 SOUTH-EAST ASIA OKARA MARKET BY PRODUCT (KILOTONS) 2020-2030
TABLE 109 SOUTH-EAST ASIA OKARA MARKET BY APPLICATION (USD BILLION) 2020-2030
TABLE 110 SOUTH-EAST ASIA OKARA MARKET BY APPLICATION (KILOTONS) 2020-2030
TABLE 111 REST OF ASIA PACIFIC OKARA MARKET BY NUTRITIONAL SOURCES (USD BILLION) 2020-2030
TABLE 112 REST OF ASIA PACIFIC OKARA MARKET BY NUTRITIONAL SOURCES (KILOTONS) 2020-2030
TABLE 113 REST OF ASIA PACIFIC OKARA MARKET BY PRODUCT (USD BILLION) 2020-2030
TABLE 114 REST OF ASIA PACIFIC OKARA MARKET BY PRODUCT (KILOTONS) 2020-2030
TABLE 115 REST OF ASIA PACIFIC OKARA MARKET BY APPLICATION (USD BILLION) 2020-2030
TABLE 116 REST OF ASIA PACIFIC OKARA MARKET BY APPLICATION (KILOTONS) 2020-2030
TABLE 117 EUROPE OKARA MARKET BY COUNTRY (USD BILLION) 2020-2030
TABLE 118 EUROPE OKARA MARKET BY COUNTRY (KILOTONS) 2020-2030
TABLE 119 EUROPE OKARA MARKET BY NUTRITIONAL SOURCES (USD BILLION) 2020-2030
TABLE 120 EUROPE OKARA MARKET BY NUTRITIONAL SOURCES (KILOTONS) 2020-2030
TABLE 121 EUROPE OKARA MARKET BY PRODUCT (USD BILLION) 2020-2030
TABLE 122 EUROPE OKARA MARKET BY PRODUCT (KILOTONS) 2020-2030
TABLE 123 EUROPE OKARA MARKET BY APPLICATION (USD BILLION) 2020-2030
TABLE 124 EUROPE OKARA MARKET BY APPLICATION (KILOTONS) 2020-2030
TABLE 125 GERMANY OKARA MARKET BY NUTRITIONAL SOURCES (USD BILLION) 2020-2030
TABLE 126 GERMANY OKARA MARKET BY NUTRITIONAL SOURCES (KILOTONS) 2020-2030
TABLE 127 GERMANY OKARA MARKET BY PRODUCT (USD BILLION) 2020-2030
TABLE 128 GERMANY OKARA MARKET BY PRODUCT (KILOTONS) 2020-2030
TABLE 129 GERMANY OKARA MARKET BY APPLICATION (USD BILLION) 2020-2030
TABLE 130 GERMANY OKARA MARKET BY APPLICATION (KILOTONS) 2020-2030
TABLE 131 UK OKARA MARKET BY NUTRITIONAL SOURCES (USD BILLION) 2020-2030
TABLE 132 UK OKARA MARKET BY NUTRITIONAL SOURCES (KILOTONS) 2020-2030
TABLE 133 UK OKARA MARKET BY PRODUCT (USD BILLION) 2020-2030
TABLE 134 UK OKARA MARKET BY PRODUCT (KILOTONS) 2020-2030
TABLE 135 UK OKARA MARKET BY APPLICATION (USD BILLION) 2020-2030
TABLE 136 UK OKARA MARKET BY APPLICATION (KILOTONS) 2020-2030
TABLE 137 FRANCE OKARA MARKET BY NUTRITIONAL SOURCES (USD BILLION) 2020-2030
TABLE 138 FRANCE OKARA MARKET BY NUTRITIONAL SOURCES (KILOTONS) 2020-2030
TABLE 139 FRANCE OKARA MARKET BY PRODUCT (USD BILLION) 2020-2030
TABLE 140 FRANCE OKARA MARKET BY PRODUCT (KILOTONS) 2020-2030
TABLE 141 FRANCE OKARA MARKET BY APPLICATION (USD BILLION) 2020-2030
TABLE 142 FRANCE OKARA MARKET BY APPLICATION (KILOTONS) 2020-2030
TABLE 143 ITALY OKARA MARKET BY NUTRITIONAL SOURCES (USD BILLION) 2020-2030
TABLE 144 ITALY OKARA MARKET BY NUTRITIONAL SOURCES (KILOTONS) 2020-2030
TABLE 145 ITALY OKARA MARKET BY PRODUCT (USD BILLION) 2020-2030
TABLE 146 ITALY OKARA MARKET BY PRODUCT (KILOTONS) 2020-2030
TABLE 147 ITALY OKARA MARKET BY APPLICATION (USD BILLION) 2020-2030
TABLE 148 ITALY OKARA MARKET BY APPLICATION (KILOTONS) 2020-2030
TABLE 149 SPAIN OKARA MARKET BY NUTRITIONAL SOURCES (USD BILLION) 2020-2030
TABLE 150 SPAIN OKARA MARKET BY NUTRITIONAL SOURCES (KILOTONS) 2020-2030
TABLE 151 SPAIN OKARA MARKET BY PRODUCT (USD BILLION) 2020-2030
TABLE 152 SPAIN OKARA MARKET BY PRODUCT (KILOTONS) 2020-2030
TABLE 153 SPAIN OKARA MARKET BY APPLICATION (USD BILLION) 2020-2030
TABLE 154 SPAIN OKARA MARKET BY APPLICATION (KILOTONS) 2020-2030
TABLE 155 RUSSIA OKARA MARKET BY NUTRITIONAL SOURCES (USD BILLION) 2020-2030
TABLE 156 RUSSIA OKARA MARKET BY NUTRITIONAL SOURCES (KILOTONS) 2020-2030
TABLE 157 RUSSIA OKARA MARKET BY PRODUCT (USD BILLION) 2020-2030
TABLE 158 RUSSIA OKARA MARKET BY PRODUCT (KILOTONS) 2020-2030
TABLE 159 RUSSIA OKARA MARKET BY APPLICATION (USD BILLION) 2020-2030
TABLE 160 RUSSIA OKARA MARKET BY APPLICATION (KILOTONS) 2020-2030
TABLE 161 REST OF EUROPE OKARA MARKET BY NUTRITIONAL SOURCES (USD BILLION) 2020-2030
TABLE 162 REST OF EUROPE OKARA MARKET BY NUTRITIONAL SOURCES (KILOTONS) 2020-2030
TABLE 163 REST OF EUROPE OKARA MARKET BY PRODUCT (USD BILLION) 2020-2030
TABLE 164 REST OF EUROPE OKARA MARKET BY PRODUCT (KILOTONS) 2020-2030
TABLE 165 REST OF EUROPE OKARA MARKET BY APPLICATION (USD BILLION) 2020-2030
TABLE 166 REST OF EUROPE OKARA MARKET BY APPLICATION (KILOTONS) 2020-2030
TABLE 167 MIDDLE EAST AND AFRICA OKARA MARKET BY COUNTRY (USD BILLION) 2020-2030
TABLE 168 MIDDLE EAST AND AFRICA OKARA MARKET BY COUNTRY (KILOTONS) 2020-2030
TABLE 169 MIDDLE EAST AND AFRICA OKARA MARKET BY NUTRITIONAL SOURCES (USD BILLION) 2020-2030
TABLE 170 MIDDLE EAST AND AFRICA OKARA MARKET BY NUTRITIONAL SOURCES (KILOTONS) 2020-2030
TABLE 171 MIDDLE EAST AND AFRICA OKARA MARKET BY PRODUCT (USD BILLION) 2020-2030
TABLE 172 MIDDLE EAST AND AFRICA OKARA MARKET BY PRODUCT (KILOTONS) 2020-2030
TABLE 173 MIDDLE EAST AND AFRICA OKARA MARKET BY APPLICATION (USD BILLION) 2020-2030
TABLE 174 MIDDLE EAST AND AFRICA OKARA MARKET BY APPLICATION (KILOTONS) 2020-2030
TABLE 175 UAE OKARA MARKET BY NUTRITIONAL SOURCES (USD BILLION) 2020-2030
TABLE 176 UAE OKARA MARKET BY NUTRITIONAL SOURCES (KILOTONS) 2020-2030
TABLE 177 UAE OKARA MARKET BY PRODUCT (USD BILLION) 2020-2030
TABLE 178 UAE OKARA MARKET BY PRODUCT (KILOTONS) 2020-2030
TABLE 179 UAE OKARA MARKET BY APPLICATION (USD BILLION) 2020-2030
TABLE 180 UAE OKARA MARKET BY APPLICATION (KILOTONS) 2020-2030
TABLE 181 SAUDI ARABIA OKARA MARKET BY NUTRITIONAL SOURCES (USD BILLION) 2020-2030
TABLE 182 SAUDI ARABIA OKARA MARKET BY NUTRITIONAL SOURCES (KILOTONS) 2020-2030
TABLE 183 SAUDI ARABIA OKARA MARKET BY PRODUCT (USD BILLION) 2020-2030
TABLE 184 SAUDI ARABIA OKARA MARKET BY PRODUCT (KILOTONS) 2020-2030
TABLE 185 SAUDI ARABIA OKARA MARKET BY APPLICATION (USD BILLION) 2020-2030
TABLE 186 SAUDI ARABIA OKARA MARKET BY APPLICATION (KILOTONS) 2020-2030
TABLE 187 SOUTH AFRICA OKARA MARKET BY NUTRITIONAL SOURCES (USD BILLION) 2020-2030
TABLE 188 SOUTH AFRICA OKARA MARKET BY NUTRITIONAL SOURCES (KILOTONS) 2020-2030
TABLE 189 SOUTH AFRICA OKARA MARKET BY PRODUCT (USD BILLION) 2020-2030
TABLE 190 SOUTH AFRICA OKARA MARKET BY PRODUCT (KILOTONS) 2020-2030
TABLE 191 SOUTH AFRICA OKARA MARKET BY APPLICATION (USD BILLION) 2020-2030
TABLE 192 SOUTH AFRICA OKARA MARKET BY APPLICATION (KILOTONS) 2020-2030
TABLE 193 REST OF MIDDLE EAST AND AFRICA OKARA MARKET BY NUTRITIONAL SOURCES (USD BILLION) 2020-2030
TABLE 194 REST OF MIDDLE EAST AND AFRICA OKARA MARKET BY NUTRITIONAL SOURCES (KILOTONS) 2020-2030
TABLE 195 REST OF MIDDLE EAST AND AFRICA OKARA MARKET BY PRODUCT (USD BILLION) 2020-2030
TABLE 196 REST OF MIDDLE EAST AND AFRICA OKARA MARKET BY PRODUCT (KILOTONS) 2020-2030
TABLE 197 REST OF MIDDLE EAST AND AFRICA OKARA MARKET BY APPLICATION (USD BILLION) 2020-2030
TABLE 198 REST OF MIDDLE EAST AND AFRICA OKARA MARKET BY APPLICATION (KILOTONS) 2020-2030
LIST OF FIGURES
FIGURE 1 MARKET DYNAMICS
FIGURE 2 MARKET SEGMENTATION
FIGURE 3 REPORT TIMELINES: YEARS CONSIDERED
FIGURE 4 DATA TRIANGULATION
FIGURE 5 BOTTOM-UP APPROACH
FIGURE 6 TOP-DOWN APPROACH
FIGURE 7 RESEARCH FLOW
FIGURE 8 GLOBAL OKARA MARKET BY NUTRITIONAL SOURCES USD BILLION, 2020-2030
FIGURE 9 GLOBAL OKARA MARKET BY PRODUCT, USD BILLION, 2020-2030
FIGURE 10 GLOBAL OKARA MARKET BY APPLICATION, USD BILLION, 2020-2030
FIGURE 11 GLOBAL OKARA MARKET BY REGION, USD BILLION, 2020-2030
FIGURE 12 PORTER’S FIVE FORCES MODEL
FIGURE 13 GLOBAL OKARA MARKET BY NUTRITIONAL SOURCES, USD BILLION 2022
FIGURE 14 GLOBAL OKARA MARKET BY PRODUCT, USD BILLION 2022
FIGURE 15 GLOBAL OKARA MARKET BY APPLICATION, USD BILLION 2022
FIGURE 16 GLOBAL OKARA MARKET BY REGION, USD BILLION 2022
FIGURE 17 MARKET SHARE ANALYSIS
FIGURE 18 HAIN CELESTIAL GROUP: COMPANY SNAPSHOT
FIGURE 19 HOUSE FOODS GROUP: COMPANY SNAPSHOT
FIGURE 20 MORINAGA & CO.: COMPANY SNAPSHOT
FIGURE 21 EDEN FOODS: COMPANY SNAPSHOT
FIGURE 22 SUNRISE SOYA FOODS: COMPANY SNAPSHOT
FIGURE 23 PULMUONE: COMPANY SNAPSHOT
FIGURE 24 TWIN OAKS TOFU: COMPANY SNAPSHOT
FIGURE 25 MORI-NU: COMPANY SNAPSHOT
FIGURE 26 AZUMAYA: COMPANY SNAPSHOT
FIGURE 27 WHOLE FOODS MARKET: COMPANY SNAPSHOT
FIGURE 28 SILK: COMPANY SNAPSHOT
FIGURE 29 NASOYA: COMPANY SNAPSHOT
FIGURE 30 VITASOY INTERNATIONAL: COMPANY SNAPSHOT
FIGURE 31 HODO: COMPANY SNAPSHOT
FIGURE 32 THE BRIDGE: COMPANY SNAPSHOT
FIGURE 33 THE HAIN DANIELS GROUP: COMPANY SNAPSHOT
FIGURE 34 HARRIS TEETER: COMPANY SNAPSHOT
FIGURE 35 OTOKOMAE TOFU: COMPANY SNAPSHOT
DOWNLOAD FREE SAMPLE REPORT
License Type
SPEAK WITH OUR ANALYST
Want to know more about the report or any specific requirement?
WANT TO CUSTOMIZE THE REPORT?
Our Clients Speak
We asked them to research ‘ Equipment market’ all over the world, and their whole arrangement was helpful to us. thehealthanalytics.com insightful analysis and reports contributed to our current analysis and in creating a future strategy. Besides, the te
Yosuke Mitsui
Senior Associate Construction Equipment Sales & Marketing
We asked them to research ‘Equipment market’ all over the world, and their whole arrangement was helpful to us. thehealthanalytics.com insightful analysis and reports contributed to our current analysis and in creating a future strategy. Besides, the te


