

Base Year Value ()
x.x %
x.x %
CAGR ()
x.x %
x.x %
Forecast Year Value ()
x.x %
x.x %
Historical Data Period
Largest Region
Forecast Period
Tire Material Market by Type (Elastomers, Reinforcing Fillers, Plasticizers, Chemicals, Metal Reinforcements and Textile Reinforcements), Application (Light-Weight Commercial Vehicles [LCVs], Passenger Cars [PCs] and Heavyweight Commercial Vehicles [HCVs]), by Region (North America, Europe, Asia Pacific, South America, Middle East and Africa), Global Trends and Forecast from 2022 to 2029
Instant access to hundreds of data points and trends
- Market estimates from 2014-2029
- Competitive analysis, industry segmentation, financial benchmarks
- Incorporates SWOT, Porter's Five Forces and risk management frameworks
- PDF report or online database with Word, Excel and PowerPoint export options
- 100% money back guarantee
Tire Material Market Overview
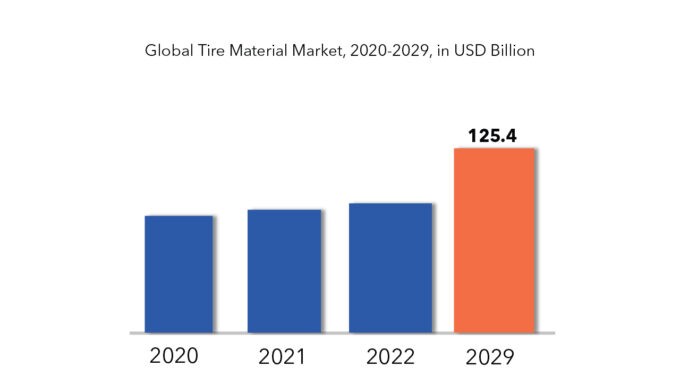
The global tire material market size is estimated to be valued at USD 79.46 billion in 2020 and is projected to reach USD 125.40 billion by 2029, recording a CAGR of 5.2%.
The tire, essential for accommodating a footprint tailored to the vehicle's weight, constitutes a pivotal element of automotive engineering. Predominantly comprised of synthetic rubber, natural rubber, textile, steel wires, carbon black, and other chemical compounds, tires, commonly pneumatically inflated, serve as resilient cushions mitigating shocks encountered while traversing uneven terrain. Notably, butadiene rubber and styrene-butadiene rubber stand as primary artificial rubber polymers integral to tire manufacturing processes.
In tandem with escalating environmental sustainability concerns, there exists a burgeoning demand for fuel-efficient tires aimed at curbing CO2 emissions. Not only do fuel-efficient tires offer environmental benefits by reducing both CO2 emissions and air pollution, but they also manifest potential to diminish CO2 emissions by up to 4%, as corroborated by the US Environmental Protection Agency.
[caption id="attachment_4096" align="aligncenter" width="870"]
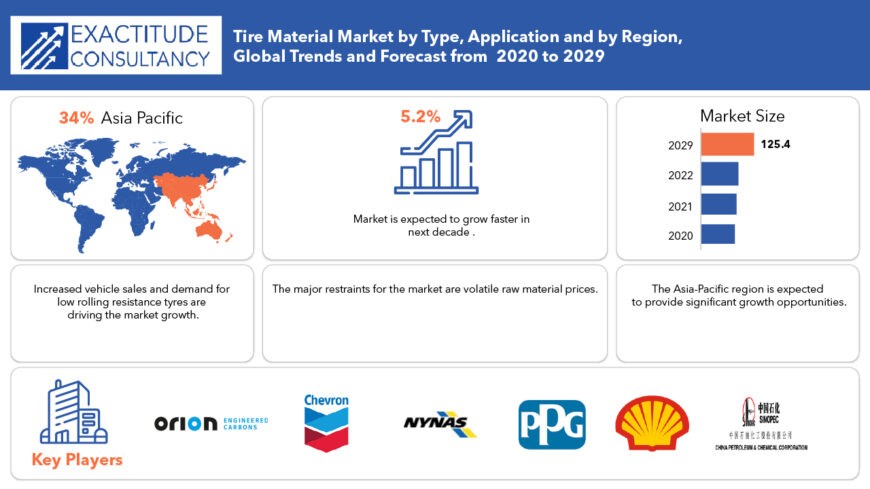
The propulsion of the Global Tire Material Market hinges significantly upon the surge in tire production and the escalating necessity for tire replacements in emerging economies. As the automotive sector increasingly emphasizes containment and traction in vehicle design, the spotlight has shifted towards materials such as carbon black, wire, and synthetic rubber. Rigorous material testing within the automotive industry has concurrently propelled demand for tire materials, fostering expansion within the tire material sector. Moreover, governments worldwide have made substantial investments in automotive engineering technology, further catalyzing market growth.
Given the pivotal role of the automobile industry in shaping a nation's GDP, governmental investments in this sector reverberate within the Tire Material Market. Nevertheless, persistent fluctuations in raw material prices and suboptimal supply and demand management pose constraints to industry expansion. Notwithstanding, the escalating demand for eco-friendly pneumatic materials and the collaborative efforts of pneumatic material manufacturers and other market stakeholders in technological advancements present vast market opportunities, concurrently elevating product quality and market offerings.
[caption id="attachment_4099" align="aligncenter" width="680"]
Tire Material Market Segment Analysis
In terms of volume, the elastomer category accounts for the biggest share of the tire materials business, compared to other materials. Natural and synthetic rubber are examples of elastomers. The rise in car sales worldwide as a result of population growth and the necessity for mobility raises the demand for tyres, which is expected to rise significantly throughout the forecast period.
The passenger car sector is expected to grow at the fastest rate in the tire materials market. The reduction in loan rates through banking services, as well as different government programs and incentives to develop company units, could boost car sales globally.
Tire Material Market Players
Market players focus on growth strategies, such as new product launches, collaborations, partnerships, operational expansion, mergers & acquisitions, and awareness campaigns. Companies operating the target market can focus on partnerships and collaborations, in order to develop advanced products which in turn create lucrative growth opportunities. Few of the important market players include Orion Engineered Carbons, Royal Dutch Shell, China Petroleum & Chemical Corporation, Chevron Corporation, Nynas AB, Petro China Company Limited, Exxon Mobil Corporation, SIBUR INTERNATIONAL, American Zinc Recycling LLC, PPG Industries and Ralson Goodluck Carbon.
Companies are mainly in the developing and they are competing closely with each other. Innovation is one of the most important and key strategy as it has to be for any market. However, companies in the market have also opted and successfully driven inorganic growth strategies like mergers & acquisition and so on.
- In December 2021, the Goodyear Tire & Rubber Company, an American multinational tire manufacturing company, announced entering into a collaboration agreement with a next generation chemical and energy company, Monolith for development of carbon black from methane for tires.
- In September 2017, Thai Carbon Black Public Company Limited commenced its operation to produce carbon black in a greenfield facility in Jining, China. The plant is being constructed in two phases. Currently, the company has installed a production capacity of 120,000 ton per year in phase 1 and is expected to increase the production capacity to 240,000 tons. This expansion will enable the company to serve its customers in China.
Who Should Buy? Or Key Stakeholders
- Tire material Companies
- Research Organizations
- Investors
- Regulatory Authorities
- Others
Tire Material Market Regional Analysis
The Tire material market by region includes North America, Asia-Pacific (APAC), Europe, South America, and Middle East & Africa (MEA).
- North America: includes US, Canada and Mexico
- Asia Pacific: includes China, Japan, South Korea, India, Australia, ASEAN and Rest of APAC
- Europe: includes UK, Germany, France, Italy, Spain, Russia, and Rest of Europe
- South America: includes Brazil, Argentina and Rest of South America
- Middle East & Africa: includes Turkey, UAE, Saudi Arabia, South Africa, and Rest of MEA
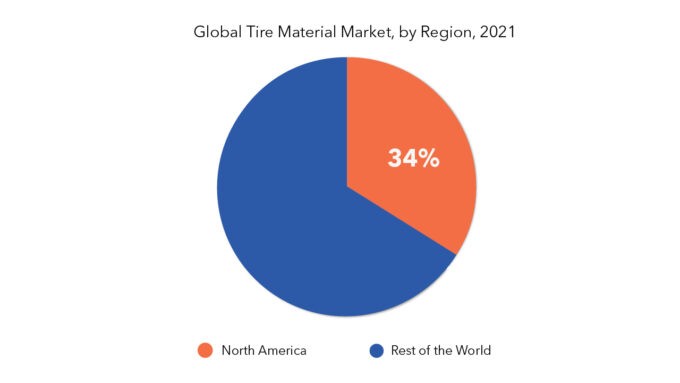
The major share is expected to be occupied by Asia Pacific for global tire material market during the forecast period. In terms of value and volume, the tire materials industry in Asia Pacific is expected to develop at the fastest CAGR over the forecast period. The key nations contributing to the expansion of the global tire materials business in this area are China and India. Major worldwide automakers have invested in Asia-Pacific because of the simple availability of raw resources, political and economic stability, well-developed infrastructure, and inexpensive, skilled labor. As a result, all of these factors are expected to boost the Asia-Pacific tire materials business.
Key Takeaways
- The global tire material market is recording a CAGR of 5.2%
- In terms of volume, the elastomer category accounts for the biggest share of the tire materials business.
- The passenger car sector is expected to grow at the fastest rate in the tire materials market.
- The major share is expected to be occupied by Asia Pacific for global tire material market.
- The tire material market is experiencing steady growth driven by increasing demand for fuel-efficient and high-performance tires, along with advancements in sustainable materials.
Key Market Segments: Tire Material Market
Tire Material Market by Type, 2020-2029, (USD Million) (Kilotons)- Elastomers
- Reinforcing Fillers
- Plasticizers
- Chemicals
- Metal Reinforcements
- Textile Reinforcements
- Light-Weight Commercial Vehicles [LCVs]
- Passenger Cars [Pcs]
- Heavyweight Commercial Vehicles [HCVs]
- North America
- Europe
- Asia Pacific
- South America
- Middle East And Africa
Key Question Answered
- What is the current market size of this high growth market?
- What is the overall growth rate?
- What are the key growth areas, applications, end uses and types?
- Key reasons for growth
- Challenges for growth
- Who are the important market players in this market?
- What are the key strategies of these players?
- What technological developments are happening in this area?
- Introduction
- Market Definition
- Market Segmentation
- Research Timelines
- Assumptions And Limitations
- Research Methodology
- Data Mining
- Secondary Research
- Primary Research
- Subject-Matter Experts’ Advice
- Quality Checks
- Final Review
- Data Triangulation
- Bottom-Up Approach
- Top-Down Approach
- Research Flow
- Data Sources
- Data Mining
- Executive Summary
- Market Overview
- Global Tire Material Market Outlook
- Market Drivers
- Market Restraints
- Market Opportunities
- Impact Of Covid-19 On Global Tire Material Market
- Global Tire Material Market Outlook
- Global Tire Material Market By Type, (USD Million) (Kilotons)
- Elastomers
- Reinforcing Fillers
- Plasticizers
- Chemicals
- Metal Reinforcements
- Textile Reinforcements
- Global Tire Material Market By Application, (USD Million) (Kilotons)
- Light-Weight Commercial Vehicles [Lcvs]
- Passenger Cars [Pcs]
- Heavyweight Commercial Vehicles [Hcvs]
- Global Tire Material Market By Region, (USD Million) (Kilotons)
- Introduction
- Asia-Pacific
- China
- India
- Japan
- South Korea
- Australia
- South-East Asia
- Rest Of Asia-Pacific
- North America
- United States
- Canada
- Mexico
- Europe
- Germany
- United Kingdom
- France
- Italy
- Spain
- Russia
- Rest Of Europe
- South America
- Brazil
- Argentina
- Colombia
- Rest Of South America
- Middle East and Africa
- UAE
- Saudi Arabia
- South Africa
- Rest Of Middle East and Africa
- Company Profiles* (Business Overview, Company Snapshot, Types Offered, Recent Developments)
- Orion Engineered Carbons
- Royal Dutch Shell
- China Petroleum & Chemical Corporation
- Chevron Corporation
- Nynas AB
- Petro China Company Limited
- Exxon Mobil Corporation
- SIBUR INTERNATIONAL
- American Zinc Recycling LLC
- PPG Industries
*The Company List Is Indicative
LIST OF TABLES
TABLE 1 GLOBAL TIRE MATERIAL MARKET BY TYPE (USD MILLIONS), 2020-2029
TABLE 2 GLOBAL TIRE MATERIAL MARKET BY TYPE (KILOTONS), 2020-2029
TABLE 3 GLOBAL TIRE MATERIAL MARKET BY APPLICATION (USD MILLIONS), 2020-2029
TABLE 4 GLOBAL TIRE MATERIAL MARKET BY APPLICATION (KILOTONS), 2020-2029
TABLE 5 GLOBAL TIRE MATERIAL MARKET BY REGION (USD MILLIONS), 2020-2029
TABLE 6 GLOBAL TIRE MATERIAL MARKET BY REGION (KILOTONS), 2020-2029
TABLE 7 NORTH AMERICA TIRE MATERIAL MARKET BY COUNTRY (USD MILLIONS), 2020-2029
TABLE 8 NORTH AMERICA TIRE MATERIAL MARKET BY COUNTRY (KILOTONS), 2020-2029
TABLE 9 US TIRE MATERIAL MARKET BY TYPE (USD MILLIONS), 2020-2029
TABLE 10 US TIRE MATERIAL MARKET BY TYPE (KILOTONS), 2020-2029
TABLE 11 US TIRE MATERIAL MARKET BY APPLICATION (USD MILLIONS), 2020-2029
TABLE 12 US TIRE MATERIAL MARKET BY APPLICATION (KILOTONS), 2020-2029
TABLE 13 CANADA TIRE MATERIAL MARKET BY TYPE (USD MILLIONS), 2020-2029
TABLE 14 CANADA TIRE MATERIAL MARKET BY TYPE (KILOTONS), 2020-2029
TABLE 15 CANADA TIRE MATERIAL MARKET BY APPLICATION (USD MILLIONS), 2020-2029
TABLE 16 CANADA TIRE MATERIAL MARKET BY APPLICATION (KILOTONS), 2020-2029
TABLE 17 MEXICO TIRE MATERIAL MARKET BY TYPE (USD MILLIONS), 2020-2029
TABLE 18 MEXICO TIRE MATERIAL MARKET BY TYPE (KILOTONS), 2020-2029
TABLE 19 MEXICO TIRE MATERIAL MARKET BY APPLICATION (USD MILLIONS), 2020-2029
TABLE 20 MEXICO TIRE MATERIAL MARKET BY APPLICATION (KILOTONS), 2020-2029
TABLE 21 SOUTH AMERICA TIRE MATERIAL MARKET BY COUNTRY (USD MILLIONS), 2020-2029
TABLE 22 SOUTH AMERICA TIRE MATERIAL MARKET BY COUNTRY (KILOTONS), 2020-2029
TABLE 23 BRAZIL TIRE MATERIAL MARKET BY TYPE (USD MILLIONS), 2020-2029
TABLE 24 BRAZIL TIRE MATERIAL MARKET BY TYPE (KILOTONS), 2020-2029
TABLE 25 BRAZIL TIRE MATERIAL MARKET BY APPLICATION (USD MILLIONS), 2020-2029
TABLE 26 BRAZIL TIRE MATERIAL MARKET BY APPLICATION (KILOTONS), 2020-2029
TABLE 27 ARGENTINA TIRE MATERIAL MARKET BY TYPE (USD MILLIONS), 2020-2029
TABLE 28 ARGENTINA TIRE MATERIAL MARKET BY TYPE (KILOTONS), 2020-2029
TABLE 29 ARGENTINA TIRE MATERIAL MARKET BY APPLICATION (USD MILLIONS), 2020-2029
TABLE 30 ARGENTINA TIRE MATERIAL MARKET BY APPLICATION (KILOTONS), 2020-2029
TABLE 31 COLOMBIA TIRE MATERIAL MARKET BY TYPE (USD MILLIONS), 2020-2029
TABLE 32 COLOMBIA TIRE MATERIAL MARKET BY TYPE (KILOTONS), 2020-2029
TABLE 33 COLOMBIA TIRE MATERIAL MARKET BY APPLICATION (USD MILLIONS), 2020-2029
TABLE 34 COLOMBIA TIRE MATERIAL MARKET BY APPLICATION (KILOTONS), 2020-2029
TABLE 35 REST OF SOUTH AMERICA TIRE MATERIAL MARKET BY TYPE (USD MILLIONS), 2020-2029
TABLE 36 REST OF SOUTH AMERICA TIRE MATERIAL MARKET BY TYPE (KILOTONS), 2020-2029
TABLE 37 REST OF SOUTH AMERICA TIRE MATERIAL MARKET BY APPLICATION (USD MILLIONS), 2020-2029
TABLE 38 REST OF SOUTH AMERICA TIRE MATERIAL MARKET BY APPLICATION (KILOTONS), 2020-2029
TABLE 39 ASIA-PACIFIC TIRE MATERIAL MARKET BY COUNTRY (USD MILLIONS), 2020-2029
TABLE 40 ASIA-PACIFIC TIRE MATERIAL MARKET BY COUNTRY (KILOTONS), 2020-2029
TABLE 41 INDIA TIRE MATERIAL MARKET BY TYPE (USD MILLIONS), 2020-2029
TABLE 42 INDIA TIRE MATERIAL MARKET BY TYPE (KILOTONS), 2020-2029
TABLE 43 INDIA TIRE MATERIAL MARKET BY APPLICATION (USD MILLIONS), 2020-2029
TABLE 44 INDIA TIRE MATERIAL MARKET BY APPLICATION (KILOTONS), 2020-2029
TABLE 45 CHINA TIRE MATERIAL MARKET BY TYPE (USD MILLIONS), 2020-2029
TABLE 46 CHINA TIRE MATERIAL MARKET BY TYPE (KILOTONS), 2020-2029
TABLE 47 CHINA TIRE MATERIAL MARKET BY APPLICATION (USD MILLIONS), 2020-2029
TABLE 48 CHINA TIRE MATERIAL MARKET BY APPLICATION (KILOTONS), 2020-2029
TABLE 49 JAPAN TIRE MATERIAL MARKET BY TYPE (USD MILLIONS), 2020-2029
TABLE 50 JAPAN TIRE MATERIAL MARKET BY TYPE (KILOTONS), 2020-2029
TABLE 51 JAPAN TIRE MATERIAL MARKET BY APPLICATION (USD MILLIONS), 2020-2029
TABLE 52 JAPAN TIRE MATERIAL MARKET BY APPLICATION (KILOTONS), 2020-2029
TABLE 53 SOUTH KOREA TIRE MATERIAL MARKET BY TYPE (USD MILLIONS), 2020-2029
TABLE 54 SOUTH KOREA TIRE MATERIAL MARKET BY TYPE (KILOTONS), 2020-2029
TABLE 55 SOUTH KOREA TIRE MATERIAL MARKET BY APPLICATION (USD MILLIONS), 2020-2029
TABLE 56 SOUTH KOREA TIRE MATERIAL MARKET BY APPLICATION (KILOTONS), 2020-2029
TABLE 57 AUSTRALIA TIRE MATERIAL MARKET BY TYPE (USD MILLIONS), 2020-2029
TABLE 58 AUSTRALIA TIRE MATERIAL MARKET BY TYPE (KILOTONS), 2020-2029
TABLE 59 AUSTRALIA TIRE MATERIAL MARKET BY APPLICATION (USD MILLIONS), 2020-2029
TABLE 60 AUSTRALIA TIRE MATERIAL MARKET BY APPLICATION (KILOTONS), 2020-2029
TABLE 61 SOUTH-EAST ASIA TIRE MATERIAL MARKET BY TYPE (USD MILLIONS), 2020-2029
TABLE 62 SOUTH-EAST ASIA TIRE MATERIAL MARKET BY TYPE (KILOTONS), 2020-2029
TABLE 63 SOUTH-EAST ASIA TIRE MATERIAL MARKET BY APPLICATION (USD MILLIONS), 2020-2029
TABLE 64 SOUTH-EAST ASIA TIRE MATERIAL MARKET BY APPLICATION (KILOTONS), 2020-2029
TABLE 65 REST OF ASIA PACIFIC TIRE MATERIAL MARKET BY TYPE (USD MILLIONS), 2020-2029
TABLE 66 REST OF ASIA PACIFIC TIRE MATERIAL MARKET BY TYPE (KILOTONS), 2020-2029
TABLE 67 REST OF ASIA PACIFIC TIRE MATERIAL MARKET BY APPLICATION (USD MILLIONS), 2020-2029
TABLE 68 REST OF ASIA PACIFIC TIRE MATERIAL MARKET BY APPLICATION (KILOTONS), 2020-2029
TABLE 69 EUROPE TIRE MATERIAL MARKET BY COUNTRY (USD MILLIONS), 2020-2029
TABLE 70 EUROPE TIRE MATERIAL MARKET BY COUNTRY (KILOTONS), 2020-2029
TABLE 71 GERMANY TIRE MATERIAL MARKET BY TYPE (USD MILLIONS), 2020-2029
TABLE 72 GERMANY TIRE MATERIAL MARKET BY TYPE (KILOTONS), 2020-2029
TABLE 73 GERMANY TIRE MATERIAL MARKET BY APPLICATION (USD MILLIONS), 2020-2029
TABLE 74 GERMANY TIRE MATERIAL MARKET BY APPLICATION (KILOTONS), 2020-2029
TABLE 75 UK TIRE MATERIAL MARKET BY TYPE (USD MILLIONS), 2020-2029
TABLE 76 UK TIRE MATERIAL MARKET BY TYPE (KILOTONS), 2020-2029
TABLE 77 UK TIRE MATERIAL MARKET BY APPLICATION (USD MILLIONS), 2020-2029
TABLE 78 UK TIRE MATERIAL MARKET BY APPLICATION (KILOTONS), 2020-2029
TABLE 79 FRANCE TIRE MATERIAL MARKET BY TYPE (USD MILLIONS), 2020-2029
TABLE 80 FRANCE TIRE MATERIAL MARKET BY TYPE (KILOTONS), 2020-2029
TABLE 81 FRANCE TIRE MATERIAL MARKET BY APPLICATION (USD MILLIONS), 2020-2029
TABLE 82 FRANCE TIRE MATERIAL MARKET BY APPLICATION (KILOTONS), 2020-2029
TABLE 83 ITALY TIRE MATERIAL MARKET BY TYPE (USD MILLIONS), 2020-2029
TABLE 84 ITALY TIRE MATERIAL MARKET BY TYPE (KILOTONS), 2020-2029
TABLE 85 ITALY TIRE MATERIAL MARKET BY APPLICATION (USD MILLIONS), 2020-2029
TABLE 86 ITALY TIRE MATERIAL MARKET BY APPLICATION (KILOTONS), 2020-2029
TABLE 87 SPAIN TIRE MATERIAL MARKET BY TYPE (USD MILLIONS), 2020-2029
TABLE 88 SPAIN TIRE MATERIAL MARKET BY TYPE (KILOTONS), 2020-2029
TABLE 89 SPAIN TIRE MATERIAL MARKET BY APPLICATION (USD MILLIONS), 2020-2029
TABLE 90 SPAIN TIRE MATERIAL MARKET BY APPLICATION (KILOTONS), 2020-2029
TABLE 91 RUSSIA TIRE MATERIAL MARKET BY TYPE (USD MILLIONS), 2020-2029
TABLE 92 RUSSIA TIRE MATERIAL MARKET BY TYPE (KILOTONS), 2020-2029
TABLE 93 RUSSIA TIRE MATERIAL MARKET BY APPLICATION (USD MILLIONS), 2020-2029
TABLE 94 RUSSIA TIRE MATERIAL MARKET BY APPLICATION (KILOTONS), 2020-2029
TABLE 95 REST OF EUROPE TIRE MATERIAL MARKET BY TYPE (USD MILLIONS), 2020-2029
TABLE 96 REST OF EUROPE TIRE MATERIAL MARKET BY TYPE (KILOTONS), 2020-2029
TABLE 97 REST OF EUROPE TIRE MATERIAL MARKET BY APPLICATION (USD MILLIONS), 2020-2029
TABLE 98 REST OF EUROPE TIRE MATERIAL MARKET BY APPLICATION (KILOTONS), 2020-2029
TABLE 99 MIDDLE EAST AND AFRICA TIRE MATERIAL MARKET BY COUNTRY (USD MILLIONS), 2020-2029
TABLE 100 MIDDLE EAST AND AFRICA TIRE MATERIAL MARKET BY COUNTRY (KILOTONS), 2020-2029
TABLE 101 UAE TIRE MATERIAL MARKET BY TYPE (USD MILLIONS), 2020-2029
TABLE 102 UAE TIRE MATERIAL MARKET BY TYPE (KILOTONS), 2020-2029
TABLE 103 UAE TIRE MATERIAL MARKET BY APPLICATION (USD MILLIONS), 2020-2029
TABLE 104 UAE TIRE MATERIAL MARKET BY APPLICATION (KILOTONS), 2020-2029
TABLE 105 SAUDI ARABIA TIRE MATERIAL MARKET BY TYPE (USD MILLIONS), 2020-2029
TABLE 106 SAUDI ARABIA TIRE MATERIAL MARKET BY TYPE (KILOTONS), 2020-2029
TABLE 107 SAUDI ARABIA TIRE MATERIAL MARKET BY APPLICATION (USD MILLIONS), 2020-2029
TABLE 108 SAUDI ARABIA TIRE MATERIAL MARKET BY APPLICATION (KILOTONS), 2020-2029
TABLE 109 SOUTH AFRICA TIRE MATERIAL MARKET BY TYPE (USD MILLIONS), 2020-2029
TABLE 110 SOUTH AFRICA TIRE MATERIAL MARKET BY TYPE (KILOTONS), 2020-2029
TABLE 111 SOUTH AFRICA TIRE MATERIAL MARKET BY APPLICATION (USD MILLIONS), 2020-2029
TABLE 112 SOUTH AFRICA TIRE MATERIAL MARKET BY APPLICATION (KILOTONS), 2020-2029
TABLE 113 REST OF MIDDLE EAST AND AFRICA TIRE MATERIAL MARKET BY TYPE (USD MILLIONS), 2020-2029
TABLE 114 REST OF MIDDLE EAST AND AFRICA TIRE MATERIAL MARKET BY TYPE (KILOTONS), 2020-2029
TABLE 115 REST OF MIDDLE EAST AND AFRICA TIRE MATERIAL MARKET BY APPLICATION (USD MILLIONS), 2020-2029
TABLE 116 REST OF MIDDLE EAST AND AFRICA TIRE MATERIAL MARKET BY APPLICATION (KILOTONS), 2020-2029
LIST OF FIGURES
FIGURE 1 MARKET DYNAMICS
FIGURE 2 MARKET SEGMENTATION
FIGURE 3 REPORT TIMELINES: YEARS CONSIDERED
FIGURE 4 DATA TRIANGULATION
FIGURE 5 BOTTOM-UP APPROACH
FIGURE 6 TOP-DOWN APPROACH
FIGURE 7 RESEARCH FLOW
FIGURE 8 GLOBAL TIRE MATERIAL MARKET BY TYPE, USD MILLION, 2020-2029
FIGURE 9 GLOBAL TIRE MATERIAL MARKET BY APPLICATION, USD MILLION, 2020-2029
FIGURE 10 GLOBAL TIRE MATERIAL MARKET BY REGION, USD MILLION, 2020-2029
FIGURE 11 PORTER’S FIVE FORCES MODEL
FIGURE 12 GLOBAL TIRE MATERIAL MARKET BY TYPE, USD MILLION, 2020-2029
FIGURE 13 GLOBAL TIRE MATERIAL MARKET BY APPLICATION, USD MILLION, 2020-2029
FIGURE 14 GLOBAL TIRE MATERIAL MARKET BY REGION, USD MILLION, 2020-2029
FIGURE 15 TIRE MATERIAL MARKET BY REGION 2020
FIGURE 16 MARKET SHARE ANALYSIS
FIGURE 17 ORION ENGINEERED CARBONS: COMPANY SNAPSHOT
FIGURE 18 ROYAL DUTCH SHELL: COMPANY SNAPSHOT
FIGURE 19 CHINA PETROLEUM & CHEMICAL CORPORATION: COMPANY SNAPSHOT
FIGURE 20 CHEVRON CORPORATION: COMPANY SNAPSHOT
FIGURE 21 NYNAS AB: COMPANY SNAPSHOT
FIGURE 22 PETRO CHINA COMPANY LIMITED: COMPANY SNAPSHOT
FIGURE 23 EXXON MOBIL CORPORATION: COMPANY SNAPSHOT
FIGURE 24 SIBUR INTERNATIONAL: COMPANY SNAPSHOT
FIGURE 25 AMERICAN ZINC RECYCLING LLC: COMPANY SNAPSHOT
FIGURE 26 PPG INDUSTRIES: COMPANY SNAPSHOT
DOWNLOAD FREE SAMPLE REPORT
License Type
SPEAK WITH OUR ANALYST
Want to know more about the report or any specific requirement?
WANT TO CUSTOMIZE THE REPORT?
Our Clients Speak
We asked them to research ‘ Equipment market’ all over the world, and their whole arrangement was helpful to us. thehealthanalytics.com insightful analysis and reports contributed to our current analysis and in creating a future strategy. Besides, the te
Yosuke Mitsui
Senior Associate Construction Equipment Sales & Marketing
We asked them to research ‘Equipment market’ all over the world, and their whole arrangement was helpful to us. thehealthanalytics.com insightful analysis and reports contributed to our current analysis and in creating a future strategy. Besides, the te


