

Base Year Value ()
x.x %
x.x %
CAGR ()
x.x %
x.x %
Forecast Year Value ()
x.x %
x.x %
Historical Data Period
Largest Region
Forecast Period
Refinery Catalysts Market by Material (Zeolites, Metallic, Chemical Compound) Application (FCC Catalysts, Alkylation Catalysts, Hydrotreating Catalysts, Hydrocracking Catalysts, Catalytic Reforming) And by Region (North America, Europe, Asia Pacific, South America, Middle East and Africa) Global Trends and Forecast from 2022 To 2029
Instant access to hundreds of data points and trends
- Market estimates from 2014-2029
- Competitive analysis, industry segmentation, financial benchmarks
- Incorporates SWOT, Porter's Five Forces and risk management frameworks
- PDF report or online database with Word, Excel and PowerPoint export options
- 100% money back guarantee
Refinery Catalysts Market Overview
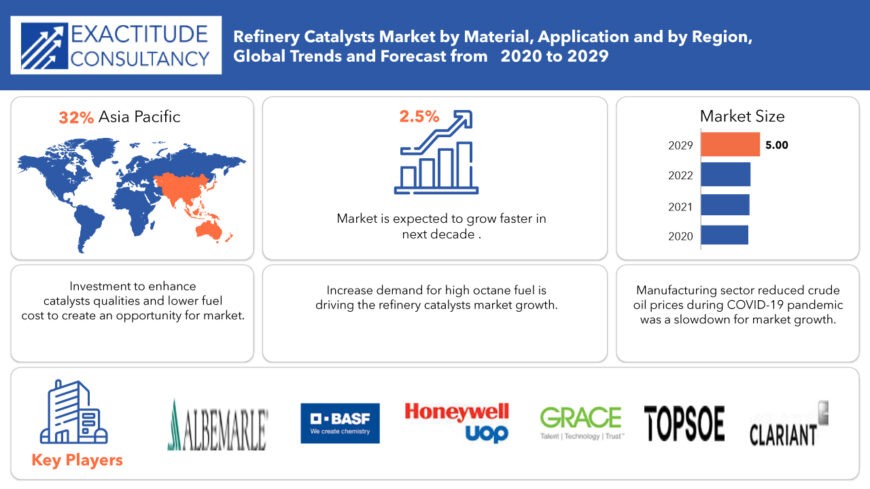
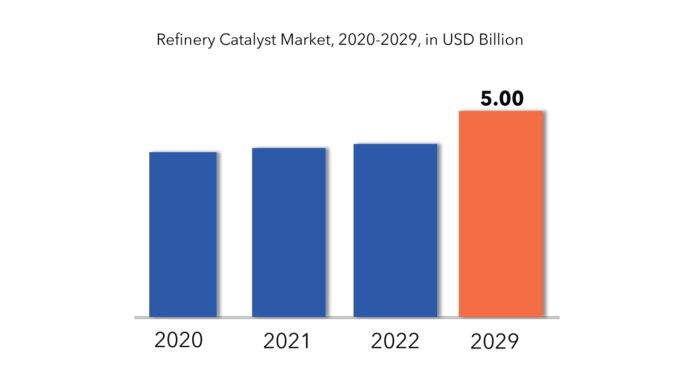
The global refinery catalyst market is projected to reach USD 5.00 Billion by 2029 from USD 4.00 Billion in 2020, at a CAGR of 2.5% from 2022 to 2029.
Refinery catalysts constitute crucial chemical agents utilized in the refining process to eliminate undesirable impurities like nitrogen, metal contaminants, and sulfur. These catalysts, including zeolites, calcium carbonate, molybdenum, palladium, and zirconium, either individually or in varying combinations, are instrumental in enhancing the operational efficiency of petroleum refining. The escalating demand for petroleum products such as gasoline, high-octane fuel, kerosene, diesel, polymers, among others, is propelling the need for refining catalysts. This surge in demand, particularly driven by the increasing requirement for transportation fuel, is anticipated to fuel market growth.
Amidst rising investments in research and development, technological advancements, and capacity expansions within the refinery sector, new avenues for refinery catalysts are emerging. Market leaders are keen on integrating novel technologies, proprietary designs, and equipment upgrades to enhance the efficacy of these catalysts while optimizing profit margins. Companies are also striving to enhance the catalytic properties of their products, ensuring stability and reliability in the production of high-quality fuel at reduced costs.
[caption id="attachment_4821" align="aligncenter" width="870"]
 Refining Catalyst Market | Exactitude Consultancy[/caption]
The anticipated growth of the market can be attributed to the global surge in demand for transportation fuel. Stringent regulations, coupled with the escalating need for petroleum and its derivatives, are projected to steer market expansion. Refinery catalysts play a pivotal role in enhancing the operational efficiency of petroleum refining processes. Furthermore, the transition towards renewable energy sources has prompted oil refineries to optimize operations and enhance efficiency, consequently driving the demand for advanced refinery catalysts. The market is also expected to benefit from the growing adoption of new and advanced technologies in the refining industry, necessitating specialized catalysts to ensure optimal performance.
[caption id="attachment_4825" align="alignnone" width="680"]
Refinery Catalysts Market Segment Analysis
The refinery catalyst market is divided into two categories based on material: zeolites, metallic, chemical compound. Zeolites segment dominate the refining catalyst market. Zeolites are hydrated aluminosilicate minerals that are part of the micro porous solids family. Because of their porosity and large surface area, they are widely used as adsorbents and catalysts. Potassium (K+), sodium (Na+), calcium (Ca2+), and magnesium (Mg2+) are all accommodated by the porous structure of zeolites. Zeolites are formed naturally when volcanic rocks and ash layers react with alkaline water. Because of the presence of other minerals, metals, and quartz in natural zeolites, they are impure. Zeolites, on the other hand, are commercially produced from the slow crystallization of silica-alumina gel with a variety of other atoms added to improve activity and performance in a specific process. The rising demand for noble and other metals in emerging economies such as Chile, China, and South Africa, as a result of favorable regulatory support for FDI in mineral production, is expected to ensure the supply of raw materials for metal catalyst manufacturers. However, rising demand for these metals in other applications is expected to constrain raw material availability, limiting refinery catalyst market growth over the forecast period.
The market is divided into FCC catalysts, alkylation catalysts, hydrotreating catalysts, hydrocracking catalysts, catalytic reforming based on application. FCC catalytic dominates the segment of refining catalysts. The growing demand for gasoline as a fuel for use in automobiles around the world is responsible for this segment’s growth. The most common method used by refineries to convert heavy and high boiling hydrocarbons to lower valuable fractions is fluid catalytic cracking. The primary product of the process is gasoline, along with other fractions such as diesel and C3 and C4 gaseous fractions. This process aids in the production of additional gasoline in order to meet the rising demand for automobiles. The lighter fractions are fed to the alkylation unit, which produces a high-octane gasoline component known as alkylate, while the heavier fractions are used as a diesel blender and additive.
Refinery Catalysts Market Players
The major players operating in the global refinery catalyst industry include Albemarle Corporation, W R Grace, BASF, Haldor Topsoe, Honeywell UOP, Clariant, Axens, China Petroleum and Chemical Corporation, Shell Catalyst & Technologies, Arkema, Anten Chemicals, Chempack, Dorf-Ketal Chemicals Pvt. Ltd. Albemarle Corporation is among the leading refinery catalysts manufacturers globally. The company is one of the three largest refinery catalysts producers. New product launch and joint venture were the key strategies adopted by the company to penetrate the global refinery catalysts market.
Who Should Buy? Or Key stakeholders
- Chemical Companies
- Refinery catalysts manufacturers
- Refinery companies
- Others
Key Takeaways
- The global refinery catalyst market is projected to grow at a CAGR of 2.5%.
- Based on material, Zeolites segment dominate the refining catalyst market.
- Based on application, FCC catalytic dominates the segment of refining catalysts.
- Asia Pacific is expected to hold the largest share of the global refinery catalyst market.
- Increasing focus on environmental sustainability drives demand for eco-friendly and efficient refinery catalysts.
Refinery Catalysts Market Regional Analysis
Geographically, the refinery catalyst market is segmented into North America, South America, Europe, APAC and MEA.
- North America: includes the US, Canada, Mexico
- Europe: includes UK, Germany, France, Italy, Spain, Russia, and Rest of Europe
- Asia Pacific: includes China, Japan, South Korea, India, Australia, ASEAN and Rest of APAC
- South America: includes Brazil, Argentina and Rest of South America
- Middle East & Africa: includes Turkey, UAE, Saudi Arabia, South Africa, and Rest of MEA
Asia Pacific is expected to hold the largest share of the global refinery catalyst market. China and India were the second and fifth largest countries in the refinery catalyst market, respectively. In the aforementioned countries, particularly in India, an increasing number of private sector companies have played a critical role in promoting the refining industry. The Reliance-operated Jamnagar refinery complex in Gujarat had a capacity of 1.2 million barrels per day, making it the world's largest refinery. The Indian government has approved the Petroleum, Chemicals, and Petrochemicals Investment Region (PCPIR) policy to encourage foreign direct investment in the oil and gas industry. This regulatory change is expected to hasten India's production of petrochemicals and polymers, boosting demand for refinery catalysts over the forecast period.
[caption id="attachment_4827" align="alignleft" width="680"]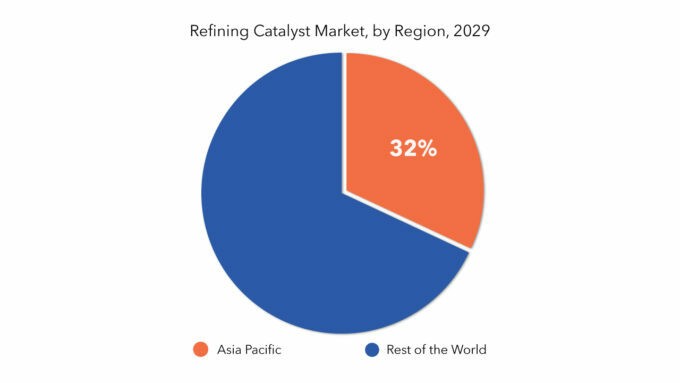
Key Market Segments: Refinery Catalysts Market
Refinery Catalysts Market by Material, 2022-2029, (USD Million) (Kilotons)- Zeolites
- Metallic
- Chemical Compound
- FCC Catalysts
- Alkylation Catalysts
- Hydrotreating Catalysts
- Hydrocracking Catalysts
- Catalytic Reforming
- North America
- Europe
- Asia Pacific
- South America
- Middle East And Africa
Key Question Answered
- What is the current scenario of the global refinery catalyst market?
- What are the emerging technologies for the development of refinery catalyst devices?
- What are the historical size and the present size of the market segments and their future potential?
- What are the major catalysts for the market and their impact during the short, medium, and long terms?
- What are the evolving opportunities for the players in the market?
- Which are the key regions from the investment perspective?
- What are the key strategies being adopted by the major players to up their market shares?
- INTRODUCTION
- MARKET DEFINITION
- MARKET SEGMENTATION
- RESEARCH TIMELINES
- ASSUMPTIONS AND LIMITATIONS
- RESEARCH METHODOLOGY
- DATA MINING
- SECONDARY RESEARCH
- PRIMARY RESEARCH
- SUBJECT-MATTER EXPERTS’ ADVICE
- QUALITY CHECKS
- FINAL REVIEW
- DATA TRIANGULATION
- BOTTOM-UP APPROACH
- TOP-DOWN APPROACH
- RESEARCH FLOW
- DATA SOURCES
- DATA MINING
- EXECUTIVE SUMMARY
- MARKET OVERVIEW
- GLOBAL REFINERY CATALYSTS MARKET OUTLOOK
- MARKET DRIVERS
- MARKET RESTRAINTS
- MARKET OPPORTUNITIES
- IMPACT OF COVID-19 ON GLOBAL REFINERY CATALYSTS MARKET
- GLOBAL REFINERY CATALYSTS MARKET OUTLOOK
- GLOBAL REFINERY CATALYSTS MARKET BY MATERIAL, (USD MILLION) (KILOTONS)
- ZEOLITES
- METALLIC
- CHEMICAL COMPOUND
- GLOBAL REFINERY CATALYSTS MARKET BY APPLICATION, (USD MILLION) (KILOTONS)
- FCC CATALYSTS
- ALKYLATION CATALYSTS
- HYDROTREATING CATALYSTS
- HYDROCRACKING CATALYSTS
- CATALYTIC REFORMING
- GLOBAL REFINERY CATALYSTS MARKET BY REGION, (USD MILLION) (KILOTONS)
- INTRODUCTION
- ASIA-PACIFIC
- CHINA
- INDIA
- JAPAN
- SOUTH KOREA
- AUSTRALIA
- SOUTH-EAST ASIA
- REST OF ASIA-PACIFIC
- NORTH AMERICA
- UNITED STATES
- CANADA
- MEXICO
- EUROPE
- GERMANY
- UNITED KINGDOM
- FRANCE
- ITALY
- SPAIN
- RUSSIA
- REST OF EUROPE
- SOUTH AMERICA
- BRAZIL
- ARGENTINA
- COLOMBIA
- REST OF SOUTH AMERICA
- MIDDLE EAST AND AFRICA
- UAE
- SAUDI ARABIA
- SOUTH AFRICA
- REST OF MIDDLE EAST AND AFRICA
- COMPANY PROFILES*(BUSINESS OVERVIEW, COMPANY SNAPSHOT, PRODUCTS OFFERED, RECENT DEVELOPMENTS)
- NAVANTIA
- BAE SYSTEMS
- SAAB AB
- NAVAL GROUP
- GOA SHIPYARD LTD.
- HYUNDAI HEAVY INDUSTRIES CO. LTD.
- MITSUBISHI HEAVY INDUSTRIES LTD.
- DAMEN SHIPYARDS GROUP
- AUSTAL
- FINCANTIERI S.P.A
- COTECMAR
- CMN GROUP
- L&T *THE COMPANY LIST IS INDICATIVE
LIST OF TABLES
TABLE 1 GLOBAL REFINERY CATALYSTS MARKET BY MATERIAL (USD MILLIONS) 2020-2029
TABLE 2 GLOBAL REFINERY CATALYSTS MARKET BY MATERIAL (KILOTONS) 2020-2029
TABLE 3 CANADA REFINERY CATALYSTS MARKET BY APPLICATION (USD MILLIONS) 2020-2029
TABLE 4 GLOBAL REFINERY CATALYSTS MARKET BY APPLICATION (UNITS) 2020-2029
TABLE 5 GLOBAL REFINERY CATALYSTS MARKET BY REGION (USD MILLIONS) 2020-2029
TABLE 6 GLOBAL REFINERY CATALYSTS MARKET BY REGION (UNITS) 2020-2029
TABLE 7 US REFINERY CATALYSTS MARKET BY MATERIAL (USD MILLIONS) 2020-2029
TABLE 8 US REFINERY CATALYSTS MARKET BY MATERIAL (KILOTONS) 2020-2029
TABLE 9 US REFINERY CATALYSTS MARKET BY APPLICATION (USD MILLIONS) 2020-2029
TABLE 10 US REFINERY CATALYSTS MARKET BY APPLICATION (UNITS) 2020-2029
TABLE 11 CANADA REFINERY CATALYSTS MARKET BY MATERIAL (USD MILLIONS) 2020-2029
TABLE 12 CANADA REFINERY CATALYSTS MARKET BY MATERIAL (KILOTONS) 2020-2029
TABLE 13 CANADA REFINERY CATALYSTS MARKET BY APPLICATION (USD MILLIONS) 2020-2029
TABLE 14 CANADA REFINERY CATALYSTS MARKET BY APPLICATION (UNITS) 2020-2029
TABLE 15 MEXICO REFINERY CATALYSTS MARKET BY MATERIAL (USD MILLIONS) 2020-2029
TABLE 16 MEXICO REFINERY CATALYSTS MARKET BY MATERIAL (KILOTONS) 2020-2029
TABLE 17 MEXICO REFINERY CATALYSTS MARKET BY APPLICATION (USD MILLIONS) 2020-2029
TABLE 18 MEXICO REFINERY CATALYSTS MARKET BY APPLICATION (UNITS) 2020-2029
TABLE 19 BRAZIL REFINERY CATALYSTS MARKET BY MATERIAL (USD MILLIONS) 2020-2029
TABLE 20 BRAZIL REFINERY CATALYSTS MARKET BY MATERIAL (KILOTONS) 2020-2029
TABLE 21 BRAZIL REFINERY CATALYSTS MARKET BY APPLICATION (USD MILLIONS) 2020-2029
TABLE 22 BRAZIL REFINERY CATALYSTS MARKET BY APPLICATION (UNITS) 2020-2029
TABLE 23 ARGENTINA REFINERY CATALYSTS MARKET BY MATERIAL (USD MILLIONS) 2020-2029
TABLE 24 ARGENTINA REFINERY CATALYSTS MARKET BY MATERIAL (KILOTONS) 2020-2029
TABLE 25 ARGENTINA REFINERY CATALYSTS MARKET BY APPLICATION (USD MILLIONS) 2020-2029
TABLE 26 ARGENTINA REFINERY CATALYSTS MARKET BY APPLICATION (UNITS) 2020-2029
TABLE 27 COLOMBIA REFINERY CATALYSTS MARKET BY MATERIAL (USD MILLIONS) 2020-2029
TABLE 28 COLOMBIA REFINERY CATALYSTS MARKET BY MATERIAL (KILOTONS) 2020-2029
TABLE 29 COLOMBIA REFINERY CATALYSTS MARKET BY APPLICATION (USD MILLIONS) 2020-2029
TABLE 30 COLOMBIA REFINERY CATALYSTS MARKET BY APPLICATION (UNITS) 2020-2029
TABLE 31 REST OF SOUTH AMERICA REFINERY CATALYSTS MARKET BY MATERIAL (USD MILLIONS) 2020-2029
TABLE 32 REST OF SOUTH AMERICA REFINERY CATALYSTS MARKET BY MATERIAL (KILOTONS) 2020-2029
TABLE 33 REST OF SOUTH AMERICA REFINERY CATALYSTS MARKET BY APPLICATION (USD MILLIONS) 2020-2029
TABLE 34 REST OF SOUTH AMERICA REFINERY CATALYSTS MARKET BY APPLICATION (UNITS) 2020-2029
TABLE 35 INDIA REFINERY CATALYSTS MARKET BY MATERIAL (USD MILLIONS) 2020-2029
TABLE 36 INDIA REFINERY CATALYSTS MARKET BY MATERIAL (KILOTONS) 2020-2029
TABLE 37 INDIA REFINERY CATALYSTS MARKET BY APPLICATION (USD MILLIONS) 2020-2029
TABLE 38 INDIA REFINERY CATALYSTS MARKET BY APPLICATION (UNITS) 2020-2029
TABLE 39 CHINA REFINERY CATALYSTS MARKET BY MATERIAL (USD MILLIONS) 2020-2029
TABLE 40 CHINA REFINERY CATALYSTS MARKET BY MATERIAL (KILOTONS) 2020-2029
TABLE 41 CHINA REFINERY CATALYSTS MARKET BY APPLICATION (USD MILLIONS) 2020-2029
TABLE 42 CHINA REFINERY CATALYSTS MARKET BY APPLICATION (UNITS) 2020-2029
TABLE 43 JAPAN REFINERY CATALYSTS MARKET BY MATERIAL (USD MILLIONS) 2020-2029
TABLE 44 JAPAN REFINERY CATALYSTS MARKET BY MATERIAL (KILOTONS) 2020-2029
TABLE 45 JAPAN REFINERY CATALYSTS MARKET BY APPLICATION (USD MILLIONS) 2020-2029
TABLE 46 JAPAN REFINERY CATALYSTS MARKET BY APPLICATION (UNITS) 2020-2029
TABLE 47 SOUTH KOREA REFINERY CATALYSTS MARKET BY MATERIAL (USD MILLIONS) 2020-2029
TABLE 48 SOUTH KOREA REFINERY CATALYSTS MARKET BY MATERIAL (KILOTONS) 2020-2029
TABLE 49 SOUTH KOREA REFINERY CATALYSTS MARKET BY APPLICATION (USD MILLIONS) 2020-2029
TABLE 50 SOUTH KOREA REFINERY CATALYSTS MARKET BY APPLICATION (UNITS) 2020-2029
TABLE 51 AUSTRALIA REFINERY CATALYSTS MARKET BY MATERIAL (USD MILLIONS) 2020-2029
TABLE 52 AUSTRALIA REFINERY CATALYSTS MARKET BY MATERIAL (KILOTONS) 2020-2029
TABLE 53 AUSTRALIA REFINERY CATALYSTS MARKET BY APPLICATION (USD MILLIONS) 2020-2029
TABLE 54 AUSTRALIA REFINERY CATALYSTS MARKET BY APPLICATION (UNITS) 2020-2029
TABLE 55 SOUTH-EAST ASIA REFINERY CATALYSTS MARKET BY MATERIAL (USD MILLIONS) 2020-2029
TABLE 56 SOUTH-EAST ASIA REFINERY CATALYSTS MARKET BY MATERIAL (KILOTONS) 2020-2029
TABLE 57 SOUTH-EAST ASIA REFINERY CATALYSTS MARKET BY APPLICATION (USD MILLIONS) 2020-2029
TABLE 58 SOUTH-EAST ASIA REFINERY CATALYSTS MARKET BY APPLICATION (UNITS) 2020-2029
TABLE 59 REST OF ASIA PACIFIC REFINERY CATALYSTS MARKET BY MATERIAL (USD MILLIONS) 2020-2029
TABLE 60 REST OF ASIA PACIFIC REFINERY CATALYSTS MARKET BY MATERIAL (KILOTONS) 2020-2029
TABLE 61 REST OF ASIA PACIFIC REFINERY CATALYSTS MARKET BY APPLICATION (USD MILLIONS) 2020-2029
TABLE 62 REST OF ASIA PACIFIC REFINERY CATALYSTS MARKET BY APPLICATION (UNITS) 2020-2029
TABLE 63 GERMANY REFINERY CATALYSTS MARKET BY MATERIAL (USD MILLIONS) 2020-2029
TABLE 64 GERMANY REFINERY CATALYSTS MARKET BY MATERIAL (KILOTONS) 2020-2029
TABLE 65 GERMANY REFINERY CATALYSTS MARKET BY APPLICATION (USD MILLIONS) 2020-2029
TABLE 66 GERMANY REFINERY CATALYSTS MARKET BY APPLICATION (UNITS) 2020-2029
TABLE 67 UK REFINERY CATALYSTS MARKET BY MATERIAL (USD MILLIONS) 2020-2029
TABLE 68 UK REFINERY CATALYSTS MARKET BY MATERIAL (KILOTONS) 2020-2029
TABLE 69 UK REFINERY CATALYSTS MARKET BY APPLICATION (USD MILLIONS) 2020-2029
TABLE 70 UK REFINERY CATALYSTS MARKET BY APPLICATION (UNITS) 2020-2029
TABLE 71 FRANCE REFINERY CATALYSTS MARKET BY MATERIAL (USD MILLIONS) 2020-2029
TABLE 72 FRANCE REFINERY CATALYSTS MARKET BY MATERIAL (KILOTONS) 2020-2029
TABLE 73 FRANCE REFINERY CATALYSTS MARKET BY APPLICATION (USD MILLIONS) 2020-2029
TABLE 74 FRANCE REFINERY CATALYSTS MARKET BY APPLICATION (UNITS) 2020-2029
TABLE 75 ITALY REFINERY CATALYSTS MARKET BY MATERIAL (USD MILLIONS) 2020-2029
TABLE 76 ITALY REFINERY CATALYSTS MARKET BY MATERIAL (KILOTONS) 2020-2029
TABLE 77 ITALY REFINERY CATALYSTS MARKET BY APPLICATION (USD MILLIONS) 2020-2029
TABLE 78 ITALY REFINERY CATALYSTS MARKET BY APPLICATION (UNITS) 2020-2029
TABLE 79 SPAIN REFINERY CATALYSTS MARKET BY MATERIAL (USD MILLIONS) 2020-2029
TABLE 80 SPAIN REFINERY CATALYSTS MARKET BY MATERIAL (KILOTONS) 2020-2029
TABLE 81 SPAIN REFINERY CATALYSTS MARKET BY APPLICATION (USD MILLIONS) 2020-2029
TABLE 82 SPAIN REFINERY CATALYSTS MARKET BY APPLICATION (UNITS) 2020-2029
TABLE 83 RUSSIA REFINERY CATALYSTS MARKET BY MATERIAL (USD MILLIONS) 2020-2029
TABLE 84 RUSSIA REFINERY CATALYSTS MARKET BY MATERIAL (KILOTONS) 2020-2029
TABLE 85 RUSSIA REFINERY CATALYSTS MARKET BY APPLICATION (USD MILLIONS) 2020-2029
TABLE 86 RUSSIA REFINERY CATALYSTS MARKET BY APPLICATION (UNITS) 2020-2029
TABLE 87 REST OF EUROPE REFINERY CATALYSTS MARKET BY MATERIAL (USD MILLIONS) 2020-2029
TABLE 88 REST OF EUROPE REFINERY CATALYSTS MARKET BY MATERIAL (KILOTONS) 2020-2029
TABLE 89 REST OF EUROPE REFINERY CATALYSTS MARKET BY APPLICATION (USD MILLIONS) 2020-2029
TABLE 90 REST OF EUROPE REFINERY CATALYSTS MARKET BY APPLICATION (UNITS) 2020-2029
TABLE 91 UAE REFINERY CATALYSTS MARKET BY MATERIAL (USD MILLIONS) 2020-2029
TABLE 92 UAE REFINERY CATALYSTS MARKET BY MATERIAL (KILOTONS) 2020-2029
TABLE 93 UAE REFINERY CATALYSTS MARKET BY APPLICATION (USD MILLIONS) 2020-2029
TABLE 94 UAE REFINERY CATALYSTS MARKET BY APPLICATION (UNITS) 2020-2029
TABLE 95 SAUDI ARABIA REFINERY CATALYSTS MARKET BY MATERIAL (USD MILLIONS) 2020-2029
TABLE 96 SAUDI ARABIA REFINERY CATALYSTS MARKET BY MATERIAL (KILOTONS) 2020-2029
TABLE 97 SAUDI ARABIA REFINERY CATALYSTS MARKET BY APPLICATION (USD MILLIONS) 2020-2029
TABLE 98 SAUDI ARABIA REFINERY CATALYSTS MARKET BY APPLICATION (UNITS) 2020-2029
TABLE 99 SOUTH AFRICA REFINERY CATALYSTS MARKET BY MATERIAL (USD MILLIONS) 2020-2029
TABLE 100 SOUTH AFRICA REFINERY CATALYSTS MARKET BY MATERIAL (KILOTONS) 2020-2029
TABLE 101 SOUTH AFRICA REFINERY CATALYSTS MARKET BY APPLICATION (USD MILLIONS) 2020-2029
TABLE 102 SOUTH AFRICA REFINERY CATALYSTS MARKET BY APPLICATION (UNITS) 2020-2029
TABLE 103 REST OF MIDDLE EAST AND AFRICA REFINERY CATALYSTS MARKET BY MATERIAL (USD MILLIONS) 2020-2029
TABLE 104 REST OF MIDDLE EAST AND AFRICA REFINERY CATALYSTS MARKET BY MATERIAL (KILOTONS) 2020-2029
TABLE 105 REST OF MIDDLE EAST AND AFRICA REFINERY CATALYSTS MARKET BY APPLICATION (USD MILLIONS) 2020-2029
TABLE 106 REST OF MIDDLE EAST AND AFRICA REFINERY CATALYSTS MARKET BY APPLICATION (UNITS) 2020-2029
LIST OF FIGURES
FIGURE 1 MARKET DYNAMICS
FIGURE 2 MARKET SEGMENTATION
FIGURE 3 REPORT TIMELINES: YEARS CONSIDERED
FIGURE 4 DATA TRIANGULATION
FIGURE 5 BOTTOM-UP APPROACH
FIGURE 6 TOP-DOWN APPROACH
FIGURE 7 RESEARCH FLOW
FIGURE 8 GLOBAL REFINERY CATALYSTS MARKET BY MATERIAL, USD MILLION, 2020-2029
FIGURE 9 GLOBAL REFINERY CATALYSTS MARKET BY APPLICATION, USD MILLION, 2020-2029
FIGURE 10 GLOBAL REFINERY CATALYSTS MARKET BY REGION, USD MILLION, 2020-2029
FIGURE 11 PORTER’S FIVE FORCES MODEL
FIGURE 12 GLOBAL REFINERY CATALYSTS MARKET BY MATERIAL, USD MILLION, 2020-2029
FIGURE 13 GLOBAL REFINERY CATALYSTS MARKET BY APPLICATION, USD MILLION, 2020-2029
FIGURE 14 GLOBAL REFINERY CATALYSTS MARKET BY REGION, USD MILLION, 2020-2029
FIGURE 15 REFINERY CATALYSTS MARKET BY REGION 2020
FIGURE 16 MARKET SHARE ANALYSIS
FIGURE 17 ALBEMARLE CORPORATION: COMPANY SNAPSHOT
FIGURE 18 W R GRACE: COMPANY SNAPSHOT
FIGURE 19 BASF: COMPANY SNAPSHOT
FIGURE 20 HALDOR TOPSOE: COMPANY SNAPSHOT
FIGURE 21 HONEYWELL UOP: COMPANY SNAPSHOT
FIGURE 22 CLARIANT: COMPANY SNAPSHOT
FIGURE 23 AXENS: COMPANY SNAPSHOT
FIGURE 24 CHINA PETROLEUM AND CHEMICAL CORPORATION: COMPANY SNAPSHOT
FIGURE 25 SHELL CATALYST & TECHNOLOGIES: COMPANY SNAPSHOT
FIGURE 26 ARKEMA: COMPANY SNAPSHOT
DOWNLOAD FREE SAMPLE REPORT
License Type
SPEAK WITH OUR ANALYST
Want to know more about the report or any specific requirement?
WANT TO CUSTOMIZE THE REPORT?
Our Clients Speak
We asked them to research ‘ Equipment market’ all over the world, and their whole arrangement was helpful to us. thehealthanalytics.com insightful analysis and reports contributed to our current analysis and in creating a future strategy. Besides, the te
Yosuke Mitsui
Senior Associate Construction Equipment Sales & Marketing
We asked them to research ‘Equipment market’ all over the world, and their whole arrangement was helpful to us. thehealthanalytics.com insightful analysis and reports contributed to our current analysis and in creating a future strategy. Besides, the te


