

Base Year Value ()
x.x %
x.x %
CAGR ()
x.x %
x.x %
Forecast Year Value ()
x.x %
x.x %
Historical Data Period
Largest Region
Forecast Period
Military Wearables Market by Technology (Communication & Computing, Connectivity, Navigation, Vision & Surveillance, Exoskeleton, Monitoring, Power & Energy Management and Smart Textiles), End User (Land Forces, Airborne Forces and Naval Forces), and Wearable Type (Headwear, Eyewear, Wristwear, Bodywear and Hearables), Region (North America, Europe, Asia Pacific, South America, Middle East and Africa), Global trends and forecast from 2022 to 2029
Instant access to hundreds of data points and trends
- Market estimates from 2014-2029
- Competitive analysis, industry segmentation, financial benchmarks
- Incorporates SWOT, Porter's Five Forces and risk management frameworks
- PDF report or online database with Word, Excel and PowerPoint export options
- 100% money back guarantee
Military Wearables Market Overview
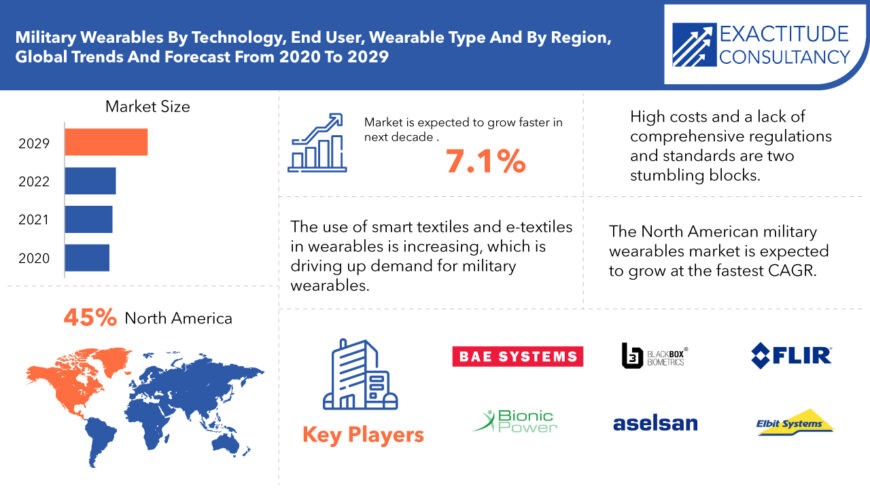
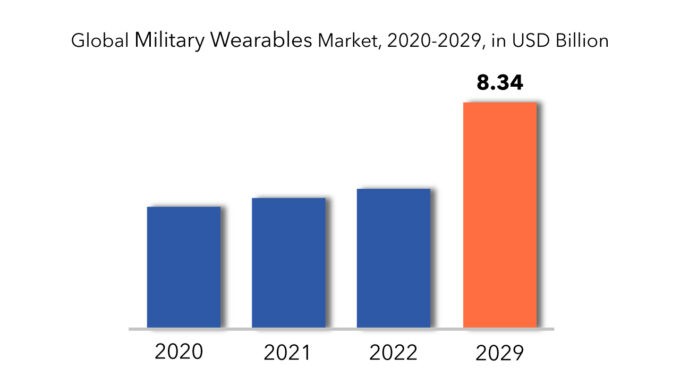
The global military wearables market is expected to grow at 7.1% CAGR from 2022 to 2029. It is expected to reach above USD 8.34 billion by 2029 from USD 4.5 billion in 2020.
Military wearables technology encompasses electronic devices and equipment integrated into the attire and gear of military personnel to enhance their operational capabilities. These devices encompass communication systems, navigation tools, sensor arrays, and various technologies aimed at optimizing soldiers' performance, thereby stimulating growth in the military wearables market. Additionally, this category includes smart watches, intelligent eyewear, heads-up displays, and exoskeletons, all of which can be interconnected, facilitating information sharing and coordination among unit members. Moreover, the proliferation of advanced solutions within wearable technology, such as Augmented Reality (AR), powered exoskeletons, biometric monitoring systems, smart textiles, and intelligent tactical systems, further contributes to market expansion within the forecast period.
Ensuring the welfare and effectiveness of military personnel necessitates equipping them with cutting-edge wearable technology. Devices like biometric sensors and printed heaters offer advantages in terms of self-defense and physiological monitoring. Moreover, emerging wearable technologies contribute to sustainability, mobility, and safety in hazardous environments. For instance, the incorporation of thin, flexible heaters into military attire enhances warmth in adverse weather conditions by integrating them into gloves, boots, helmets, and jackets. Biometric sensors facilitate remote health monitoring of soldiers, while smart clothing equipped with such sensors aids in individual performance monitoring. The integration of biometric sensors into military attire streamlines the monitoring of muscle activity, fatigue, and symmetry.
[caption id="attachment_5387" align="aligncenter" width="870"]
The advent of military wearables heralds a transformative era for armed forces worldwide. Various equipment and gadgets can be seamlessly integrated into soldiers' attire, reducing the burden of additional payloads. Moreover, the integration of wired microsensors into soldiers' gear, connected to a cloud-based centralized server via a captive wireless network, facilitates real-time health monitoring and enhanced connectivity among personnel. Specialized applications can be developed to monitor and manage soldiers deployed in hazardous missions or regions.
[caption id="attachment_5391" align="aligncenter" width="680"]
Military Wearables Market Segment Analysis
The global military wearables market is segmented by technology, end-user, wearables type and region.
Based on technology, the vision and surveillance segment is expected to account for the largest share of the military wearables market. During the forecast period of 2019 to 2025, the connectivity segment is expected to grow at the fastest CAGR. During the forecast period, the development of cutting-edge headsets for tactical communication, wearable computers to track enemy targets, and dismounted PNT for positioning and communication will drive the growth of the military wearables market.
Based on wearables type, the military wearables market has been divided into several categories, including eyewear, wrist wear, smart textiles, modular, ear wear, smart key chains, and others. Smart textiles are expected to be a significant market segment by the end of 2016. The current trend is expected to continue throughout the forecast period. The growing demand for military wearables from developing countries such as India, Pakistan, Brazil, and Mexico are driving the market. Textile-based materials outfitted with electronics and nanotechnology are playing an important role in the evolution of military uniforms. The factors driving the market are an increase in the military wearables market, which is boosting the growth of the smart textiles market, as well as hybrid applications and multi-featured mobile devices. High costs and a lack of comprehensive regulations and standards are some of the impediments.
Based on end-user, the military wearables market has been divided into several segments, including army, air force, navy, and others. Army is expected to be the largest segment by the end of 2016, and this trend is expected to continue from 2016 to 2024. Border issues between countries such as India and China, as well as India and Pakistan, are driving the market. These issues are causing countries to strengthen their defence. As a result, demand for military wearables is increasing. Furthermore, the ongoing conflict in the Crimean Peninsula, Al-Qaeda in Afghanistan, and ISIS in Syria are driving the global military wearables market.
Military Wearables Market Players
The military wearables market key players include Lockheed Martin Corporation (US), BAE Systems (UK), Elbit Systems (Israel), Aselsan A.S. (Turkey), Saab AB (Sweden), General Dynamics (US), Harris Corporation (US), L-3 Technologies (US), Rheinmetall AG (Germany), and Safran (France), among others.
To increase their market position, these businesses have implemented a variety of growth tactics. These companies are using expansion, new product development, mergers and acquisitions, and collaboration as important growth strategies to improve their product portfolio and geographical presence in order to meet the rising demand for corrugated packaging from emerging economies.
Who Should Buy? Or Key Stakeholders
- Military wearables companies
- Semiconductor companies
- Government organisation
- Investment research firms
- Other
Key Takeaways
- The global military wearables market is expected to grow at 7.1% CAGR.
- Based on technology, the vision and surveillance segment is expected to account for the largest share of the military wearables market.
- Based on wearables type, smart textiles are expected to be a significant market segment.
- Based on end-user, army is expected to be the largest segment.
- The North American military wearables market is expected to grow at the fastest CAGR.
- A prominent trend in the Military Wearables Market is the integration of advanced sensor technology for enhanced situational awareness and performance monitoring.
Military Wearables Market Regional Analysis
The military wearables market by region includes North America, Asia-Pacific (APAC), Europe, South America, and Middle East & Africa (MEA).
- North America: includes the US, Canada, Mexico
- Asia Pacific: includes China, Japan, South Korea, India, Australia, ASEAN and Rest of APAC
- Europe: includes UK, Germany, France, Italy, Spain, Russia, and Rest of Europe
- South America: includes Brazil, Argentina and Rest of South America
- Middle East & Africa: includes Turkey, UAE, Saudi Arabia, South Africa, and Rest of MEA
The North American military wearables market is expected to grow at the fastest CAGR. Increasing spending on soldier modernization programmes, as well as increased R&D activities, will drive the growth of military wearables during the forecast period. Exoskeleton, smart textiles, power & energy management, and communication & computing advancements are fueling demand for military wearables in this region.
[caption id="attachment_5393" align="alignnone" width="680"]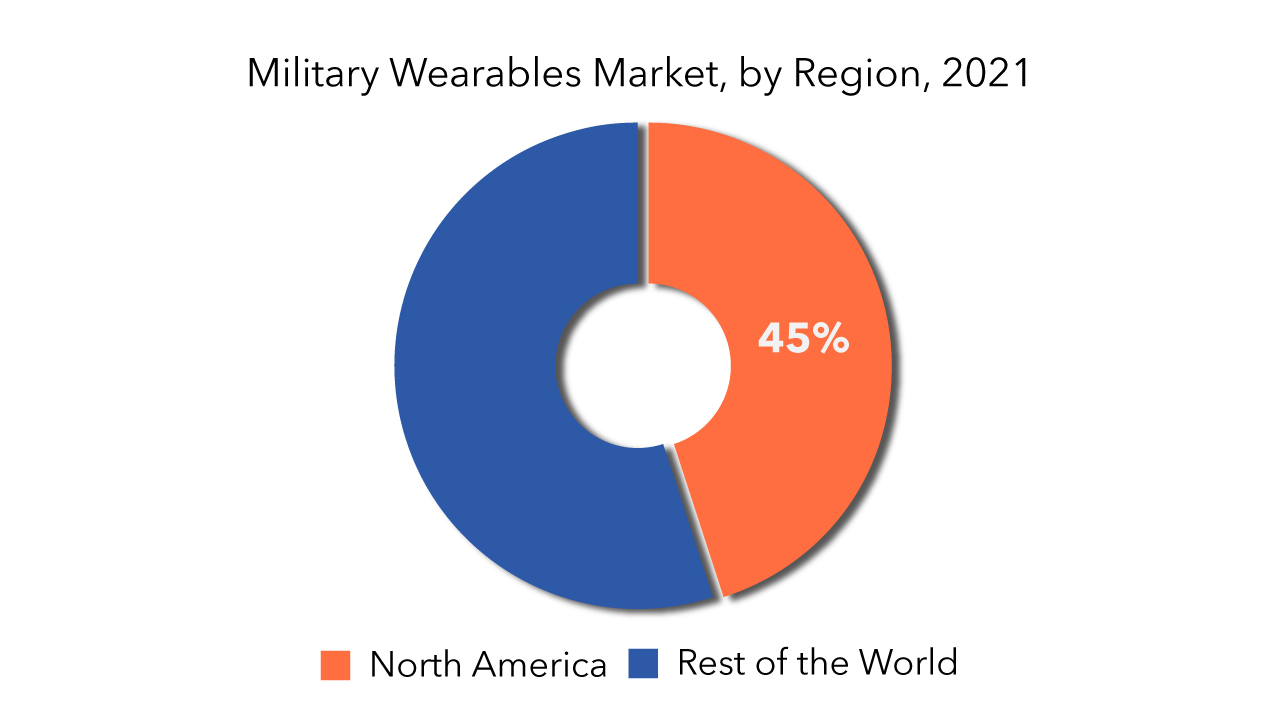
Key Market Segments: Military Wearables Market
Military Wearables Market By Technology, 2020-2029, (USD Million)- Communication & Computing
- Connectivity
- Exoskeleton
- Monitoring
- Power & Energy Management
- Smart Textiles
- Land Forces
- Airborne Forces
- Naval Forces
- Headwear
- Eyewear
- Wristwear
- Bodywear
- Hearables
- North America
- Europe
- Asia Pacific
- South America
- Middle East And Africa
Key Question Answered
- What is the current size of the military wearables market?
- What are the key factors influencing the growth of military wearables?
- What is the major end-use industry for military wearables?
- Who are the major key players in the military wearables market?
- Which region will provide more business opportunities for military wearables in future?
- Which segment holds the maximum share of the military wearables market?
- Introduction
- Market Definition
- Market Segmentation
- Research Timelines
- Assumptions and Limitations
- Research Methodology
- Data Mining
- Secondary Research
- Primary Research
- Subject-Matter Experts’ Advice
- Quality Checks
- Final Review
- Data Triangulation
- Bottom-Up Approach
- Top-Down Approach
- Research Flow
- Data Sources
- Data Mining
- Executive Summary
- Market Overview
- Global Military Wearables Market Outlook
- Market Drivers
- Market Restraints
- Market Opportunities
- Impact of Covid-19 On Military Wearables Market
- Porter’s five forces model
- Threat from new entrants
- Threat from substitutes
- Bargaining power of suppliers
- Bargaining power of customers
- Degree of competition
- Industry value chain Analysis
- Global Military Wearables Market Outlook
- Global Military Wearables Market by Technology
- Communication & Computing
- Connectivity
- Exoskeleton
- Monitoring
- Power & Energy Management
- Smart Textiles
- Global Military Wearables Market by End Use
- Land Forces
- Airborne Forces
- Naval Forces
- Global Military Wearables Market by Wearables Type
- Headwear
- Eyewear
- Wristwear
- Bodywear
- Hearables
- Global Military Wearables Market by Region
- North America
- US
- Canada
- Mexico
- South America
- Brazil
- Argentina
- Colombia
- Rest Of South America
- Europe
- Germany
- UK
- France
- Italy
- Spain
- Russia
- Rest Of Europe
- Asia Pacific
- India
- China
- Japan
- South Korea
- Australia
- South-East Asia
- Rest Of Asia Pacific
- Middle East and Africa
- UAE
- Saudi Arabia
- South Africa
- Rest Of Middle East and Africa
- North America
- Company Profiles* (Business Overview, Company Snapshot, Products Offered, Recent Developments)
-
- Aselsan A.S.
- BAE Systems PLC
- Bionic Power, Inc.
- BlackBox Biometrics, Inc.
- Elbit Systems Ltd.
- FLIR Systems, Inc.
- General Dynamics Corp.
- Harris Corp.
- Honeywell International, Inc.
- Interactive Wear AG
- KDH Defense Systems, Inc.
- L3Harris Technologies, Inc.
- Leonardo S.p.A.
- Lockheed Martin Corp.
- Mars, Inc.
- Microsoft Corp.
- Northrop Grumman Corp.
- Rockwell Collins, Inc.
*The Company List Is Indicative
LIST OF TABLES
TABLE 1 GLOBAL MILITARY WEARABLES MARKET BY TECHNOLOGY (USD MILLIONS) 2020-2029
TABLE 2 GLOBAL MILITARY WEARABLES MARKET BY END USER (USD MILLIONS) 2020-2029
TABLE 3 GLOBAL MILITARY WEARABLES MARKET BY WEARABLE TYPE (USD MILLIONS) 2019-2028
TABLE 4 GLOBAL MILITARY WEARABLES MARKET BY REGION (USD MILLIONS) 2020-2029
TABLE 5 US MILITARY WEARABLES MARKET BY TECHNOLOGY (USD MILLIONS) 2020-2029
TABLE 6 US MILITARY WEARABLES MARKET BY END USER (USD MILLIONS) 2020-2029
TABLE 7 US MILITARY WEARABLES MARKET BY WEARABLE TYPE (USD MILLIONS) 2019-2028
TABLE 8 CANADA MILITARY WEARABLES MARKET BY TECHNOLOGY (USD MILLIONS) 2020-2029
TABLE 9 CANADA MILITARY WEARABLES MARKET BY END USER (USD MILLIONS) 2020-2029
TABLE 10 CANADA MILITARY WEARABLES MARKET BY WEARABLE TYPE (USD MILLIONS) 2019-2028
TABLE 11 MEXICO MILITARY WEARABLES MARKET BY TECHNOLOGY (USD MILLIONS) 2020-2029
TABLE 12 MEXICO MILITARY WEARABLES MARKET BY END USER (USD MILLIONS) 2020-2029
TABLE 13 MEXICO MILITARY WEARABLES MARKET BY WEARABLE TYPE (USD MILLIONS) 2019-2028
TABLE 14 BRAZIL MILITARY WEARABLES MARKET BY TECHNOLOGY (USD MILLIONS) 2020-2029
TABLE 15 BRAZIL MILITARY WEARABLES MARKET BY END USER (USD MILLIONS) 2020-2029
TABLE 16 BRAZIL MILITARY WEARABLES MARKET BY WEARABLE TYPE (USD MILLIONS) 2019-2028
TABLE 17 ARGENTINA MILITARY WEARABLES MARKET BY TECHNOLOGY (USD MILLIONS) 2020-2029
TABLE 18 ARGENTINA MILITARY WEARABLES MARKET BY END USER (USD MILLIONS) 2020-2029
TABLE 19 ARGENTINA MILITARY WEARABLES MARKET BY WEARABLE TYPE (USD MILLIONS) 2019-2028
TABLE 20 COLOMBIA MILITARY WEARABLES MARKET BY TECHNOLOGY (USD MILLIONS) 2020-2029
TABLE 21 COLOMBIA MILITARY WEARABLES MARKET BY END USER (USD MILLIONS) 2020-2029
TABLE 22 COLOMBIA MILITARY WEARABLES MARKET BY WEARABLE TYPE (USD MILLIONS) 2019-2028
TABLE 23 REST OF SOUTH AMERICA MILITARY WEARABLES MARKET BY TECHNOLOGY (USD MILLIONS) 2020-2029
TABLE 24 REST OF SOUTH AMERICA MILITARY WEARABLES MARKET BY END USER (USD MILLIONS) 2020-2029
TABLE 25 REST OF SOUTH AMERICA MILITARY WEARABLES MARKET BY WEARABLE TYPE (USD MILLIONS) 2019-2028
TABLE 26 INDIA MILITARY WEARABLES MARKET BY TECHNOLOGY (USD MILLIONS) 2020-2029
TABLE 27 INDIA MILITARY WEARABLES MARKET BY END USER (USD MILLIONS) 2020-2029
TABLE 28 INDIA MILITARY WEARABLES MARKET BY WEARABLE TYPE (USD MILLIONS) 2019-2028
TABLE 29 CHINA MILITARY WEARABLES MARKET BY TECHNOLOGY (USD MILLIONS) 2020-2029
TABLE 30 CHINA MILITARY WEARABLES MARKET BY END USER (USD MILLIONS) 2020-2029
TABLE 31 CHINA MILITARY WEARABLES MARKET BY WEARABLE TYPE (USD MILLIONS) 2019-2028
TABLE 32 JAPAN MILITARY WEARABLES MARKET BY TECHNOLOGY (USD MILLIONS) 2020-2029
TABLE 33 JAPAN MILITARY WEARABLES MARKET BY END USER (USD MILLIONS) 2020-2029
TABLE 34 JAPAN MILITARY WEARABLES MARKET BY WEARABLE TYPE (USD MILLIONS) 2019-2028
TABLE 35 SOUTH KOREA MILITARY WEARABLES MARKET BY TECHNOLOGY (USD MILLIONS) 2020-2029
TABLE 36 SOUTH KOREA MILITARY WEARABLES MARKET BY END USER (USD MILLIONS) 2020-2029
TABLE 37 SOUTH KOREA MILITARY WEARABLES MARKET BY WEARABLE TYPE (USD MILLIONS) 2019-2028
TABLE 38 AUSTRALIA MILITARY WEARABLES MARKET BY TECHNOLOGY (USD MILLIONS) 2020-2029
TABLE 39 AUSTRALIA MILITARY WEARABLES MARKET BY END USER (USD MILLIONS) 2020-2029
TABLE 40 AUSTRALIA MILITARY WEARABLES MARKET BY WEARABLE TYPE (USD MILLIONS) 2019-2028
TABLE 41 SOUTH-EAST ASIA MILITARY WEARABLES MARKET BY TECHNOLOGY (USD MILLIONS) 2020-2029
TABLE 42 SOUTH-EAST ASIA MILITARY WEARABLES MARKET BY END USER (USD MILLIONS) 2020-2029
TABLE 43 SOUTH-EAST ASIA MILITARY WEARABLES MARKET BY WEARABLE TYPE (USD MILLIONS) 2019-2028
TABLE 44 REST OF ASIA PACIFIC MILITARY WEARABLES MARKET BY TECHNOLOGY (USD MILLIONS) 2020-2029
TABLE 45 REST OF ASIA PACIFIC MILITARY WEARABLES MARKET BY END USER (USD MILLIONS) 2020-2029
TABLE 46 REST OF ASIA PACIFIC MILITARY WEARABLES MARKET BY WEARABLE TYPE (USD MILLIONS) 2019-2028
TABLE 47 GERMANY MILITARY WEARABLES MARKET BY TECHNOLOGY (USD MILLIONS) 2020-2029
TABLE 48 GERMANY MILITARY WEARABLES MARKET BY END USER (USD MILLIONS) 2020-2029
TABLE 49 GERMANY MILITARY WEARABLES MARKET BY WEARABLE TYPE (USD MILLIONS) 2019-2028
TABLE 50 UK MILITARY WEARABLES MARKET BY TECHNOLOGY (USD MILLIONS) 2020-2029
TABLE 51 UK MILITARY WEARABLES MARKET BY END USER (USD MILLIONS) 2020-2029
TABLE 52 UK MILITARY WEARABLES MARKET BY WEARABLE TYPE (USD MILLIONS) 2019-2028
TABLE 53 FRANCE MILITARY WEARABLES MARKET BY TECHNOLOGY (USD MILLIONS) 2020-2029
TABLE 54 FRANCE MILITARY WEARABLES MARKET BY END USER (USD MILLIONS) 2020-2029
TABLE 55 FRANCE MILITARY WEARABLES MARKET BY WEARABLE TYPE (USD MILLIONS) 2019-2028
TABLE 56 ITALY MILITARY WEARABLES MARKET BY TECHNOLOGY (USD MILLIONS) 2020-2029
TABLE 57 ITALY MILITARY WEARABLES MARKET BY END USER (USD MILLIONS) 2020-2029
TABLE 58 ITALY MILITARY WEARABLES MARKET BY WEARABLE TYPE (USD MILLIONS) 2019-2028
TABLE 59 SPAIN MILITARY WEARABLES MARKET BY TECHNOLOGY (USD MILLIONS) 2020-2029
TABLE 60 SPAIN MILITARY WEARABLES MARKET BY END USER (USD MILLIONS) 2020-2029
TABLE 61 SPAIN MILITARY WEARABLES MARKET BY WEARABLE TYPE (USD MILLIONS) 2019-2028
TABLE 62 RUSSIA MILITARY WEARABLES MARKET BY TECHNOLOGY (USD MILLIONS) 2020-2029
TABLE 63 RUSSIA MILITARY WEARABLES MARKET BY END USER (USD MILLIONS) 2020-2029
TABLE 64 RUSSIA MILITARY WEARABLES MARKET BY WEARABLE TYPE (USD MILLIONS) 2019-2028
TABLE 65 REST OF EUROPE MILITARY WEARABLES MARKET BY TECHNOLOGY (USD MILLIONS) 2020-2029
TABLE 66 REST OF EUROPE MILITARY WEARABLES MARKET BY END USER (USD MILLIONS) 2020-2029
TABLE 67 REST OF EUROPE MILITARY WEARABLES MARKET BY WEARABLE TYPE (USD MILLIONS) 2019-2028
TABLE 68 UAE MILITARY WEARABLES MARKET BY TECHNOLOGY (USD MILLIONS) 2020-2029
TABLE 69 UAE MILITARY WEARABLES MARKET BY END USER (USD MILLIONS) 2020-2029
TABLE 70 UAE MILITARY WEARABLES MARKET BY WEARABLE TYPE (USD MILLIONS) 2019-2028
TABLE 71 SAUDI ARABIA MILITARY WEARABLES MARKET BY TECHNOLOGY (USD MILLIONS) 2020-2029
TABLE 72 SAUDI ARABIA MILITARY WEARABLES MARKET BY END USER (USD MILLIONS) 2020-2029
TABLE 73 SAUDI ARABIA MILITARY WEARABLES MARKET BY WEARABLE TYPE (USD MILLIONS) 2019-2028
TABLE 74 SOUTH AFRICA MILITARY WEARABLES MARKET BY TECHNOLOGY (USD MILLIONS) 2020-2029
TABLE 75 SOUTH AFRICA MILITARY WEARABLES MARKET BY END USER (USD MILLIONS) 2020-2029
TABLE 76 SOUTH AFRICA MILITARY WEARABLES MARKET BY WEARABLE TYPE (USD MILLIONS) 2019-2028
TABLE 77 REST OF MIDDLE EAST AND AFRICA MILITARY WEARABLES MARKET BY TECHNOLOGY (USD MILLIONS) 2020-2029
TABLE 78 REST OF MIDDLE EAST AND AFRICA MILITARY WEARABLES MARKET BY END USER (USD MILLIONS) 2020-2029
TABLE 79 REST OF MIDDLE EAST AND AFRICA MILITARY WEARABLES MARKET BY WEARABLE TYPE (USD MILLIONS) 2019-2028
LIST OF FIGURES
FIGURE 1 MARKET DYNAMICS
FIGURE 2 MARKET SEGMENTATION
FIGURE 3 REPORT TIMELINES: YEARS CONSIDERED
FIGURE 4 DATA TRIANGULATION
FIGURE 5 BOTTOM-UP APPROACH
FIGURE 6 TOP-DOWN APPROACH
FIGURE 7 RESEARCH FLOW
FIGURE 8 GLOBAL MILITARY WEARABLES MARKET BY TECHNOLOGY, USD MILLION, 2020-2029
FIGURE 9 GLOBAL MILITARY WEARABLES MARKET BY END USE, USD MILLION, 2020-2029
FIGURE 10 GLOBAL MILITARY WEARABLES MARKET BY WEARABLES TYPE, USD MILLION, 2020-2029
FIGURE 11 GLOBAL MILITARY WEARABLES MARKET BY REGION, USD MILLION, 2020-2029
FIGURE 12 PORTER’S FIVE FORCES MODEL
FIGURE 13 NORTH AMERICA MILITARY WEARABLES MARKET SNAPSHOT
FIGURE 14 EUROPE MILITARY WEARABLES MARKET SNAPSHOT
FIGURE 15 ASIA PACIFIC MILITARY WEARABLES MARKET SNAPSHOT
FIGURE 16 SOUTH AMERICA MILITARY WEARABLES MARKET SNAPSHOT
FIGURE 17 MIDDLE EAST & AFRICA MILITARY WEARABLES MARKET SNAPSHOT
FIGURE 18 ASELSAN A.S.: COMPANY SNAPSHOT
FIGURE 19 BAE SYSTEMS PLC: COMPANY SNAPSHOT
FIGURE 20 BIONIC POWER, INC.: COMPANY SNAPSHOT
FIGURE 21 BLACKBOX BIOMETRICS, INC.: COMPANY SNAPSHOT
FIGURE 22 ELBIT SYSTEMS LTD.: COMPANY SNAPSHOT
FIGURE 23 FLIR SYSTEMS, INC.: COMPANY SNAPSHOT
FIGURE 24 GENERAL DYNAMICS CORP.: COMPANY SNAPSHOT
FIGURE 25 HARRIS CORP.: COMPANY SNAPSHOT
FIGURE 26 HONEYWELL INTERNATIONAL, INC.: COMPANY SNAPSHOT
FIGURE 27 INTERACTIVE WEAR AG: COMPANY SNAPSHOT
FIGURE 28 KDH DEFENSE SYSTEMS, INC.: COMPANY SNAPSHOT
FIGURE 29 L3HARRIS TECHNOLOGIES, INC.: COMPANY SNAPSHOT
FIGURE 30 LEONARDO S.P.A.: COMPANY SNAPSHOT
FIGURE 31 LOCKHEED MARTIN CORP.: COMPANY SNAPSHOT
FIGURE 32 MARS, INC.: COMPANY SNAPSHOT
FIGURE 33 MICROSOFT CORP.: COMPANY SNAPSHOT
FIGURE 34 NORTHROP GRUMMAN CORP.: COMPANY SNAPSHOT
FIGURE 35 ROCKWELL COLLINS, INC.: COMPANY SNAPSHOT
DOWNLOAD FREE SAMPLE REPORT
License Type
SPEAK WITH OUR ANALYST
Want to know more about the report or any specific requirement?
WANT TO CUSTOMIZE THE REPORT?
Our Clients Speak
We asked them to research ‘ Equipment market’ all over the world, and their whole arrangement was helpful to us. thehealthanalytics.com insightful analysis and reports contributed to our current analysis and in creating a future strategy. Besides, the te
Yosuke Mitsui
Senior Associate Construction Equipment Sales & Marketing
We asked them to research ‘Equipment market’ all over the world, and their whole arrangement was helpful to us. thehealthanalytics.com insightful analysis and reports contributed to our current analysis and in creating a future strategy. Besides, the te


