

Base Year Value ()
x.x %
x.x %
CAGR ()
x.x %
x.x %
Forecast Year Value ()
x.x %
x.x %
Historical Data Period
Largest Region
Forecast Period
SONAR System Market by Product Type (Hull-Mounted, Stern-Mounted, Sonobuoy), Application (Commercial and Defense) and End User (Line Fit and Retrofit) and Region (North America, Europe, Asia Pacific, South America, Middle East and Africa), Global Opportunity Analysis and Industry Forecast 2022–2029
Instant access to hundreds of data points and trends
- Market estimates from 2014-2029
- Competitive analysis, industry segmentation, financial benchmarks
- Incorporates SWOT, Porter's Five Forces and risk management frameworks
- PDF report or online database with Word, Excel and PowerPoint export options
- 100% money back guarantee
SONAR System Market Overview
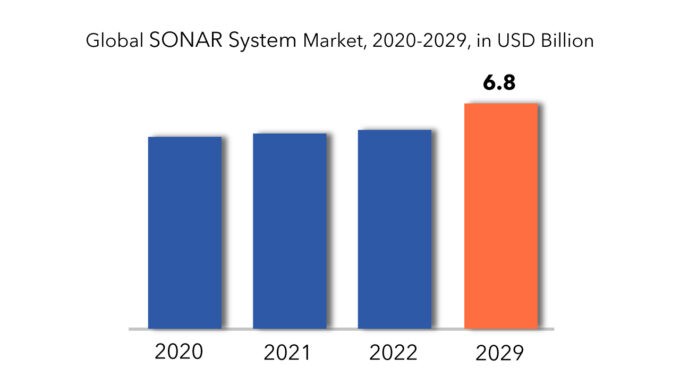
The SONAR system market is estimated to be USD 5.79 billion in 2020 and is projected to reach USD 6.8 billion by 2029, at a CAGR of 1.8% from 2022 to 2029.
A SONAR (Sound Navigation and Ranging) system is a technological apparatus utilized for the detection and localization of submerged objects through the emission of sound pulses and subsequent analysis of the resultant echoes. Analogous to the echolocation mechanism employed by bats, SONAR systems project pulses of sound waves into the aquatic medium, which subsequently rebound off submerged entities before returning to the system. Through meticulous examination of the temporal intervals between sound wave emission and reception, alongside the attributes of the echoed signals, SONAR systems ascertain pertinent metrics including but not limited to the distance, orientation, dimensions, and morphology of underwater entities.
The consistent expansion observed in the distribution of military vessels is anticipated to propel the market for SONAR systems. Military vessels rely on a subset of highly sophisticated SONAR systems to achieve the pinnacle of precision. Within the domain of military vessels, SONAR systems serve a multitude of purposes including mine detection, seabed topography analysis, anti-submarine warfare, diver detection, and port security, among others. Distinct classes of vessels leverage varied SONAR configurations tailored to specific operational requirements; for instance, submarines employ passive SONAR for clandestine maneuvering in enemy waters, whereas vessels such as frigates and corvettes opt for multi-static SONAR for adversary detection. The surge in the distribution of such military vessels augurs well for the growth trajectory of the SONAR systems market in the foreseeable future.
[caption id="attachment_9316" align="aligncenter" width="870"]
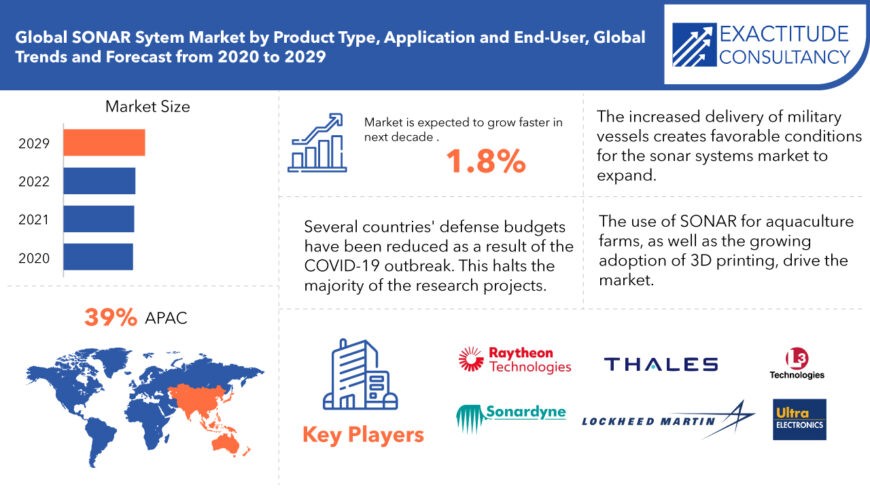
Furthermore, the SONAR system employed for piscine surveillance integrates a deep neural network architecture. With burgeoning demand for fish monitoring in aquaculture facilities aimed at augmenting fishery resources, the requisite for such monitoring technologies is poised for escalation. Comprising a high-fidelity imaging SONAR apparatus complemented by an underwater optical camera, the deep neural network SONAR system facilitates diurnal surveillance and contributes towards the refinement of piscicultural practices, thus stimulating market expansion.
[caption id="attachment_9317" align="aligncenter" width="680"]
SONAR System Market Segment Analysis
Based on product type, the market is segmented into hull-mounted, stern-mounted and sonobuoy. The hull-mounted segment consists of forward-looking sonar, echo sounders, and omni-directional sonar. The hull-mounted is the dominant segment in SONAR system market. The increased demand for forward-looking sonar in defense vessels is attributed to the growth. Such systems are used to improve the efficiency of naval ships through vessel traffic management services. The Sonobuoy segment will experience rapid growth as the navy's ability to combat submarine attack threats improves. The stern-mounted segment is expected to grow significantly as demand for towed array sonar systems for surveillance and reconnaissance activities rises.
By application, the market is divided into commercial and defense. The commercial segment is expected to grow the fastest during the forecast period. This expansion can be attributed to rising demand for oil and gas survey applications such as hydrographic surveys, fish chirp sonars, and improving overall ship delivery and retrofitting operations. The increase in defense sector can be attributed to the increased use of sonars for mine detection, countermeasure operations, and port security.
The market is divided into two segments based on end-user: line fit and retrofit. During the forecast period, the line-fit segment is expected to grow the fastest. The driver is the increased demand for naval vessels outfitted with advanced sonar systems. The expansion of retrofit segment can be attributed to an increase in the upgrade of connected systems for conventional naval ships.
SONAR System Market Players
The key market players in SONAR system include Thales Group (France), Atlas Elektronik GmbH (Germany), Raytheon Company (US), Lockheed Martin (US), L-3 Technologies Inc. (US) and Ultra Electronics (UK). Major players in the hydrographic sonar market include Kongsberg Gruppen ASA (Norway), Teledyne Technologies Inc. (US), and Sonardyne (UK). Navigation and fisheries sonars are provided by Furuno Electric Co., Ltd. (Japan), Japan Radio Company (Japan), Navico (Norway), and FLIR Systems (US).
New strategies such as product launches, enhancements, partnerships, collaborations, and strategic acquisitions were adopted by market players to strengthen their product portfolios and maintain a competitive position in the market.
Who Should Buy? Or Key Stakeholders
- Defense
- Hydrographic Charting
- Offshore Oil and Gas Industries
- Port and Harbor Management
- Coastal Engineering Companies
- Others
Key Takeaways
- The SONAR system market is estimated to grow at a CAGR of 1.8%
- Based on product type, the hull-mounted is the dominant segment in SONAR system market.
- Based on application, the commercial segment is expected to grow the fastest during the forecast period.
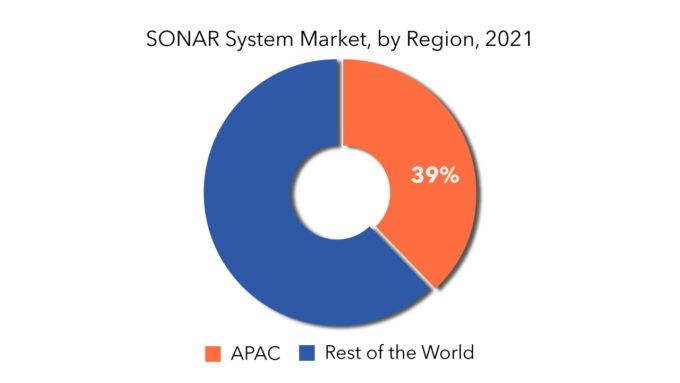
- Asia Pacific dominated the regional market share.
- The major trend in the SONAR system market is the integration of advanced signal processing algorithms for enhanced detection and classification capabilities.
SONAR System Market Regional Analysis
Geographically, the SONAR SYSTEM market is segmented into North America, South America, Europe, Asia Pacific and Middle East & Africa (MEA). Asia Pacific is expected to dominate the SONAR system market due to numerous factors such as a large consumer base and industrialization & urbanization.
- Asia Pacific: includes China, Japan, South Korea, India, Australia, and Rest of APAC
- Europe: includes UK, Germany, France, Italy, Spain, and Rest of Europe
- North America: includes the US, Canada, Mexico
- South America: Brazil and Rest of South America
- Middle East & Africa: includes Saudi Arabia, South Africa, and Rest of MEA
[caption id="attachment_9318" align="alignnone" width="680"]
SONAR System Market | Exactitude Consultancy [/caption]
Key Market Segments: Global Sonar System Market
SONAR System Market by Product Type, 2022-2029 (In USD Million, Thousand Units)- Hull-Mounted
- Stern-Mounted
- Sonobouy
- Commercial
- Defense
- Line Fit
- Retrofit
- Asia Pacific
- Europe
- North America
- South America
- Middle East And Africa
Key Question Answered
- What is the current scenario of the global SONAR system market?
- What are the emerging technologies for the development of SONAR system market?
- What are the historical size and the present size of the market segments and their future potential?
- What are the major catalysts for the market and their impact during the short, medium, and long terms?
- What are the evolving opportunities for the players in the market?
- Which are the key regions from the investment perspective?
- What are the key strategies being adopted by the major players to up their market shares?
- Introduction
- Market Definition
- Market Segmentation
- Research Timelines
- Assumptions and Limitations
- Research Methodology
- Data Mining
- Secondary Research
- Primary Research
- Subject-Matter Experts’ Advice
- Quality Checks
- Final Review
- Data Triangulation
- Bottom-Up Approach
- Top-Down Approach
- Research Flow
- Data Sources
- Data Mining
- Executive Summary
- Market Overview
- Global Sonar System Market Outlook
- Market Drivers
- Market Restraints
- Market Opportunities
- Impact of Covid-19 On Sonar System Market
- Porter’s five forces model
- Threat from new entrants
- Threat from substitutes
- Bargaining power of suppliers
- Bargaining power of customers
- Degree of competition
- Industry value chain Analysis
- Global Sonar System Market Outlook
- Global Sonar System Market By Product Type
- Hull-Mounted
- Stern-Mounted
- Sonobouy
- Global Sonar System Market By Application
- Commercial
- Defense
- Global Sonar System Market By End User
- Line Fit
- Retrofit
- Global Sonar System Market By Region
- North America
- US
- Canada
- Mexico
- South America
- Brazil
- Rest Of South America
- Europe
- Germany
- UK
- France
- Italy
- Spain
- Rest Of Europe
- Asia Pacific
- India
- China
- Japan
- South Korea
- Australia
- Rest Of Asia Pacific
- Middle East and Africa
- Saudi Arabia
- South Africa
- Rest Of Middle East and Africa
- North America
- Company Profiles* (Business Overview, Company Snapshot, Products Offered, Recent Developments)
-
- Thales Group
- Atlas Electronik GmbH
- Raytheon Company
- Lockheed Martin
- L-3 Technologies Inc.
- Ultra Electronics
- Kongsberg Gruppen ASA
- Teledyne Technologies Inc.
- Sonardyne
- Furuno Electric Co. Ltd.
- Japan Radio Company
- Navico
- FLIR Systems
*The Company List Is Indicative
LIST OF TABLES
TABLE 1 GLOBAL SONAR SYSTEM MARKET BY APPLICATION (USD MILLIONS) 2020-2029
TABLE 2 GLOBAL SONAR SYSTEM MARKET BY APPLICATION (THOUSAND UNITS) 2020-2029
TABLE 3 GLOBAL SONAR SYSTEM MARKET BY PRODUCT TYPE (USD MILLIONS) 2020-2029
TABLE 4 GLOBAL SONAR SYSTEM MARKET BY PRODUCT TYPE (THOUSAND UNITS) 2020-2029
TABLE 5 GLOBAL SONAR SYSTEM MARKET BY END USER (USD MILLIONS) 2020-2029
TABLE 6 GLOBAL SONAR SYSTEM MARKET BY END USER (THOUSAND UNITS) 2020-2029
TABLE 7 US SONAR SYSTEM MARKET BY APPLICATION (USD MILLIONS) 2020-2029
TABLE 8 US SONAR SYSTEM MARKET BY APPLICATION (THOUSAND UNITS) 2020-2029
TABLE 9 US SONAR SYSTEM MARKET BY PRODUCT TYPE (USD MILLIONS) 2020-2029
TABLE 10 US SONAR SYSTEM MARKET BY PRODUCT TYPE (THOUSAND UNITS) 2020-2029
TABLE 11 US SONAR SYSTEM MARKET BY END USER (USD MILLIONS) 2020-2029
TABLE 12 US SONAR SYSTEM MARKET BY END USER (THOUSAND UNITS) 2020-2029
TABLE 13 CANADA SONAR SYSTEM MARKET BY APPLICATION (USD MILLIONS) 2020-2029
TABLE 14 CANADA SONAR SYSTEM MARKET BY APPLICATION (THOUSAND UNITS) 2020-2029
TABLE 15 CANADA SONAR SYSTEM MARKET BY PRODUCT TYPE (USD MILLIONS) 2020-2029
TABLE 16 CANADA SONAR SYSTEM MARKET BY PRODUCT TYPE (THOUSAND UNITS) 2020-2029
TABLE 17 CANADA SONAR SYSTEM MARKET BY END USER (USD MILLIONS) 2020-2029
TABLE 18 CANADA SONAR SYSTEM MARKET BY END USER (THOUSAND UNITS) 2020-2029
TABLE 19 MEXICO SONAR SYSTEM MARKET BY APPLICATION (USD MILLIONS) 2020-2029
TABLE 20 MEXICO SONAR SYSTEM MARKET BY APPLICATION (THOUSAND UNITS) 2020-2029
TABLE 21 MEXICO SONAR SYSTEM MARKET BY PRODUCT TYPE (USD MILLIONS) 2020-2029
TABLE 22 MEXICO SONAR SYSTEM MARKET BY PRODUCT TYPE (THOUSAND UNITS) 2020-2029
TABLE 23 MEXICO SONAR SYSTEM MARKET BY END USER (USD MILLIONS) 2020-2029
TABLE 24 MEXICO SONAR SYSTEM MARKET BY END USER (THOUSAND UNITS) 2020-2029
TABLE 25 BRAZIL SONAR SYSTEM MARKET BY APPLICATION (USD MILLIONS) 2020-2029
TABLE 26 BRAZIL SONAR SYSTEM MARKET BY APPLICATION (THOUSAND UNITS) 2020-2029
TABLE 27 BRAZIL SONAR SYSTEM MARKET BY PRODUCT TYPE (USD MILLIONS) 2020-2029
TABLE 28 BRAZIL SONAR SYSTEM MARKET BY PRODUCT TYPE (THOUSAND UNITS) 2020-2029
TABLE 29 BRAZIL SONAR SYSTEM MARKET BY END USER (USD MILLIONS) 2020-2029
TABLE 30 BRAZIL SONAR SYSTEM MARKET BY END USER (THOUSAND UNITS) 2020-2029
TABLE 31 ARGENTINA SONAR SYSTEM MARKET BY APPLICATION (USD MILLIONS) 2020-2029
TABLE 32 ARGENTINA SONAR SYSTEM MARKET BY APPLICATION (THOUSAND UNITS) 2020-2029
TABLE 33 ARGENTINA SONAR SYSTEM MARKET BY PRODUCT TYPE (USD MILLIONS) 2020-2029
TABLE 34 ARGENTINA SONAR SYSTEM MARKET BY PRODUCT TYPE (THOUSAND UNITS) 2020-2029
TABLE 35 ARGENTINA SONAR SYSTEM MARKET BY END USER (USD MILLIONS) 2020-2029
TABLE 36 ARGENTINA SONAR SYSTEM MARKET BY END USER (THOUSAND UNITS) 2020-2029
TABLE 37 COLOMBIA SONAR SYSTEM MARKET BY APPLICATION (USD MILLIONS) 2020-2029
TABLE 38 COLOMBIA SONAR SYSTEM MARKET BY APPLICATION (THOUSAND UNITS) 2020-2029
TABLE 39 COLOMBIA SONAR SYSTEM MARKET BY PRODUCT TYPE (USD MILLIONS) 2020-2029
TABLE 40 COLOMBIA SONAR SYSTEM MARKET BY PRODUCT TYPE (THOUSAND UNITS) 2020-2029
TABLE 41 COLOMBIA SONAR SYSTEM MARKET BY END USER (USD MILLIONS) 2020-2029
TABLE 42 COLOMBIA SONAR SYSTEM MARKET BY END USER (THOUSAND UNITS) 2020-2029
TABLE 43 REST OF SOUTH AMERICA SONAR SYSTEM MARKET BY APPLICATION (USD MILLIONS) 2020-2029
TABLE 44 REST OF SOUTH AMERICA SONAR SYSTEM MARKET BY APPLICATION (THOUSAND UNITS) 2020-2029
TABLE 45 REST OF SOUTH AMERICA SONAR SYSTEM MARKET BY PRODUCT TYPE (USD MILLIONS) 2020-2029
TABLE 46 REST OF SOUTH AMERICA SONAR SYSTEM MARKET BY PRODUCT TYPE (THOUSAND UNITS) 2020-2029
TABLE 47 REST OF SOUTH AMERICA SONAR SYSTEM MARKET BY END USER (USD MILLIONS) 2020-2029
TABLE 48 REST OF SOUTH AMERICA SONAR SYSTEM MARKET BY END USER (THOUSAND UNITS) 2020-2029
TABLE 49 INDIA SONAR SYSTEM MARKET BY APPLICATION (USD MILLIONS) 2020-2029
TABLE 50 INDIA SONAR SYSTEM MARKET BY APPLICATION (THOUSAND UNITS) 2020-2029
TABLE 51 INDIA SONAR SYSTEM MARKET BY PRODUCT TYPE (USD MILLIONS) 2020-2029
TABLE 52 INDIA SONAR SYSTEM MARKET BY PRODUCT TYPE (THOUSAND UNITS) 2020-2029
TABLE 53 INDIA SONAR SYSTEM MARKET BY END USER (USD MILLIONS) 2020-2029
TABLE 54 INDIA SONAR SYSTEM MARKET BY END USER (THOUSAND UNITS) 2020-2029
TABLE 55 CHINA SONAR SYSTEM MARKET BY APPLICATION (USD MILLIONS) 2020-2029
TABLE 56 CHINA SONAR SYSTEM MARKET BY APPLICATION (THOUSAND UNITS) 2020-2029
TABLE 57 CHINA SONAR SYSTEM MARKET BY PRODUCT TYPE (USD MILLIONS) 2020-2029
TABLE 58 CHINA SONAR SYSTEM MARKET BY PRODUCT TYPE (THOUSAND UNITS) 2020-2029
TABLE 59 CHINA SONAR SYSTEM MARKET BY END USER (USD MILLIONS) 2020-2029
TABLE 60 CHINA SONAR SYSTEM MARKET BY END USER (THOUSAND UNITS) 2020-2029
TABLE 61 JAPAN SONAR SYSTEM MARKET BY APPLICATION (USD MILLIONS) 2020-2029
TABLE 62 JAPAN SONAR SYSTEM MARKET BY APPLICATION (THOUSAND UNITS) 2020-2029
TABLE 63 JAPAN SONAR SYSTEM MARKET BY PRODUCT TYPE (USD MILLIONS) 2020-2029
TABLE 64 JAPAN SONAR SYSTEM MARKET BY PRODUCT TYPE (THOUSAND UNITS) 2020-2029
TABLE 65 JAPAN SONAR SYSTEM MARKET BY END USER (USD MILLIONS) 2020-2029
TABLE 66 JAPAN SONAR SYSTEM MARKET BY END USER (THOUSAND UNITS) 2020-2029
TABLE 67 SOUTH KOREA SONAR SYSTEM MARKET BY APPLICATION (USD MILLIONS) 2020-2029
TABLE 68 SOUTH KOREA SONAR SYSTEM MARKET BY APPLICATION (THOUSAND UNITS) 2020-2029
TABLE 69 SOUTH KOREA SONAR SYSTEM MARKET BY PRODUCT TYPE (USD MILLIONS) 2020-2029
TABLE 70 SOUTH KOREA SONAR SYSTEM MARKET BY PRODUCT TYPE (THOUSAND UNITS) 2020-2029
TABLE 71 SOUTH KOREA SONAR SYSTEM MARKET BY END USER (USD MILLIONS) 2020-2029
TABLE 72 SOUTH KOREA SONAR SYSTEM MARKET BY END USER (THOUSAND UNITS) 2020-2029
TABLE 73 AUSTRALIA SONAR SYSTEM MARKET BY APPLICATION (USD MILLIONS) 2020-2029
TABLE 74 AUSTRALIA SONAR SYSTEM MARKET BY APPLICATION (THOUSAND UNITS) 2020-2029
TABLE 75 AUSTRALIA SONAR SYSTEM MARKET BY PRODUCT TYPE (USD MILLIONS) 2020-2029
TABLE 76 AUSTRALIA SONAR SYSTEM MARKET BY PRODUCT TYPE (THOUSAND UNITS) 2020-2029
TABLE 77 AUSTRALIA SONAR SYSTEM MARKET BY END USER (USD MILLIONS) 2020-2029
TABLE 78 AUSTRALIA SONAR SYSTEM MARKET BY END USER (THOUSAND UNITS) 2020-2029
TABLE 79 SOUTH-EAST ASIA SONAR SYSTEM MARKET BY APPLICATION (USD MILLIONS) 2020-2029
TABLE 80 SOUTH-EAST ASIA SONAR SYSTEM MARKET BY APPLICATION (THOUSAND UNITS) 2020-2029
TABLE 81 SOUTH-EAST ASIA SONAR SYSTEM MARKET BY PRODUCT TYPE (USD MILLIONS) 2020-2029
TABLE 82 SOUTH-EAST ASIA SONAR SYSTEM MARKET BY PRODUCT TYPE (THOUSAND UNITS) 2020-2029
TABLE 83 SOUTH-EAST ASIA SONAR SYSTEM MARKET BY END USER (USD MILLIONS) 2020-2029
TABLE 84 SOUTH-EAST ASIA SONAR SYSTEM MARKET BY END USER (THOUSAND UNITS) 2020-2029
TABLE 85 REST OF ASIA PACIFIC SONAR SYSTEM MARKET BY APPLICATION (USD MILLIONS) 2020-2029
TABLE 86 REST OF ASIA PACIFIC SONAR SYSTEM MARKET BY APPLICATION (THOUSAND UNITS) 2020-2029
TABLE 87 REST OF ASIA PACIFIC SONAR SYSTEM MARKET BY PRODUCT TYPE (USD MILLIONS) 2020-2029
TABLE 88 REST OF ASIA PACIFIC SONAR SYSTEM MARKET BY PRODUCT TYPE (THOUSAND UNITS) 2020-2029
TABLE 89 REST OF ASIA PACIFIC SONAR SYSTEM MARKET BY END USER (USD MILLIONS) 2020-2029
TABLE 90 REST OF ASIA PACIFIC SONAR SYSTEM MARKET BY END USER (THOUSAND UNITS) 2020-2029
TABLE 91 GERMANY SONAR SYSTEM MARKET BY APPLICATION (USD MILLIONS) 2020-2029
TABLE 92 GERMANY SONAR SYSTEM MARKET BY APPLICATION (THOUSAND UNITS) 2020-2029
TABLE 93 GERMANY SONAR SYSTEM MARKET BY PRODUCT TYPE (USD MILLIONS) 2020-2029
TABLE 94 GERMANY SONAR SYSTEM MARKET BY PRODUCT TYPE (THOUSAND UNITS) 2020-2029
TABLE 95 GERMANY SONAR SYSTEM MARKET BY END USER (USD MILLIONS) 2020-2029
TABLE 96 GERMANY SONAR SYSTEM MARKET BY END USER (THOUSAND UNITS) 2020-2029
TABLE 97 UK SONAR SYSTEM MARKET BY APPLICATION (USD MILLIONS) 2020-2029
TABLE 98 UK SONAR SYSTEM MARKET BY APPLICATION (THOUSAND UNITS) 2020-2029
TABLE 99 UK SONAR SYSTEM MARKET BY PRODUCT TYPE (USD MILLIONS) 2020-2029
TABLE 100 UK SONAR SYSTEM MARKET BY PRODUCT TYPE (THOUSAND UNITS) 2020-2029
TABLE 101 UK SONAR SYSTEM MARKET BY END USER (USD MILLIONS) 2020-2029
TABLE 102 UK SONAR SYSTEM MARKET BY END USER (THOUSAND UNITS) 2020-2029
TABLE 103 FRANCE SONAR SYSTEM MARKET BY APPLICATION (USD MILLIONS) 2020-2029
TABLE 104 FRANCE SONAR SYSTEM MARKET BY APPLICATION (THOUSAND UNITS) 2020-2029
TABLE 105 FRANCE SONAR SYSTEM MARKET BY PRODUCT TYPE (USD MILLIONS) 2020-2029
TABLE 106 FRANCE SONAR SYSTEM MARKET BY PRODUCT TYPE (THOUSAND UNITS) 2020-2029
TABLE 107 FRANCE SONAR SYSTEM MARKET BY END USER (USD MILLIONS) 2020-2029
TABLE 108 FRANCE SONAR SYSTEM MARKET BY END USER (THOUSAND UNITS) 2020-2029
TABLE 109 ITALY SONAR SYSTEM MARKET BY APPLICATION (USD MILLIONS) 2020-2029
TABLE 110 ITALY SONAR SYSTEM MARKET BY APPLICATION (THOUSAND UNITS) 2020-2029
TABLE 111 ITALY SONAR SYSTEM MARKET BY PRODUCT TYPE (USD MILLIONS) 2020-2029
TABLE 112 ITALY SONAR SYSTEM MARKET BY PRODUCT TYPE (THOUSAND UNITS) 2020-2029
TABLE 113 ITALY SONAR SYSTEM MARKET BY END USER (USD MILLIONS) 2020-2029
TABLE 114 ITALY SONAR SYSTEM MARKET BY END USER (THOUSAND UNITS) 2020-2029
TABLE 115 SPAIN SONAR SYSTEM MARKET BY APPLICATION (USD MILLIONS) 2020-2029
TABLE 116 SPAIN SONAR SYSTEM MARKET BY APPLICATION (THOUSAND UNITS) 2020-2029
TABLE 117 SPAIN SONAR SYSTEM MARKET BY PRODUCT TYPE (USD MILLIONS) 2020-2029
TABLE 118 SPAIN SONAR SYSTEM MARKET BY PRODUCT TYPE (THOUSAND UNITS) 2020-2029
TABLE 119 SPAIN SONAR SYSTEM MARKET BY END USER (USD MILLIONS) 2020-2029
TABLE 120 SPAIN SONAR SYSTEM MARKET BY END USER (THOUSAND UNITS) 2020-2029
TABLE 121 RUSSIA SONAR SYSTEM MARKET BY APPLICATION (USD MILLIONS) 2020-2029
TABLE 122 RUSSIA SONAR SYSTEM MARKET BY APPLICATION (THOUSAND UNITS) 2020-2029
TABLE 123 RUSSIA SONAR SYSTEM MARKET BY PRODUCT TYPE (USD MILLIONS) 2020-2029
TABLE 124 RUSSIA SONAR SYSTEM MARKET BY PRODUCT TYPE (THOUSAND UNITS) 2020-2029
TABLE 125 RUSSIA SONAR SYSTEM MARKET BY END USER (USD MILLIONS) 2020-2029
TABLE 126 RUSSIA SONAR SYSTEM MARKET BY END USER (THOUSAND UNITS) 2020-2029
TABLE 127 REST OF EUROPE SONAR SYSTEM MARKET BY APPLICATION (USD MILLIONS) 2020-2029
TABLE 128 REST OF EUROPE SONAR SYSTEM MARKET BY APPLICATION (THOUSAND UNITS) 2020-2029
TABLE 129 REST OF EUROPE SONAR SYSTEM MARKET BY PRODUCT TYPE (USD MILLIONS) 2020-2029
TABLE 130 REST OF EUROPE SONAR SYSTEM MARKET BY PRODUCT TYPE (THOUSAND UNITS) 2020-2029
TABLE 131 REST OF EUROPE SONAR SYSTEM MARKET BY END USER (USD MILLIONS) 2020-2029
TABLE 132 REST OF EUROPE SONAR SYSTEM MARKET BY END USER (THOUSAND UNITS) 2020-2029
TABLE 133 UAE SONAR SYSTEM MARKET BY APPLICATION (USD MILLIONS) 2020-2029
TABLE 134 UAE SONAR SYSTEM MARKET BY APPLICATION (THOUSAND UNITS) 2020-2029
TABLE 135 UAE SONAR SYSTEM MARKET BY PRODUCT TYPE (USD MILLIONS) 2020-2029
TABLE 136 UAE SONAR SYSTEM MARKET BY PRODUCT TYPE (THOUSAND UNITS) 2020-2029
TABLE 137 UAE SONAR SYSTEM MARKET BY END USER (USD MILLIONS) 2020-2029
TABLE 138 UAE SONAR SYSTEM MARKET BY END USER (THOUSAND UNITS) 2020-2029
TABLE 139 SAUDI ARABIA SONAR SYSTEM MARKET BY APPLICATION (USD MILLIONS) 2020-2029
TABLE 140 SAUDI ARABIA SONAR SYSTEM MARKET BY APPLICATION (THOUSAND UNITS) 2020-2029
TABLE 141 SAUDI ARABIA SONAR SYSTEM MARKET BY PRODUCT TYPE (USD MILLIONS) 2020-2029
TABLE 142 SAUDI ARABIA SONAR SYSTEM MARKET BY PRODUCT TYPE (THOUSAND UNITS) 2020-2029
TABLE 143 SAUDI ARABIA SONAR SYSTEM MARKET BY END USER (USD MILLIONS) 2020-2029
TABLE 144 SAUDI ARABIA SONAR SYSTEM MARKET BY END USER (THOUSAND UNITS) 2020-2029
TABLE 145 SOUTH AFRICA SONAR SYSTEM MARKET BY APPLICATION (USD MILLIONS) 2020-2029
TABLE 146 SOUTH AFRICA SONAR SYSTEM MARKET BY APPLICATION (THOUSAND UNITS) 2020-2029
TABLE 147 SOUTH AFRICA SONAR SYSTEM MARKET BY PRODUCT TYPE (USD MILLIONS) 2020-2029
TABLE 148 SOUTH AFRICA SONAR SYSTEM MARKET BY PRODUCT TYPE (THOUSAND UNITS) 2020-2029
TABLE 149 SOUTH AFRICA SONAR SYSTEM MARKET BY END USER (USD MILLIONS) 2020-2029
TABLE 150 SOUTH AFRICA SONAR SYSTEM MARKET BY END USER (THOUSAND UNITS) 2020-2029
TABLE 151 REST OF MIDDLE EAST AND AFRICA SONAR SYSTEM MARKET BY APPLICATION (USD MILLIONS) 2020-2029
TABLE 152 REST OF MIDDLE EAST AND AFRICA SONAR SYSTEM MARKET BY APPLICATION (THOUSAND UNITS) 2020-2029
TABLE 153 REST OF MIDDLE EAST AND AFRICA SONAR SYSTEM MARKET BY PRODUCT TYPE (USD MILLIONS) 2020-2029
TABLE 154 REST OF MIDDLE EAST AND AFRICA SONAR SYSTEM MARKET BY PRODUCT TYPE (THOUSAND UNITS) 2020-2029
TABLE 155 REST OF MIDDLE EAST AND AFRICA SONAR SYSTEM MARKET BY END USER (USD MILLIONS) 2020-2029
TABLE 156 REST OF MIDDLE EAST AND AFRICA SONAR SYSTEM MARKET BY END USER (THOUSAND UNITS) 2020-2029
LIST OF FIGURES
FIGURE 1 MARKET DYNAMICS
FIGURE 2 MARKET SEGMENTATION
FIGURE 3 REPORT TIMELINES: YEARS CONSIDERED
FIGURE 4 DATA TRIANGULATION
FIGURE 5 BOTTOM-UP APPROACH
FIGURE 6 TOP-DOWN APPROACH
FIGURE 7 RESEARCH FLOW
FIGURE 8 GLOBAL SONAR SYSTEM MARKET BY PRODUCT TYPE, USD MILLION, 2020-2029
FIGURE 9 GLOBAL SONAR SYSTEM MARKET BY APPLICATION, USD MILLION, 2020-2029
FIGURE 10 GLOBAL SONAR SYSTEM MARKET BY END USER, USD MILLION, 2020-2029
FIGURE 11 GLOBAL SONAR SYSTEM MARKET BY REGION, USD MILLION, 2020-2029
FIGURE 12 PORTER’S FIVE FORCES MODEL
FIGURE 13 MARKET SHARE ANALYSIS
FIGURE 14 THALES GROUP: COMPANY SNAPSHOT
FIGURE 15 ATLAS ELECTRONIK GMBH: COMPANY SNAPSHOT
FIGURE 16 RAYTHEON COMPANY: COMPANY SNAPSHOT
FIGURE 17 LOCKHEED MARTIN: COMPANY SNAPSHOT
FIGURE 18 L-3 TECHNOLOGIES INC.: COMPANY SNAPSHOT
FIGURE 19 ULTRA ELECTRONICS: COMPANY SNAPSHOT
FIGURE 20 KONGSBERG GRUPPEN ASA: COMPANY SNAPSHOT
FIGURE 21 TELEDYNE TECHNOLOGIES INC.: COMPANY SNAPSHOT
FIGURE 22 SONARDYNE: COMPANY SNAPSHOT
FIGURE 23 FURUNO ELECTRIC CO. LTD.: COMPANY SNAPSHOT
FIGURE 24 JAPAN RADIO COMPANY: COMPANY SNAPSHOT
FIGURE 25 NAVICO: COMPANY SNAPSHOT
FIGURE 26 FLIR SYSTEMS: COMPANY SNAPSHOT
DOWNLOAD FREE SAMPLE REPORT
License Type
SPEAK WITH OUR ANALYST
Want to know more about the report or any specific requirement?
WANT TO CUSTOMIZE THE REPORT?
Our Clients Speak
We asked them to research ‘ Equipment market’ all over the world, and their whole arrangement was helpful to us. thehealthanalytics.com insightful analysis and reports contributed to our current analysis and in creating a future strategy. Besides, the te
Yosuke Mitsui
Senior Associate Construction Equipment Sales & Marketing
We asked them to research ‘Equipment market’ all over the world, and their whole arrangement was helpful to us. thehealthanalytics.com insightful analysis and reports contributed to our current analysis and in creating a future strategy. Besides, the te


