

Base Year Value ()
x.x %
x.x %
CAGR ()
x.x %
x.x %
Forecast Year Value ()
x.x %
x.x %
Historical Data Period
Largest Region
Forecast Period
Bioinformatics Market by Product & Service (Knowledge Management Tools, Bioinformatics Platforms, Data Analysis, Structural Analysis, Services), Applications (Genomics, Proteomics, Transcriptomic) and Region, Global trends and forecast from 2023 to 2030
Instant access to hundreds of data points and trends
- Market estimates from 2014-2029
- Competitive analysis, industry segmentation, financial benchmarks
- Incorporates SWOT, Porter's Five Forces and risk management frameworks
- PDF report or online database with Word, Excel and PowerPoint export options
- 100% money back guarantee
Bioinformatics Market Overview
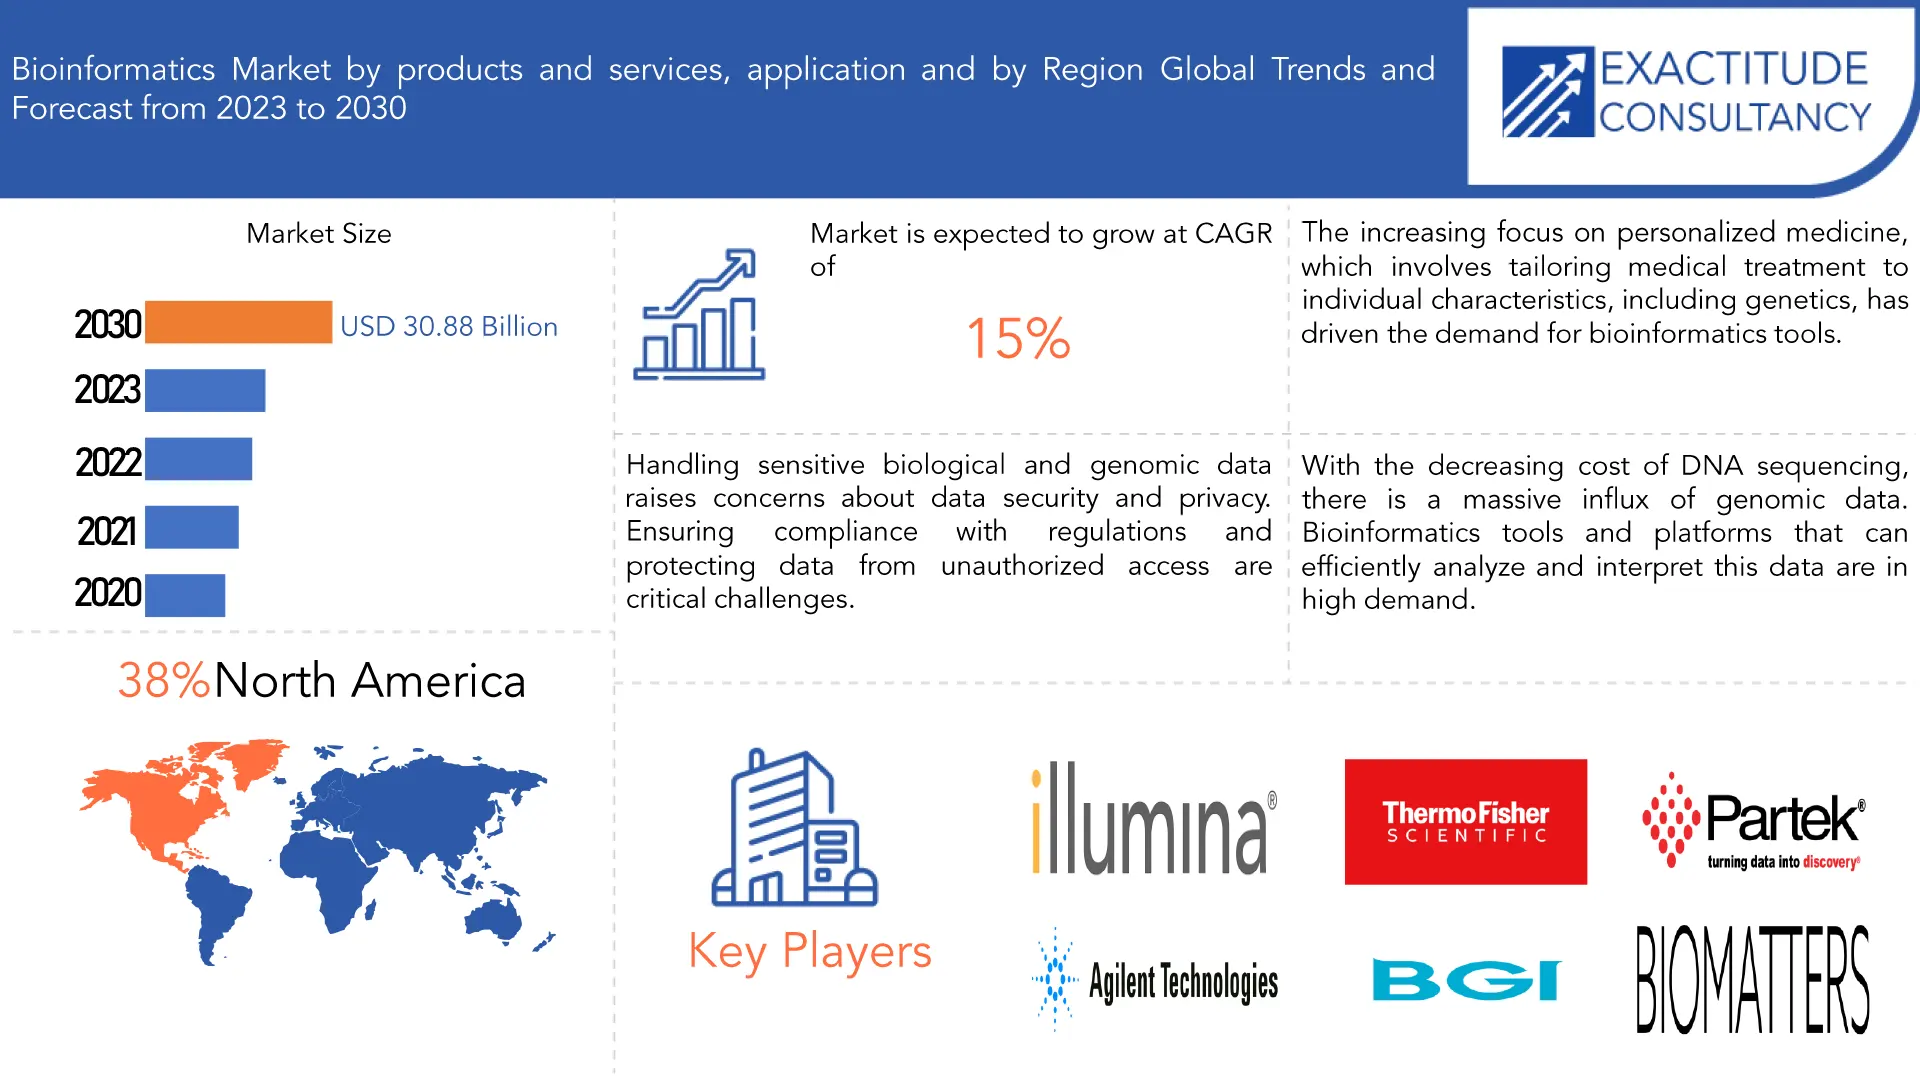
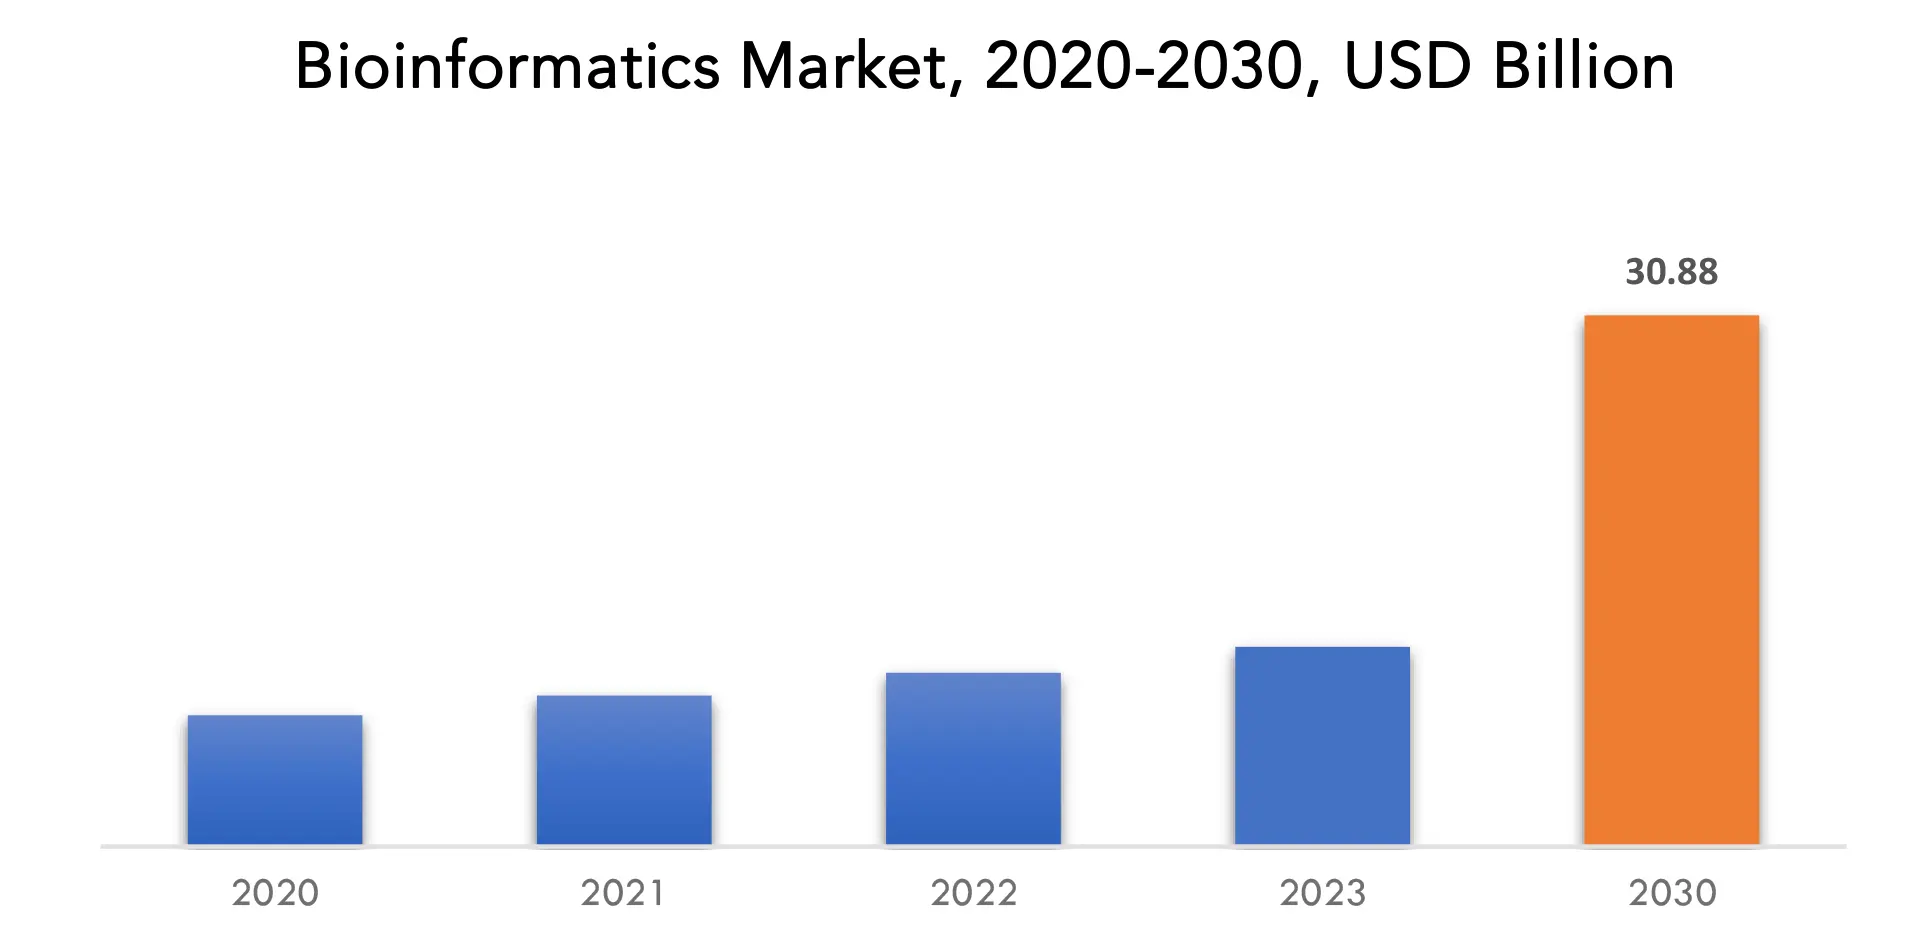
The global Bioinformatics market is anticipated to grow from USD 11.61 Billion in 2023 to USD 30.88 Billion by 2030, at a CAGR of 15 % during the forecast period.
The global bioinformatics market is poised for significant expansion in the foreseeable future, driven by escalating demand for integrated data solutions and heightened utilization of nucleic acid and protein sequencing, spurred by cost reductions in sequencing technologies. Additionally, the proliferation of applications in proteomics and genomics, coupled with initiatives spearheaded by both governmental and private entities, are anticipated to propel market growth during the forecast period.
Bioinformatics constitutes a multifaceted domain that employs computational and statistical methodologies to scrutinize and elucidate biological data, encompassing genomic sequences to protein configurations. It assumes a pivotal role in advancing biomedical research, drug discovery endeavors, personalized medicine initiatives, and agricultural pursuits by furnishing insights into intricate biological phenomena. The market has witnessed notable expansion, fueled by the exponential surge in biological data generated from high-throughput methodologies such as next-generation sequencing, microarray analysis, and mass spectrometry.
[caption id="attachment_34800" align="aligncenter" width="1920"]
A discernible trend in the bioinformatics arena is the ascending adoption of cloud-based solutions and software-as-a-service (SaaS) paradigms, aimed at mitigating scalability, flexibility, and accessibility challenges associated with managing vast biological datasets. Cloud-based bioinformatics platforms afford researchers seamless access to computational resources, storage infrastructure, and analytical tools on an on-demand basis, obviating the necessity for substantial upfront investments in hardware and software. Furthermore, cloud computing facilitates collaboration and data exchange among geographically dispersed research cohorts, fostering a climate of innovation and expediting the pace of scientific inquiry.
| ATTRIBUTE | DETAILS |
| Study period | 2020-2030 |
| Base year | 2022 |
| Estimated year | 2023 |
| Forecasted year | 2023-2030 |
| Historical period | 2019-2021 |
| Unit | Value (USD Billion) Volume (Thousand Units) |
| Segmentation | By Products and Services, Application and Region |
| By Products and Services |
|
| By Application |
|
|
By Region |
|
Frequently Asked Questions
• What is the worth of global Bioinformatics market?
Bioinformatics market size was valued at USD 10.4 billion in 2020 and is projected to reach USD 37.74 billion by 2029, growing at a CAGR of 15.4% from 2022 to 2029. Drug research and development, as well as government and private-sector activities, are likely to drive market expansion.
• What is the size of the North America Bioinformatics industry?
North America held more than 43% of the bioinformatics market revenue share in 2021 and will witness market expansion due to the increased healthcare spending and disposable income and emerging Bioinformatics market.
• What are the upcoming trends of Bioinformatics market, globally?
This industry is focused on improving facilities and expanding technology in order to provide better treatments.
• Which are the top companies to hold the market share in Bioinformatics market?
Agilent Technologies, Inc., Biomax Informatics AG, DNAnexus, Inc., Genedata AG, Intrexon Bioinformatics Germany GmbH, Illumina Inc., Perkinelmer Inc., Qiagen N.V. are dominating the market.
Bioinformatics Market Segmentation Analysis
The global Bioinformatics market is divided into three segments Product & Services, application and region. By Product & Services, it is divided as Knowledge Management Tools, Bioinformatics Platforms, Bioinformatics Services. A wide range of goods and services make up the bioinformatics market, all of which support the main objective of deriving valuable insights from biological data. Knowledge management tools, bioinformatics platforms, and bioinformatics services are included in this division. [caption id="attachment_34847" align="aligncenter" width="1920"]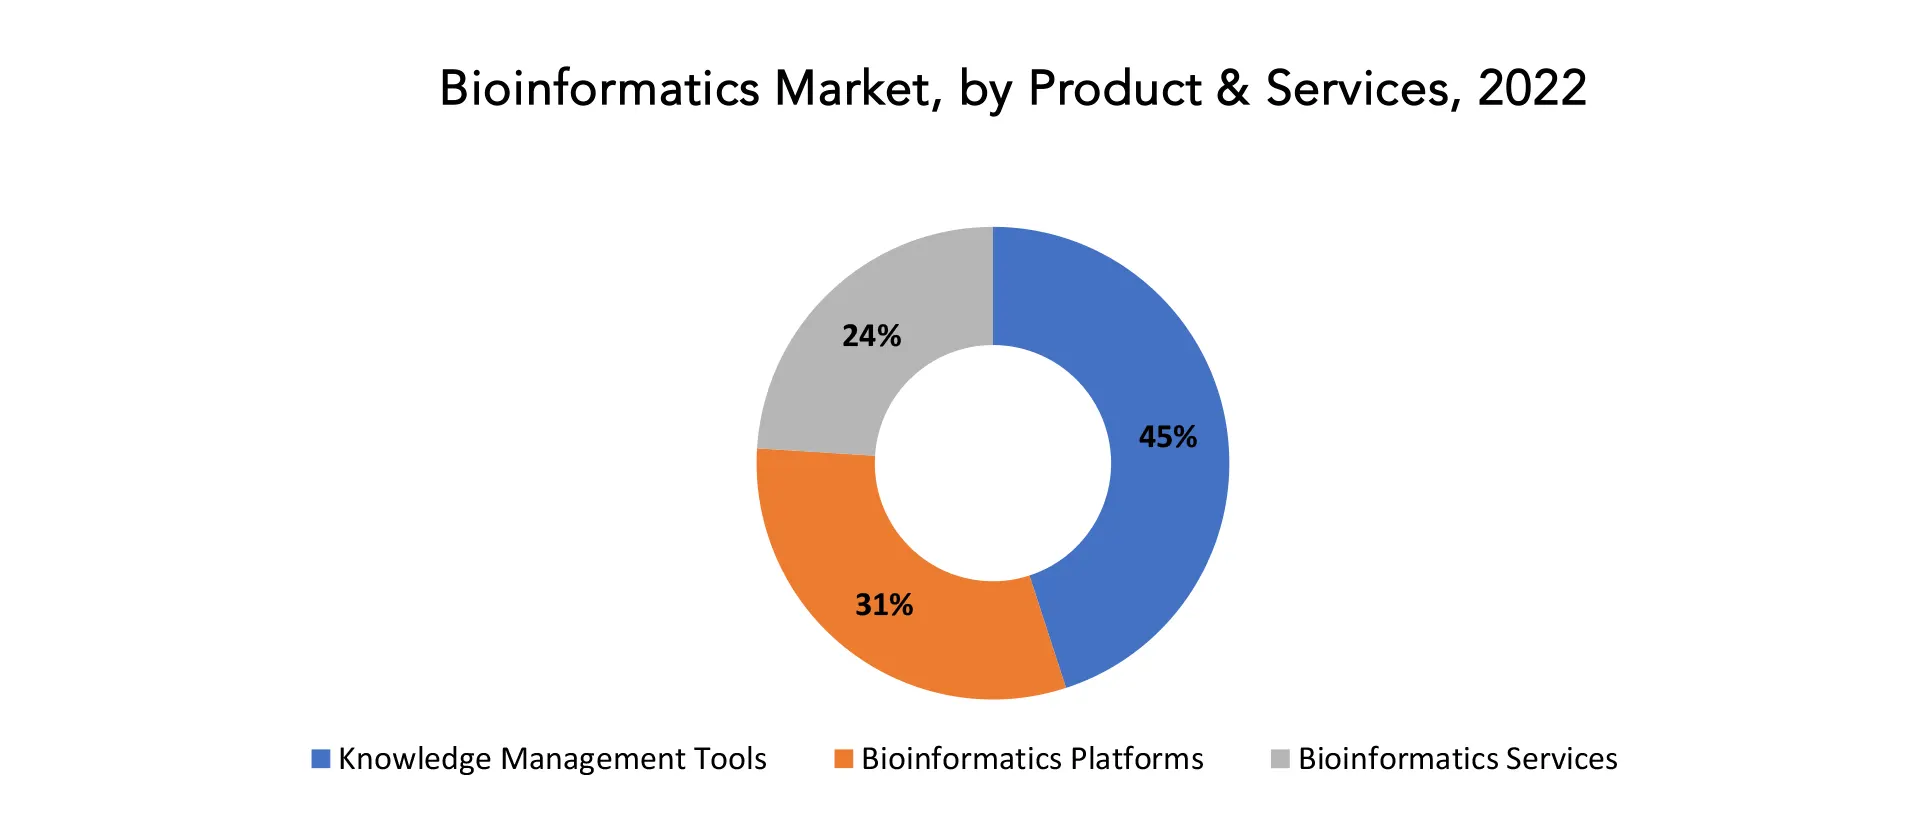
Competitive Landscape
The competitive landscape of the Bioinformatics market was dynamic, with several prominent companies competing to provide innovative and advanced Bioinformatics solutions.- Illumina, Inc.
- Thermo Fisher Scientific, Inc.
- Qiagen N.V.
- Agilent Technologies, Inc.
- Bio-Rad Laboratories, Inc.
- PerkinElmer, Inc.
- BGI Group
- Partek Inc.
- DNAnexus Inc.
- Genedata AG
- Sophia Genetics
- Seven Bridges Genomics
- BaseClear B.V.
- Eurofins Scientific
- Genomatix Software GmbH
- Biomatters Ltd.
- Broad Institute
- Genewiz, a Brooks Life Sciences Company
- Nonlinear Dynamics
- Swift Biosciences Inc.
Bioinformatics Market Dynamics
Driver The field of genomics has seen significant advancements, especially with the rise of next-generation sequencing (NGS) technologies. High-throughput sequencing is made possible by NGS technology, which allow millions of DNA fragments to be sequenced in simultaneously. When comparing this to conventional sequencing technologies, the rate at which genetic data is generated is accelerated dramatically. The cost of sequencing DNA per base pair has significantly decreased thanks to NGS, which has increased the viability of large-scale genomic studies. Because of this, sequencing technology are now more widely accessible, allowing a wider spectrum of academics and organizations to carry out genomic research. Whole genomes can be rapidly sequenced thanks to NGS. Large-scale genomic initiatives like the 1000 Genomes Project, which sequenced thousands of human genomes to produce an exhaustive map of genetic variation, have benefited greatly from this. NGS makes it possible to find many kinds of genomic variants, such as structural alterations, insertions, deletions, and single nucleotide polymorphisms (SNPs). Understanding the genetic foundation of diseases and individual variances requires this level of information. Sequencing genomic DNA is not the only application for NGS technology. They are also used to investigate transcriptome profiles (RNA sequencing) and epigenetic changes. This thorough method sheds light on the regulation and functionality of genes. In metagenomics, NGS is frequently used to examine the genetic makeup of whole microbial populations. Understanding the human microbiome, environmental ecology, and the function of microbes in health and illness are all impacted by this.Bioinformatics Market Trends
- One significant trend in healthcare is the use of genetics for applications related to customized medicine. In order to determine individual variations, forecast illness risks, and customize treatment regimens based on a patient's genetic profile, bioinformatics is essential to the analysis of genomic data.
- Bioinformatics technologies are increasingly integrating machine learning (ML) and artificial intelligence (AI). The efficiency and precision of biological and clinical interpretations are increased by these technologies, which also improve data processing, pattern recognition, and prediction capabilities.
- Bioinformatics is adopting cloud computing more and more because of its scalability, storage capacity, and collaboration characteristics. major genomic datasets may be shared and analyzed more easily thanks to cloud-based systems, which also give businesses and researchers access to computational resources without requiring major infrastructure investments.
- The field of metagenomics, which examines genetic material from environmental samples, and the study of the human microbiome have grown in popularity. In order to process and evaluate complicated metagenomic data and gain insights into human health, ecology, and disease, bioinformatics tools are essential.
- Novel approaches to comprehending cellular heterogeneity have been made possible by developments in single-cell sequencing technologies. Researchers can examine the variety of cell types and their roles in different biological systems by using bioinformatics techniques to analyze single-cell data.
- Data from several omics domains, such as proteomics, metabolomics, epigenomics, and genomics, are being integrated more and more using bioinformatics. This all-encompassing method offers a thorough comprehension of biological processes and helps in the development of more precise biomarkers and pharmaceuticals.
Key Takeaways:
- The global Bioinformatics market is anticipated to grow at a CAGR of 15 % during the forecast period.
- Based on products, the market is dominated by bioinformatics platforms.
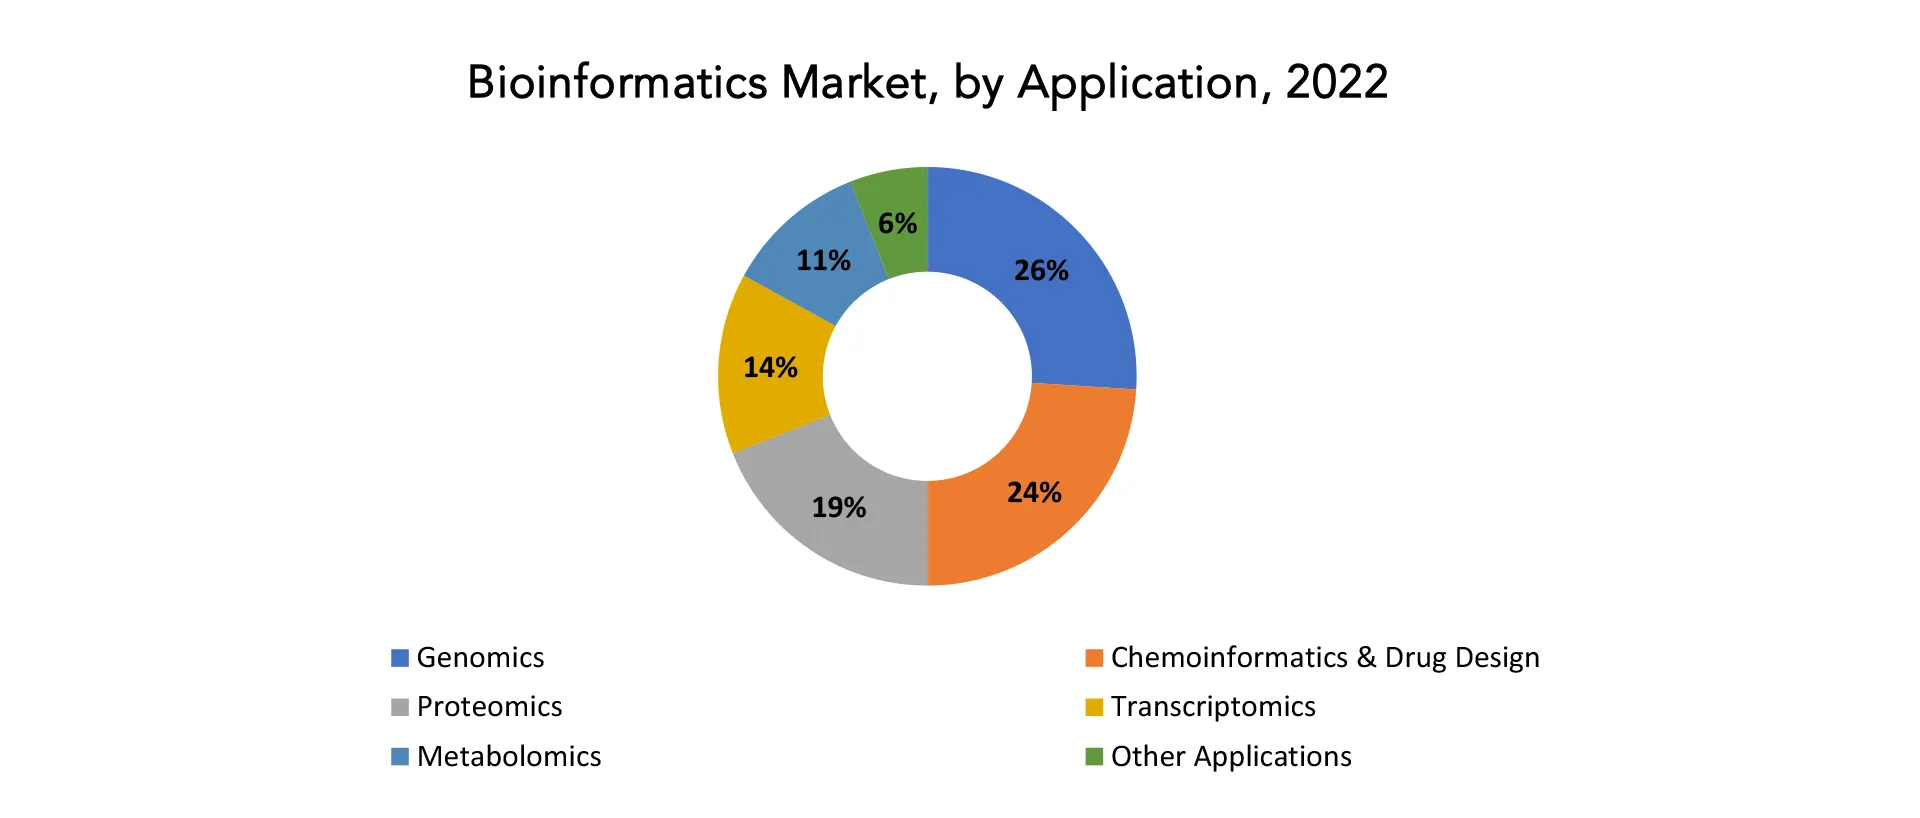
- Based on application, the market is dominated by chemoinformatics and drug designs.
- Based on regional share, the market is dominated by North America.
- The integration of artificial intelligence and machine learning techniques for enhanced data analysis and interpretation is a major trend in the bioinformatics market.
Regional Analysis
North America accounted for the largest market in the Bioinformatics market. North America accounted for 38% of the worldwide market value. One important area for the bioinformatics market's expansion and development has been North America. A number of variables, such as the region's sophisticated healthcare system, extensive R&D, and a strong concentration of biotechnology and pharmaceutical industries, contribute to its importance in bioinformatics. Academic and research organizations, along with private businesses, have been leading the way in the use of bioinformatics in the US and Canada. A large number of genetic research facilities and biotechnology hubs in the area actively use bioinformatics tools for proteomics, genomics, and other -omics data analysis. A thriving bioinformatics professional environment is facilitated by the existence of respected academic and medical institutions. Bioinformatics technologies for drug discovery and development have been widely used by the pharmaceutical and biotechnology sectors in North America. medication targets, medication interactions, and efficacy optimization have all benefited from bioinformatics' capacity to evaluate massive datasets, including genomic and clinical data. Pharmaceutical businesses and bioinformatics service providers are now working together more frequently as a result of this. A major emphasis on precision medicine also benefits the bioinformatics sector in North America. The practice of combining clinical and genetic data to create individualized treatment regimens has gained popularity as medical professionals realize more and more how bioinformatics may be used to customize care for specific patients. The expansion of bioinformatics solutions in clinical settings is being aided by this emphasis on precision medicine, which is in line with larger healthcare trends in North America. [caption id="attachment_34897" align="aligncenter" width="1920"]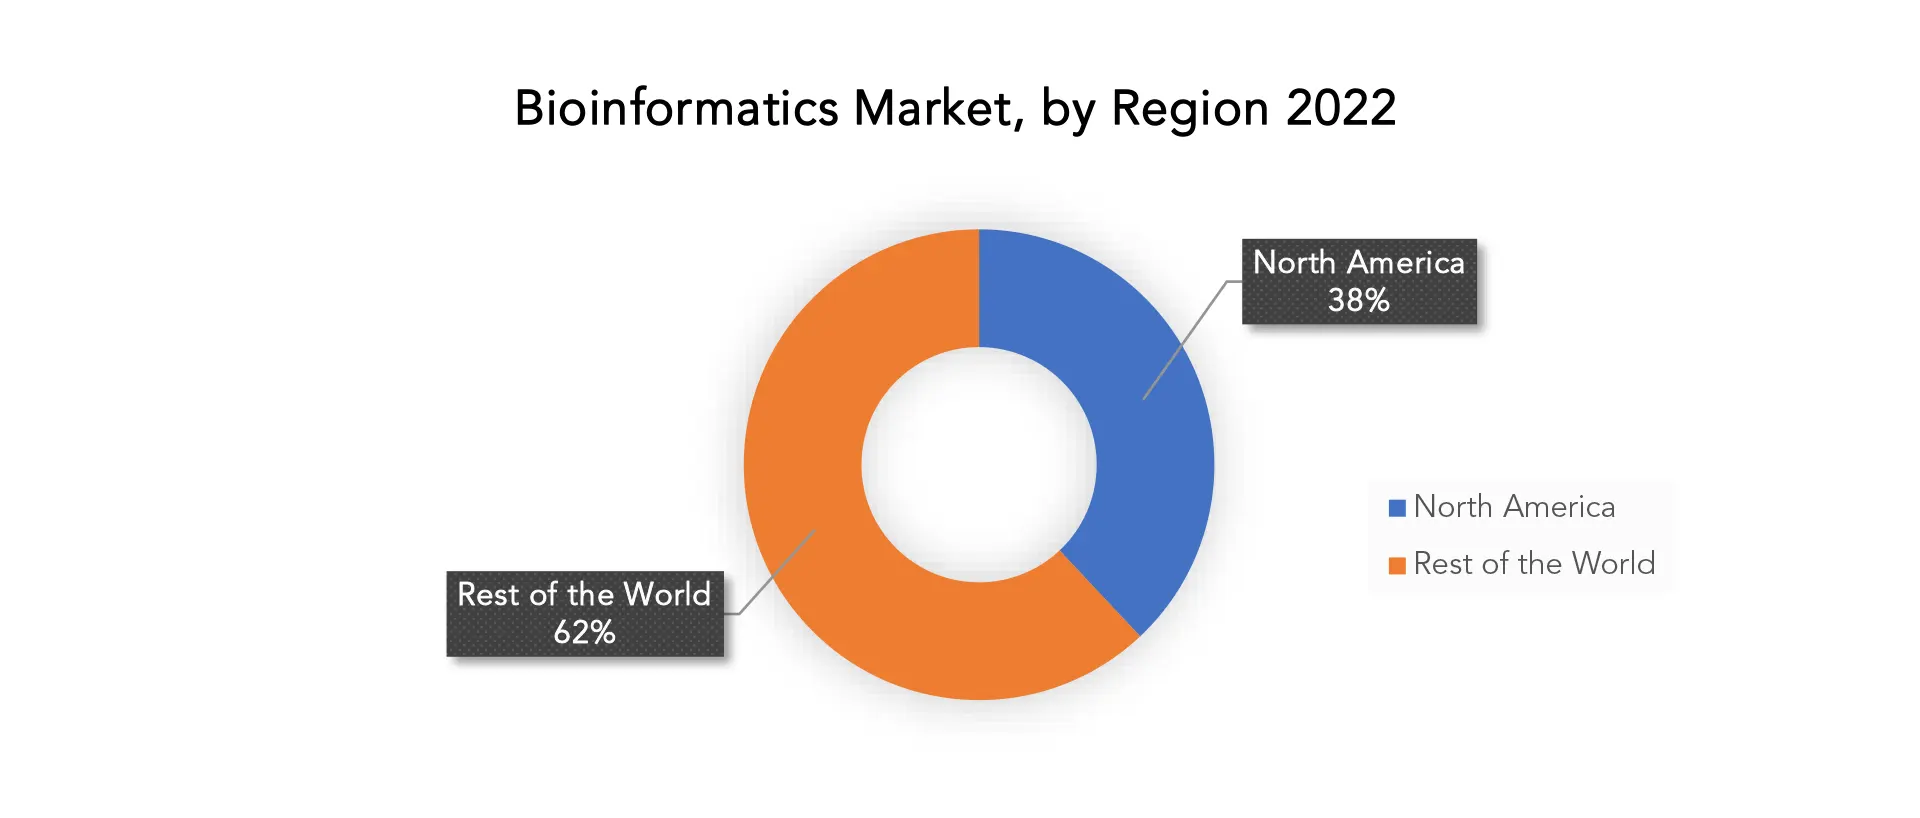
Target Audience for Bioinformatics Market
- Pharmaceutical Companies
- Biotechnology Companies
- Academic and Research Institutions
- Healthcare Providers
- Government and Regulatory Bodies
- Contract Research Organizations (CROs)
- Genomic Research Centers
- Diagnostic Laboratories
- Bioinformatics Service Providers
- IT and Software Companies
Import & Export Data for Bioinformatics Market
Exactitude consultancy provides import and export data for the recent years. It also offers insights on production and consumption volume of the product. Understanding the import and export data is pivotal for any player in the Bioinformatics market. This knowledge equips businesses with strategic advantages, such as:- Identifying emerging markets with untapped potential.
- Adapting supply chain strategies to optimize cost-efficiency and market responsiveness.
- Navigating competition by assessing major players' trade dynamics.
Key insights
- Trade volume trends: our report dissects import and export data spanning the last five years to reveal crucial trends and growth patterns within the global Bioinformatics market. This data-driven exploration empowers readers with a deep understanding of the market's trajectory.
- Market players: gain insights into the leading players driving the Bioinformatics trade. From established giants to emerging contenders, our analysis highlights the key contributors to the import and export landscape.
- Geographical dynamics: delve into the geographical distribution of trade activities. Uncover which regions dominate exports and which ones hold the reins on imports, painting a comprehensive picture of the industry's global footprint.
- Product breakdown: by segmenting data based on Bioinformatics types –– we provide a granular view of trade preferences and shifts, enabling businesses to align strategies with the evolving technological landscape.
Segments Covered in the Bioinformatics Market Report
Bioinformatics Market by Products and Services, 2020-2030, (USD Billion) (Thousand Units)- Knowledge Management Tools
- Bioinformatics Platforms
- Bioinformatics Services
- Genomics
- Chemoinformatic & Drug Design
- Proteomics
- Transcriptomics
- Metabolomics
- Other Applications
- North America
- Europe
- Asia Pacific
- South America
- Middle East and Africa
Key Question Answered
- What is the growth opportunities related to the adoption of bioinformatics across major regions in the future?
- What are the new trends and advancements in the bioinformatics market?
- Which product categories are expected to have the highest growth rate in the bioinformatics market?
- Which are the key factors driving the bioinformatics market?
- What will the market growth rate, growth momentum or acceleration the market carries during the forecast period?
- INTRODUCTION
- MARKET DEFINITION
- MARKET SEGMENTATION
- RESEARCH TIMELINES
- ASSUMPTIONS AND LIMITATIONS
- RESEARCH METHODOLOGY
- DATA MINING
- SECONDARY RESEARCH
- PRIMARY RESEARCH
- SUBJECT-MATTER EXPERTS’ ADVICE
- QUALITY CHECKS
- FINAL REVIEW
- DATA TRIANGULATION
- BOTTOM-UP APPROACH
- TOP-DOWN APPROACH
- RESEARCH FLOW
- DATA SOURCES
- DATA MINING
- EXECUTIVE SUMMARY
- MARKET OVERVIEW
- GLOBAL BIOINFORMATICS MARKET OUTLOOK
- MARKET DRIVERS
- MARKET RESTRAINTS
- MARKET OPPORTUNITIES
- IMPACT OF COVID-19 ON GLOBAL BIOINFORMATICS MARKET
- GLOBAL BIOINFORMATICS MARKET OUTLOOK
- GLOBAL BIOINFORMATICS MARKET BY TECHNOLOGY & SERVICES, (USD MILLION)
- KNOWLEDGE MANAGEMENT TOOLS
- BIOINFORMATICS PLATFORMS
- BIOINFORMATICS SERVICES
- GLOBAL BIOINFORMATICS MARKET BY SECTOR, (USD MILLION)
- MEDICAL BIOINFORMATICS
- ANIMAL BIOINFORMATICS
- AGRICULTURE BIOINFORMATICS
- ACADEMICS
- GLOBAL BIOINFORMATICS MARKET BY APPLICATION, (USD MILLION)
- METABOLOMICS
- MOLECULAR PHYLOGENETICS
- TRANSCRIPTOMICS
- PROTEOMICS
- CHEMOINFORMATIC
- GENOMICS
- GLOBAL BIOINFORMATICS MARKET BY REGION, (USD MILLION)
- INTRODUCTION
- ASIA-PACIFIC
- CHINA
- INDIA
- JAPAN
- SOUTH KOREA
- AUSTRALIA
- SOUTH-EAST ASIA
- REST OF ASIA-PACIFIC
- NORTH AMERICA
- UNITED STATES
- CANADA
- MEXICO
- EUROPE
- GERMANY
- UNITED KINGDOM
- FRANCE
- ITALY
- SPAIN
- RUSSIA
- REST OF EUROPE
- SOUTH AMERICA
- BRAZIL
- ARGENTINA
- COLOMBIA
- REST OF SOUTH AMERICA
- MIDDLE EAST AND AFRICA
- UAE
- SAUDI ARABIA
- SOUTH AFRICA
- REST OF MIDDLE EAST AND AFRICA
- COMPANY PROFILES* (BUSINESS OVERVIEW, COMPANY SNAPSHOT, PRODUCTS OFFERED, RECENT DEVELOPMENTS)
- AGILENT TECHNOLOGIES, INC.
- BIOMAX INFORMATICS AG
- DNANEXUS, INC.
- GENEDATA AG
- INTREXON BIOINFORMATICS GERMANY GMBH
- ILLUMINA INC.
- PERKINELMER INC.
- QIAGEN N.V.,
- SEVEN BRIDGES GENOMICS INC.
- THERMO FISHER SCIENTIFIC, INC
- OTHERS *THE COMPANY LIST IS INDICATIVE
LIST OF TABLES
TABLE 1 GLOBAL BIOINFORMATICS MARKET BY TECHNOLOGY & SERVICES (USD MILLIONS) 2020-2029
TABLE 2 GLOBAL BIOINFORMATICS MARKET BY SECTOR (USD MILLIONS) 2020-2029
TABLE 3 GLOBAL BIOINFORMATICS MARKET BY APPLICATION (USD MILLIONS) 2020-2029
TABLE 4 GLOBAL BIOINFORMATICS MARKET BY REGION (USD MILLIONS) 2020-2029
TABLE 5 US BIOINFORMATICS MARKET BY TECHNOLOGY & SERVICES (USD MILLIONS) 2020-2029
TABLE 6 US BIOINFORMATICS MARKET BY SECTOR (USD MILLIONS) 2020-2029
TABLE 7 US BIOINFORMATICS MARKET BY APPLICATION (USD MILLIONS) 2020-2029
TABLE 8 CANADA BIOINFORMATICS MARKET BY TECHNOLOGY & SERVICES (USD MILLIONS) 2020-2029
TABLE 9 CANADA BIOINFORMATICS MARKET BY SECTOR (USD MILLIONS) 2020-2029
TABLE 10 CANADA BIOINFORMATICS MARKET BY APPLICATION (USD MILLIONS) 2020-2029
TABLE 11 MEXICO BIOINFORMATICS MARKET BY TECHNOLOGY & SERVICES (USD MILLIONS) 2020-2029
TABLE 12 MEXICO BIOINFORMATICS MARKET BY SECTOR (USD MILLIONS) 2020-2029
TABLE 13 MEXICO BIOINFORMATICS MARKET BY APPLICATION (USD MILLIONS) 2020-2029
TABLE 14 BRAZIL BIOINFORMATICS MARKET BY TECHNOLOGY & SERVICES (USD MILLIONS) 2020-2029
TABLE 15 BRAZIL BIOINFORMATICS MARKET BY SECTOR (USD MILLIONS) 2020-2029
TABLE 16 BRAZIL BIOINFORMATICS MARKET BY APPLICATION (USD MILLIONS) 2020-2029
TABLE 17 ARGENTINA BIOINFORMATICS MARKET BY TECHNOLOGY & SERVICES (USD MILLIONS) 2020-2029
TABLE 18 ARGENTINA BIOINFORMATICS MARKET BY SECTOR (USD MILLIONS) 2020-2029
TABLE 19 ARGENTINA BIOINFORMATICS MARKET BY APPLICATION (USD MILLIONS) 2020-2029
TABLE 20 COLOMBIA BIOINFORMATICS MARKET BY TECHNOLOGY & SERVICES (USD MILLIONS) 2020-2029
TABLE 21 COLOMBIA BIOINFORMATICS MARKET BY SECTOR (USD MILLIONS) 2020-2029
TABLE 22 COLOMBIA BIOINFORMATICS MARKET BY APPLICATION (USD MILLIONS) 2020-2029
TABLE 23 REST OF SOUTH AMERICA BIOINFORMATICS MARKET BY TECHNOLOGY & SERVICES (USD MILLIONS) 2020-2029
TABLE 24 REST OF SOUTH AMERICA BIOINFORMATICS MARKET BY SECTOR (USD MILLIONS) 2020-2029
TABLE 25 REST OF SOUTH AMERICA BIOINFORMATICS MARKET BY APPLICATION (USD MILLIONS) 2020-2029
TABLE 26 INDIA BIOINFORMATICS MARKET BY TECHNOLOGY & SERVICES (USD MILLIONS) 2020-2029
TABLE 27 INDIA BIOINFORMATICS MARKET BY SECTOR (USD MILLIONS) 2020-2029
TABLE 28 INDIA BIOINFORMATICS MARKET BY APPLICATION (USD MILLIONS) 2020-2029
TABLE 29 CHINA BIOINFORMATICS MARKET BY TECHNOLOGY & SERVICES (USD MILLIONS) 2020-2029
TABLE 30 CHINA BIOINFORMATICS MARKET BY SECTOR (USD MILLIONS) 2020-2029
TABLE 31 CHINA BIOINFORMATICS MARKET BY APPLICATION (USD MILLIONS) 2020-2029
TABLE 32 JAPAN BIOINFORMATICS MARKET BY TECHNOLOGY & SERVICES (USD MILLIONS) 2020-2029
TABLE 33 JAPAN BIOINFORMATICS MARKET BY SECTOR (USD MILLIONS) 2020-2029
TABLE 34 JAPAN BIOINFORMATICS MARKET BY APPLICATION (USD MILLIONS) 2020-2029
TABLE 35 SOUTH KOREA BIOINFORMATICS MARKET BY TECHNOLOGY & SERVICES (USD MILLIONS) 2020-2029
TABLE 36 SOUTH KOREA BIOINFORMATICS MARKET BY SECTOR (USD MILLIONS) 2020-2029
TABLE 37 SOUTH KOREA BIOINFORMATICS MARKET BY APPLICATION (USD MILLIONS) 2020-2029
TABLE 38 AUSTRALIA BIOINFORMATICS MARKET BY TECHNOLOGY & SERVICES (USD MILLIONS) 2020-2029
TABLE 39 AUSTRALIA BIOINFORMATICS MARKET BY SECTOR (USD MILLIONS) 2020-2029
TABLE 40 AUSTRALIA BIOINFORMATICS MARKET BY APPLICATION (USD MILLIONS) 2020-2029
TABLE 41 SOUTH-EAST ASIA BIOINFORMATICS MARKET BY TECHNOLOGY & SERVICES (USD MILLIONS) 2020-2029
TABLE 42 SOUTH-EAST ASIA BIOINFORMATICS MARKET BY SECTOR (USD MILLIONS) 2020-2029
TABLE 43 SOUTH-EAST ASIA BIOINFORMATICS MARKET BY APPLICATION (USD MILLIONS) 2020-2029
TABLE 44 REST OF ASIA PACIFIC BIOINFORMATICS MARKET BY TECHNOLOGY & SERVICES (USD MILLIONS) 2020-2029
TABLE 45 REST OF ASIA PACIFIC BIOINFORMATICS MARKET BY SECTOR (USD MILLIONS) 2020-2029
TABLE 46 REST OF ASIA PACIFIC BIOINFORMATICS MARKET BY APPLICATION (USD MILLIONS) 2020-2029
TABLE 47 GERMANY BIOINFORMATICS MARKET BY TECHNOLOGY & SERVICES (USD MILLIONS) 2020-2029
TABLE 48 GERMANY BIOINFORMATICS MARKET BY SECTOR (USD MILLIONS) 2020-2029
TABLE 49 GERMANY BIOINFORMATICS MARKET BY APPLICATION (USD MILLIONS) 2020-2029
TABLE 50 UK BIOINFORMATICS MARKET BY TECHNOLOGY & SERVICES (USD MILLIONS) 2020-2029
TABLE 51 UK BIOINFORMATICS MARKET BY SECTOR (USD MILLIONS) 2020-2029
TABLE 52 UK BIOINFORMATICS MARKET BY APPLICATION (USD MILLIONS) 2020-2029
TABLE 53 FRANCE BIOINFORMATICS MARKET BY TECHNOLOGY & SERVICES (USD MILLIONS) 2020-2029
TABLE 54 FRANCE BIOINFORMATICS MARKET BY SECTOR (USD MILLIONS) 2020-2029
TABLE 55 FRANCE BIOINFORMATICS MARKET BY APPLICATION (USD MILLIONS) 2020-2029
TABLE 56 ITALY BIOINFORMATICS MARKET BY TECHNOLOGY & SERVICES (USD MILLIONS) 2020-2029
TABLE 57 ITALY BIOINFORMATICS MARKET BY SECTOR (USD MILLIONS) 2020-2029
TABLE 58 ITALY BIOINFORMATICS MARKET BY APPLICATION (USD MILLIONS) 2020-2029
TABLE 59 SPAIN BIOINFORMATICS MARKET BY TECHNOLOGY & SERVICES (USD MILLIONS) 2020-2029
TABLE 60 SPAIN BIOINFORMATICS MARKET BY SECTOR (USD MILLIONS) 2020-2029
TABLE 61 SPAIN BIOINFORMATICS MARKET BY APPLICATION (USD MILLIONS) 2020-2029
TABLE 62 RUSSIA BIOINFORMATICS MARKET BY TECHNOLOGY & SERVICES (USD MILLIONS) 2020-2029
TABLE 63 RUSSIA BIOINFORMATICS MARKET BY SECTOR (USD MILLIONS) 2020-2029
TABLE 64 RUSSIA BIOINFORMATICS MARKET BY APPLICATION (USD MILLIONS) 2020-2029
TABLE 65 REST OF EUROPE BIOINFORMATICS MARKET BY TECHNOLOGY & SERVICES (USD MILLIONS) 2020-2029
TABLE 66 REST OF EUROPE BIOINFORMATICS MARKET BY SECTOR (USD MILLIONS) 2020-2029
TABLE 67 REST OF EUROPE BIOINFORMATICS MARKET BY APPLICATION (USD MILLIONS) 2020-2029
TABLE 68 UAE BIOINFORMATICS MARKET BY TECHNOLOGY & SERVICES (USD MILLIONS) 2020-2029
TABLE 69 UAE BIOINFORMATICS MARKET BY SECTOR (USD MILLIONS) 2020-2029
TABLE 70 UAE BIOINFORMATICS MARKET BY APPLICATION (USD MILLIONS) 2020-2029
TABLE 71 SAUDI ARABIA BIOINFORMATICS MARKET BY TECHNOLOGY & SERVICES (USD MILLIONS) 2020-2029
TABLE 72 SAUDI ARABIA BIOINFORMATICS MARKET BY SECTOR (USD MILLIONS) 2020-2029
TABLE 73 SAUDI ARABIA BIOINFORMATICS MARKET BY APPLICATION (USD MILLIONS) 2020-2029
TABLE 74 SOUTH AFRICA BIOINFORMATICS MARKET BY TECHNOLOGY & SERVICES (USD MILLIONS) 2020-2029
TABLE 75 SOUTH AFRICA BIOINFORMATICS MARKET BY SECTOR (USD MILLIONS) 2020-2029
TABLE 76 SOUTH AFRICA BIOINFORMATICS MARKET BY APPLICATION (USD MILLIONS) 2020-2029
TABLE 77 REST OF MIDDLE EAST AND AFRICA BIOINFORMATICS MARKET BY TECHNOLOGY & SERVICES (USD MILLIONS) 2020-2029
TABLE 78 REST OF MIDDLE EAST AND AFRICA BIOINFORMATICS MARKET BY SECTOR (USD MILLIONS) 2020-2029
TABLE 79 REST OF MIDDLE EAST AND AFRICA BIOINFORMATICS MARKET BY APPLICATION (USD MILLIONS) 2020-2029
LIST OF FIGURES
FIGURE 1 MARKET DYNAMICS
FIGURE 2 MARKET SEGMENTATION
FIGURE 3 REPORT TIMELINES: YEARS CONSIDERED
FIGURE 4 DATA TRIANGULATION
FIGURE 5 BOTTOM-UP APPROACH
FIGURE 6 TOP-DOWN APPROACH
FIGURE 7 RESEARCH FLOW
FIGURE 8 GLOBAL BIOINFORMATICS MARKETBY TECHNOLOGY & SERVICES, USD MILLION, 2020-2029
FIGURE 10 GLOBAL BIOINFORMATICS MARKETBY SECTOR, USD MILLION, 2020-2029
FIGURE 11 GLOBAL BIOINFORMATICS MARKETBY APPLICATION, USD MILLION, 2020-2029
FIGURE 12 GLOBAL BIOINFORMATICS MARKETBY REGION, USD MILLION, 2020-2029
FIGURE 13 PORTER’S FIVE FORCES MODEL
FIGURE 14 GLOBAL BIOINFORMATICS MARKETBY TECHNOLOGY & SERVICES, 2020
FIGURE 15 GLOBAL BIOINFORMATICS MARKETBY SECTOR 2020
FIGURE 16 GLOBAL BIOINFORMATICS MARKETBY APPLICATION 2020
FIGURE 17 BIOINFORMATICS MARKETBY REGION 2020
FIGURE 18 MARKET SHARE ANALYSIS
FIGURE 19 AGILENT TECHNOLOGIES, INC.: COMPANY SNAPSHOT
FIGURE 20 BIOMAX INFORMATICS AG: COMPANY SNAPSHOT
FIGURE 21 DNANEXUS, INC.: COMPANY SNAPSHOT
FIGURE 22 GENEDATA AG: COMPANY SNAPSHOT
FIGURE 23 INTREXON BIOINFORMATICS GERMANY GMBH: COMPANY SNAPSHOT
FIGURE 24 ILLUMINA INC.: COMPANY SNAPSHOT
FIGURE 25 PERKINELMER INC.: COMPANY SNAPSHOT
FIGURE 26 QIAGEN N.V.: COMPANY SNAPSHOT
FIGURE 27 SEVEN BRIDGES GENOMICS INC.: COMPANY SNAPSHOT
FIGURE 28 THERMO FISHER SCIENTIFIC, INC: COMPANY SNAPSHOT
DOWNLOAD FREE SAMPLE REPORT
License Type
SPEAK WITH OUR ANALYST
Want to know more about the report or any specific requirement?
WANT TO CUSTOMIZE THE REPORT?
Our Clients Speak
We asked them to research ‘ Equipment market’ all over the world, and their whole arrangement was helpful to us. thehealthanalytics.com insightful analysis and reports contributed to our current analysis and in creating a future strategy. Besides, the te
Yosuke Mitsui
Senior Associate Construction Equipment Sales & Marketing
We asked them to research ‘Equipment market’ all over the world, and their whole arrangement was helpful to us. thehealthanalytics.com insightful analysis and reports contributed to our current analysis and in creating a future strategy. Besides, the te


