

Base Year Value ()
x.x %
x.x %
CAGR ()
x.x %
x.x %
Forecast Year Value ()
x.x %
x.x %
Historical Data Period
Largest Region
Forecast Period
Ceramic Balls Market by Material (Silicon, Alumina, Zirconia, Others), Function (Inert, Active), Application (Bearing, Grinding, Valve, Others), End-User (Automotive, Chemical, Aerospace, Others) and Region (North America, Europe, Asia Pacific, South America, Middle East and Africa), Global trends and forecast from 2022 to 2029
Instant access to hundreds of data points and trends
- Market estimates from 2014-2029
- Competitive analysis, industry segmentation, financial benchmarks
- Incorporates SWOT, Porter's Five Forces and risk management frameworks
- PDF report or online database with Word, Excel and PowerPoint export options
- 100% money back guarantee
Ceramic Balls Market Overview
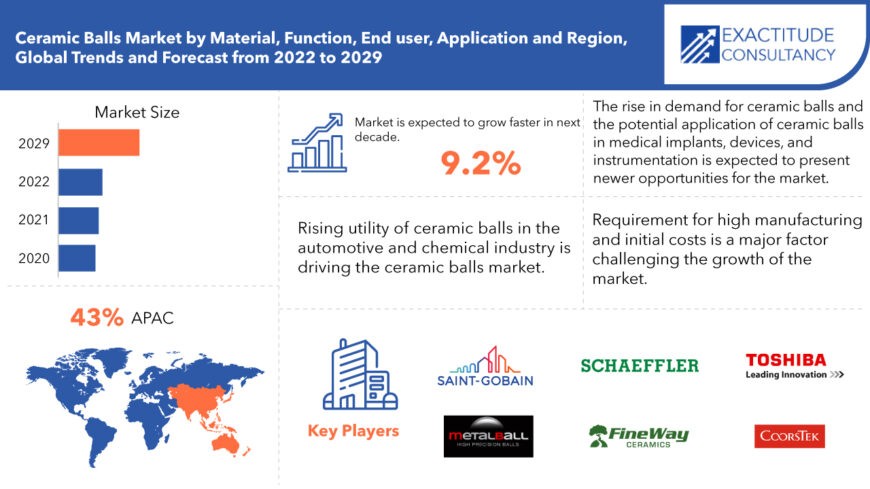
The global ceramic balls market is expected to grow at 9.2% CAGR from 2022 to 2029. It is expected to reach above USD 1.28 billion by 2029 from USD 0.58 billion in 2020.
Ceramic Ball is a rolling object, spherical in shape, these are made from variant ceramic material. These balls offer high stiffness, higher electric resistance, lower thermal expansion, less requirement of lubrication, lightweight, increased corrosion resistance than steel balls. They are manufactured ceramic powder binder mixtures such as alumina, zirconia, silicon in a spherical shape by pressing, lapping, and precision. Many of these are used for bearing purposes such as ceramic aerospace bearing, agitator balls, automotive bearing, conveyor ball, and spring-loaded balls, and other uses such as level sensing, flow metering, alignment, pumps, valves, and vapor control system. Ceramic balls are used as absorbent bed support media and catalyst in applications including gas processing, petrochemical, and refining processes. Higher crush strength, survivability, and impact-resistant property of these products are likely to ascend its demand in the above-stated application industries in the estimated time. The potential in emerging ceramic balls market along with collaborative research activities for product development are estimated to generate numerous opportunities for the ceramic balls market. On the flip side, the strict regulations on the manufacturing process due to health and environmental impacts is projected to pose as a major challenge to the growth of the ceramic balls market.
| ATTRIBUTE | DETAILS |
| Study period | 2020-2029 |
| Base year | 2021 |
| Estimated year | 2022 |
| Forecasted year | 2022-2029 |
| Historical period | 2018-2020 |
| Unit | Value (USD Billion) |
| Segmentation | By Material, By Function, By Application, By End User, By Region |
| By Material |
|
| By Function |
|
| By Application |
|
| By End User |
|
| By Region |
|
The factors such as rising utility of ceramic balls in the automotive and chemical industry are the root cause fueling up the market growth rate. The factors expected to cushion the growth of the ceramic balls market in the forecast period are the benefits associated with the properties of ceramic balls and capability of substituting steel balls. Moreover, its widespread usage in various end-use industries such as automotive, chemical, and aerospace are further expected to cushion the overall markets growth. On the other hand, the factors such as high cost of production are expected to impede the growth of the ceramic balls market. The volatile raw material prices coupled with the stringent regulatory scenario are also projected to hamper market’s overall growth.
The global ceramic balls market is anticipated to grow at a significant rate over the forecast period on account of its increasing demand from modern machinery manufacturing applications. Benefits offered by these products such as high strength, corrosion resistance, high-temperature resistance, reduced weight, increased operation speed, and minimum noise are likely to be the key factors driving the demand for manufacturing applications. Ceramic balls also possess lightweight properties that are essential factors for the latest technology manufacturing processes in automobile and aerospace industries. Moreover, manufacturers’ shifting preferences from steel balls towards ceramic balls owing to its benefits are anticipated to drive its demand over the forecast period. Higher demand for lightweight electric vehicles is likely to contribute to the ascending demand for the products.
[caption id="attachment_9730" align="aligncenter" width="870"]
Frequently Asked Questions
• What is the worth of global ceramic balls market?
The ceramic balls market size had crossed USD 0.58 billion in 2020 and will observe a CAGR of more than 9.2% up to 2029 driven by the rising utility of ceramic balls in the automotive and chemical industry.
• What is the size of the Asia-Pacific ceramic balls industry?
Asia-Pacific held more than 43% of the ceramic balls market revenue share in 2020 due to the rapid growth in industrialization and manufacturing activities, with both chemical and automotive industries poised to grow at a stable pace, further increasing market growth.
• What are the upcoming trends of ceramic balls market, globally?
The upcoming trends in ceramic balls market is the rise in demand for ceramic balls in emerging countries and the potential application of ceramic balls in medical implants, devices, and instrumentation.
• What is the CAGR of ceramic balls market?
The global ceramic balls market registered a CAGR of 9.2% from 2022 to 2029. The silicon segment was the highest revenue contributor to the market, with 0.15 billion in 2020, and is estimated to reach 0.29 billion by 2029, with a CAGR of 8%.
• Which are the top companies to hold the market share in ceramic balls market?
Key players profiled in the report include Amatsuji Steel Ball Mfg. Co. Ltd., Compagnie de Saint-Gobain SA, CoorsTek Inc., Fineway Inc., Industrial Tectonics Inc., Metalball SAS, Schaeffler AG, Spheric Trafalgar Ltd., Toshiba Materials Co. Ltd., and Tsubaki Nakashima Co. Ltd.
• What is the leading application of ceramic balls market?
Leading application of ceramic balls market are Automotive. Automotive applications are anticipated to drive the demand for ceramic balls on account of its advantageous applications in roller bearings, ball bearings, spark plugs, airbags, seat slides, valve, engine components, and locking mechanisms.
• Which is the largest regional market for ceramic balls market?
Asia-Pacific is expected to hold the largest market share in terms of revenue, during the forecast period. The growth is attributed to rapid growth in industrialization and manufacturing activities, with both chemical and automotive industries poised to grow at a stable pace, further increasing market growth.
Ceramic Balls Market Segment Analysis
The global Ceramic balls market is segmented based on material, function, application, end user and region. Based on material, the ceramic balls market is segmented into silicon, alumina, zirconia, others. Silicon-based ceramic balls are likely to drive the demand on account of its superior resistance to corrosion and extremely high temperatures. These are electrically insulated, anti-magnetic and can perform efficiently in extreme working conditions. The silicon-Based segment dominated the market in 2019. Alumina-based is normally used for active ceramic balls which are more resistant to wear and tear water, swelling powdering, and cracking but have a higher cost than the Silicon-based inert ceramic balls. Zirconia base is a good alternative for Alumina-based ones but has a higher cost.
Based on function, the ceramic balls market is segmented into inert, active. Inert ceramic balls are widely used in application industries such as chemical engineering, petroleum, natural gas, fertilizer production, and others. Inert Ceramic Balls dominated the global market in 2019 and is expected to continue the trend in the forecast period. Asia Pacific region has been a global hub for the Ceramic Balls Market for generations. Active Ceramic Balls are more resistant to wear and tear water, swelling powdering, and cracking but have a higher cost than the traditional one. Active ceramic balls are used as tower packing and covering supporting materials in the reactors.
Based on application, the ceramic balls market is segmented into bearing, grinding, valve, others. Bearing is the largest contributor to the global market in 2019 in this segment and is very likely to continue the trend in the forecast period. The manufacturing and Energy segment has grown rapidly in South Asian Countries in recent years on a large scale and has increased the demand for this segment.
Based on end user, the ceramic balls market is segmented into automotive, chemical, aerospace, others. Ceramic balls are widely used in automobile and aerospace manufacturing industries owing to its benefits including shock resistance, higher strength, and faster operational speed. Automotive applications are anticipated to drive the demand for ceramic balls on account of its advantageous applications in roller bearings, ball bearings, spark plugs, airbags, seat slides, valve, engine components, and locking mechanisms. In aerospace manufacturing, the ceramic balls are used in gyroscopes, flow meters, airframes, flow meters, and others.
[caption id="attachment_9732" align="aligncenter" width="578"]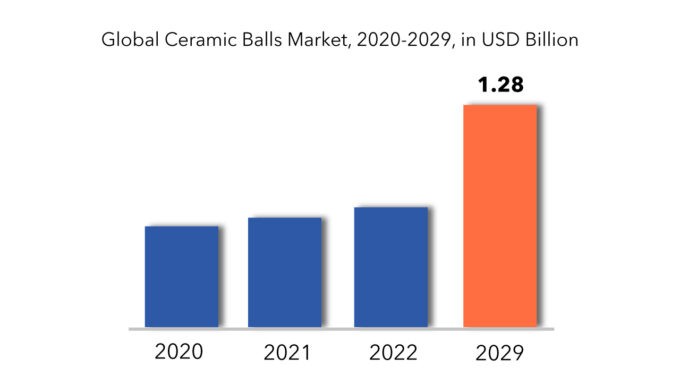
Ceramic Balls Market Players
The ceramic balls market key players include Amatsuji Steel Ball Mfg. Co. Ltd., Compagnie de Saint-Gobain SA, CoorsTek Inc., Fineway Inc., Industrial Tectonics Inc., Metalball SAS, Schaeffler AG, Spheric Trafalgar Ltd., Toshiba Materials Co. Ltd., and Tsubaki Nakashima Co. Ltd.
To increase their market position, these businesses have implemented a variety of growth tactics. These companies are using expansion, new product development, mergers and acquisitions, and collaboration as important growth strategies to improve their product portfolio and geographical presence in order to meet the rising demand for ceramic balls from emerging economies.
Who Should Buy? Or Key Stakeholders
- Ceramics industries.
- Chemicals & Materials
- Institutional & retail players.
- Investment research firms
- Others
Ceramic Balls Market Regional Analysis
The ceramic balls market by region includes North America, Asia-Pacific (APAC), Europe, South America, and Middle East & Africa (MEA).
- North America: includes the US, Canada, Mexico
- Asia Pacific: includes China, Japan, South Korea, India, Australia, ASEAN and Rest of APAC
- Europe: includes UK, Germany, France, Italy, Spain, Russia, and Rest of Europe
- South America: includes Brazil, Argentina and Rest of South America
- Middle East & Africa: includes Turkey, UAE, Saudi Arabia, South Africa, and Rest of MEA
Asia-Pacific region is the leading region by market share, owing to rapid growth in industrialization and manufacturing activities, with both chemical and automotive industries poised to grow at a stable pace, further increasing market growth. China and India will be the key contributors to the overall growth rate, with an increase in foreign investment in the emerging economies propelling the technological development of the ceramic balls market.
[caption id="attachment_9733" align="aligncenter" width="548"]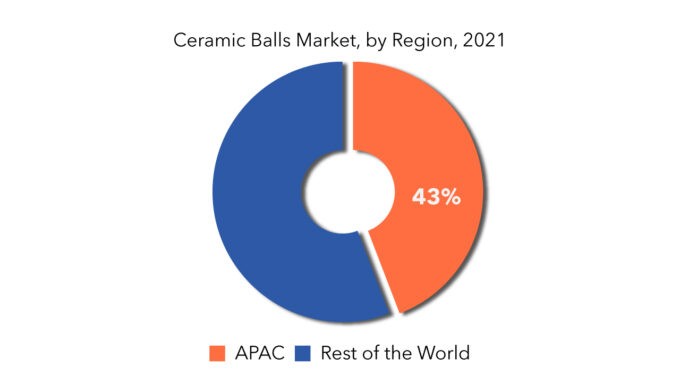
Europe is the second-largest segment by market share, where the demand for ceramic balls is driven by its application as a grinding aid in ball mills and the oil & gas industry for mercury removal. The companies based in this region focus on the technological excellence of their products to maintain their competitive edge over others.
Key Market Segments: Ceramic Balls Market
Ceramic Balls Market by Material, 2020-2029, (USD Million), (Thousand Units)- Silicon
- Alumina
- Zirconia
- Others
- Inert
- Active
- Bearing
- Grinding
- Valve
- Others
- Automotive
- Chemical
- Aerospace
- Others
- North America
- Europe
- Asia Pacific
- South America
- Middle East And Africa
Key Question Answered
- What is the current size of the ceramic balls market?
- What are the key factors influencing the growth of ceramic balls?
- What are the major applications for ceramic balls?
- Who are the major key players in the ceramic balls market?
- Which region will provide more business opportunities for ceramic balls in future?
- Which segment holds the maximum share of the ceramic balls market?
- Introduction
- Market Definition
- Market Segmentation
- Research Timelines
- Assumptions and Limitations
- Research Methodology
- Data Mining
- Secondary Research
- Primary Research
- Subject-Matter Experts’ Advice
- Quality Checks
- Final Review
- Data Triangulation
- Bottom-Up Approach
- Top-Down Approach
- Research Flow
- Data Sources
- Data Mining
- Executive Summary
- Market Overview
- Global Ceramic Balls Market Outlook
- Market Drivers
- Market Restraints
- Market Opportunities
- Impact of Covid-19 On Ceramic Balls Market
- Porter’s five forces model
- Threat from new entrants
- Threat from substitutes
- Bargaining power of suppliers
- Bargaining power of customers
- Degree of competition
- Industry value chain Analysis
- Global Ceramic Balls Market Outlook
- Global Ceramic Balls Market by Material
- Silicon
- Alumina
- Zirconia
- Others
- Global Ceramic Balls Market by Function
- Inert
- Active
- Global Ceramic Balls Market by Application
- Bearing
- Grinding
- Valve
- Others
- Global Ceramic Balls Market by End User
- Automotive
- Chemical
- Aerospace
- Others
- Global Ceramic Balls Market by Region
- North America
- US
- Canada
- Mexico
- South America
- Brazil
- Argentina
- Colombia
- Rest Of South America
- Europe
- Germany
- UK
- France
- Italy
- Spain
- Russia
- Rest Of Europe
- Asia Pacific
- India
- China
- Japan
- South Korea
- Australia
- South-East Asia
- Rest Of Asia Pacific
- Middle East and Africa
- UAE
- Saudi Arabia
- South Africa
- Rest Of Middle East and Africa
- North America
- Company Profiles* (Business Overview, Company Snapshot, Products Offered, Recent Developments)
-
- Amatsuji Steel Ball Mfg. Co. Ltd.
- Compagnie de Saint-Gobain SA
- CoorsTek Inc.
- Fineway Inc.
- Industrial Tectonics Inc.
- Metalball SAS
- Schaeffler AG
- Spheric Trafalgar Ltd.
- Toshiba Materials Co. Ltd.
- Tsubaki Nakashima Co. Ltd.
*The Company List Is Indicative
LIST OF TABLES
TABLE 1 GLOBAL CERAMIC BALLS MARKET BY MATERIAL (USD MILLIONS), 2020-2029
TABLE 2 GLOBAL CERAMIC BALLS MARKET BY MATERIAL (THOUSAND UNITS), 2020-2029
TABLE 3 GLOBAL CERAMIC BALLS MARKET BY FUNCTION (USD MILLIONS), 2020-2029
TABLE 4 GLOBAL CERAMIC BALLS MARKET BY FUNCTION (THOUSAND UNITS), 2020-2029
TABLE 5 GLOBAL CERAMIC BALLS MARKET BY APPLICATION (USD MILLIONS), 2020-2029
TABLE 6 GLOBAL CERAMIC BALLS MARKET BY APPLICATION (THOUSAND UNITS), 2020-2029
TABLE 7 GLOBAL CERAMIC BALLS MARKET BY END USER (USD MILLIONS), 2020-2029
TABLE 8 GLOBAL CERAMIC BALLS MARKET BY END USER (THOUSAND UNITS), 2020-2029
TABLE 9 GLOBAL CERAMIC BALLS MARKET BY REGION (USD MILLIONS), 2020-2029
TABLE 10 GLOBAL CERAMIC BALLS MARKET BY REGION (THOUSAND UNITS), 2020-2029
TABLE 11 NORTH AMERICA CERAMIC BALLS MARKET BY MATERIAL (USD MILLIONS), 2020-2029
TABLE 12 NORTH AMERICA CERAMIC BALLS MARKET BY MATERIAL (THOUSAND UNITS), 2020-2029
TABLE 13 NORTH AMERICA CERAMIC BALLS MARKET BY FUNCTION (USD MILLIONS), 2020-2029
TABLE 14 NORTH AMERICA CERAMIC BALLS MARKET BY FUNCTION (THOUSAND UNITS), 2020-2029
TABLE 15 NORTH AMERICA CERAMIC BALLS MARKET BY APPLICATION (USD MILLIONS), 2020-2029
TABLE 16 NORTH AMERICA CERAMIC BALLS MARKET BY APPLICATION (THOUSAND UNITS), 2020-2029
TABLE 17 NORTH AMERICA CERAMIC BALLS MARKET BY END USER (USD MILLIONS), 2020-2029
TABLE 18 NORTH AMERICA CERAMIC BALLS MARKET BY END USER (THOUSAND UNITS), 2020-2029
TABLE 19 US CERAMIC BALLS MARKET BY MATERIAL (USD MILLIONS), 2020-2029
TABLE 20 US CERAMIC BALLS MARKET BY MATERIAL (THOUSAND UNITS), 2020-2029
TABLE 21 US CERAMIC BALLS MARKET BY FUNCTION (USD MILLIONS), 2020-2029
TABLE 22 US CERAMIC BALLS MARKET BY FUNCTION (THOUSAND UNITS), 2020-2029
TABLE 23 US CERAMIC BALLS MARKET BY APPLICATION (USD MILLIONS), 2020-2029
TABLE 24 US CERAMIC BALLS MARKET BY APPLICATION (THOUSAND UNITS), 2020-2029
TABLE 25 US CERAMIC BALLS MARKET BY END USER (USD MILLIONS), 2020-2029
TABLE 26 US CERAMIC BALLS MARKET BY END USER (THOUSAND UNITS), 2020-2029
TABLE 27 CANADA CERAMIC BALLS MARKET BY MATERIAL (MILLIONS), 2020-2029
TABLE 28 CANADA CERAMIC BALLS MARKET BY MATERIAL (THOUSAND UNITS), 2020-2029
TABLE 29 CANADA CERAMIC BALLS MARKET BY FUNCTION (USD MILLIONS), 2020-2029
TABLE 30 CANADA CERAMIC BALLS MARKET BY FUNCTION (THOUSAND UNITS), 2020-2029
TABLE 31 CANADA CERAMIC BALLS MARKET BY APPLICATION (USD MILLIONS), 2020-2029
TABLE 32 CANADA CERAMIC BALLS MARKET BY APPLICATION (THOUSAND UNITS), 2020-2029
TABLE 33 CANADA CERAMIC BALLS MARKET BY END USER (USD MILLIONS), 2020-2029
TABLE 34 CANADA CERAMIC BALLS MARKET BY END USER (THOUSAND UNITS), 2020-2029
TABLE 35 MEXICO CERAMIC BALLS MARKET BY MATERIAL (USD MILLIONS), 2020-2029
TABLE 36 MEXICO CERAMIC BALLS MARKET BY MATERIAL (THOUSAND UNITS), 2020-2029
TABLE 37 MEXICO CERAMIC BALLS MARKET BY FUNCTION (USD MILLIONS), 2020-2029
TABLE 38 MEXICO CERAMIC BALLS MARKET BY FUNCTION (THOUSAND UNITS), 2020-2029
TABLE 39 MEXICO CERAMIC BALLS MARKET BY APPLICATION (USD MILLIONS), 2020-2029
TABLE 40 MEXICO CERAMIC BALLS MARKET BY APPLICATION (THOUSAND UNITS), 2020-2029
TABLE 41 MEXICO CERAMIC BALLS MARKET BY END USER (USD MILLIONS), 2020-2029
TABLE 42 MEXICO CERAMIC BALLS MARKET BY END USER (THOUSAND UNITS), 2020-2029
TABLE 43 SOUTH AMERICA CERAMIC BALLS MARKET BY MATERIAL (USD MILLIONS), 2020-2029
TABLE 44 SOUTH AMERICA CERAMIC BALLS MARKET BY MATERIAL (THOUSAND UNITS), 2020-2029
TABLE 45 SOUTH AMERICA CERAMIC BALLS MARKET BY FUNCTION (USD MILLIONS), 2020-2029
TABLE 46 SOUTH AMERICA CERAMIC BALLS MARKET BY FUNCTION (THOUSAND UNITS), 2020-2029
TABLE 47 SOUTH AMERICA CERAMIC BALLS MARKET BY APPLICATION (USD MILLIONS), 2020-2029
TABLE 48 SOUTH AMERICA CERAMIC BALLS MARKET BY APPLICATION (THOUSAND UNITS), 2020-2029
TABLE 49 SOUTH AMERICA CERAMIC BALLS MARKET BY END USER (USD MILLIONS), 2020-2029
TABLE 50 SOUTH AMERICA CERAMIC BALLS MARKET BY END USER (THOUSAND UNITS), 2020-2029
TABLE 51 BRAZIL CERAMIC BALLS MARKET BY MATERIAL (USD MILLIONS), 2020-2029
TABLE 52 BRAZIL CERAMIC BALLS MARKET BY MATERIAL (THOUSAND UNITS), 2020-2029
TABLE 53 BRAZIL CERAMIC BALLS MARKET BY FUNCTION (USD MILLIONS), 2020-2029
TABLE 54 BRAZIL CERAMIC BALLS MARKET BY FUNCTION (THOUSAND UNITS), 2020-2029
TABLE 55 BRAZIL CERAMIC BALLS MARKET BY APPLICATION (USD MILLIONS), 2020-2029
TABLE 56 BRAZIL CERAMIC BALLS MARKET BY APPLICATION (THOUSAND UNITS), 2020-2029
TABLE 57 BRAZIL CERAMIC BALLS MARKET BY END USER (USD MILLIONS), 2020-2029
TABLE 58 BRAZIL CERAMIC BALLS MARKET BY END USER (THOUSAND UNITS), 2020-2029
TABLE 59 ARGENTINA CERAMIC BALLS MARKET BY MATERIAL (USD MILLIONS), 2020-2029
TABLE 60 ARGENTINA CERAMIC BALLS MARKET BY MATERIAL (THOUSAND UNITS), 2020-2029
TABLE 61 ARGENTINA CERAMIC BALLS MARKET BY FUNCTION (USD MILLIONS), 2020-2029
TABLE 62 ARGENTINA CERAMIC BALLS MARKET BY FUNCTION (THOUSAND UNITS), 2020-2029
TABLE 63 ARGENTINA CERAMIC BALLS MARKET BY APPLICATION (USD MILLIONS), 2020-2029
TABLE 64 ARGENTINA CERAMIC BALLS MARKET BY APPLICATION (THOUSAND UNITS), 2020-2029
TABLE 65 ARGENTINA CERAMIC BALLS MARKET BY END USER (USD MILLIONS), 2020-2029
TABLE 66 ARGENTINA CERAMIC BALLS MARKET BY END USER (THOUSAND UNITS), 2020-2029
TABLE 67 COLOMBIA CERAMIC BALLS MARKET BY MATERIAL (USD MILLIONS), 2020-2029
TABLE 68 COLOMBIA CERAMIC BALLS MARKET BY MATERIAL (THOUSAND UNITS), 2020-2029
TABLE 69 COLOMBIA CERAMIC BALLS MARKET BY FUNCTION (USD MILLIONS), 2020-2029
TABLE 70 COLOMBIA CERAMIC BALLS MARKET BY FUNCTION (THOUSAND UNITS), 2020-2029
TABLE 71 COLOMBIA CERAMIC BALLS MARKET BY APPLICATION (USD MILLIONS), 2020-2029
TABLE 72 COLOMBIA CERAMIC BALLS MARKET BY APPLICATION (THOUSAND UNITS), 2020-2029
TABLE 73 COLOMBIA CERAMIC BALLS MARKET BY END USER (USD MILLIONS), 2020-2029
TABLE 74 COLOMBIA CERAMIC BALLS MARKET BY END USER (THOUSAND UNITS), 2020-2029
TABLE 75 REST OF SOUTH AMERICA CERAMIC BALLS MARKET BY MATERIAL (USD MILLIONS), 2020-2029
TABLE 76 REST OF SOUTH AMERICA CERAMIC BALLS MARKET BY MATERIAL (THOUSAND UNITS), 2020-2029
TABLE 77 REST OF SOUTH AMERICA CERAMIC BALLS MARKET BY FUNCTION (USD MILLIONS), 2020-2029
TABLE 78 REST OF SOUTH AMERICA CERAMIC BALLS MARKET BY FUNCTION (THOUSAND UNITS), 2020-2029
TABLE 79 REST OF SOUTH AMERICA CERAMIC BALLS MARKET BY APPLICATION (USD MILLIONS), 2020-2029
TABLE 80 REST OF SOUTH AMERICA CERAMIC BALLS MARKET BY APPLICATION (THOUSAND UNITS), 2020-2029
TABLE 81 REST OF SOUTH AMERICA CERAMIC BALLS MARKET BY END USER (USD MILLIONS), 2020-2029
TABLE 82 REST OF SOUTH AMERICA CERAMIC BALLS MARKET BY END USER (THOUSAND UNITS), 2020-2029
TABLE 83 ASIA-PACIFIC CERAMIC BALLS MARKET BY MATERIAL (USD MILLIONS), 2020-2029
TABLE 84 ASIA-PACIFIC CERAMIC BALLS MARKET BY MATERIAL (THOUSAND UNITS), 2020-2029
TABLE 85 ASIA-PACIFIC CERAMIC BALLS MARKET BY FUNCTION (USD MILLIONS), 2020-2029
TABLE 86 ASIA-PACIFIC CERAMIC BALLS MARKET BY FUNCTION (THOUSAND UNITS), 2020-2029
TABLE 87 ASIA-PACIFIC CERAMIC BALLS MARKET BY APPLICATION (USD MILLIONS), 2020-2029
TABLE 88 ASIA-PACIFIC CERAMIC BALLS MARKET BY APPLICATION (THOUSAND UNITS), 2020-2029
TABLE 89 ASIA-PACIFIC CERAMIC BALLS MARKET BY END USER (USD MILLIONS), 2020-2029
TABLE 90 ASIA-PACIFIC CERAMIC BALLS MARKET BY END USER (THOUSAND UNITS), 2020-2029
TABLE 91 INDIA CERAMIC BALLS MARKET BY MATERIAL (USD MILLIONS), 2020-2029
TABLE 92 INDIA CERAMIC BALLS MARKET BY MATERIAL (THOUSAND UNITS), 2020-2029
TABLE 93 INDIA CERAMIC BALLS MARKET BY FUNCTION (USD MILLIONS), 2020-2029
TABLE 94 INDIA CERAMIC BALLS MARKET BY FUNCTION (THOUSAND UNITS), 2020-2029
TABLE 95 INDIA CERAMIC BALLS MARKET BY APPLICATION (USD MILLIONS), 2020-2029
TABLE 96 INDIA CERAMIC BALLS MARKET BY APPLICATION (THOUSAND UNITS), 2020-2029
TABLE 97 INDIA CERAMIC BALLS MARKET BY END USER (USD MILLIONS), 2020-2029
TABLE 98 INDIA CERAMIC BALLS MARKET BY END USER (THOUSAND UNITS), 2020-2029
TABLE 99 CHINA CERAMIC BALLS MARKET BY MATERIAL (USD MILLIONS), 2020-2029
TABLE 100 CHINA CERAMIC BALLS MARKET BY MATERIAL (THOUSAND UNITS), 2020-2029
TABLE 101 CHINA CERAMIC BALLS MARKET BY FUNCTION (USD MILLIONS), 2020-2029
TABLE 102 CHINA CERAMIC BALLS MARKET BY FUNCTION (THOUSAND UNITS), 2020-2029
TABLE 103 CHINA CERAMIC BALLS MARKET BY APPLICATION (USD MILLIONS), 2020-2029
TABLE 104 CHINA CERAMIC BALLS MARKET BY APPLICATION (THOUSAND UNITS), 2020-2029
TABLE 105 CHINA CERAMIC BALLS MARKET BY END USER (USD MILLIONS), 2020-2029
TABLE 106 CHINA CERAMIC BALLS MARKET BY END USER (THOUSAND UNITS), 2020-2029
TABLE 107 JAPAN CERAMIC BALLS MARKET BY MATERIAL (USD MILLIONS), 2020-2029
TABLE 108 JAPAN CERAMIC BALLS MARKET BY MATERIAL (THOUSAND UNITS), 2020-2029
TABLE 109 JAPAN CERAMIC BALLS MARKET BY FUNCTION (USD MILLIONS), 2020-2029
TABLE 110 JAPAN CERAMIC BALLS MARKET BY FUNCTION (THOUSAND UNITS), 2020-2029
TABLE 111 JAPAN CERAMIC BALLS MARKET BY APPLICATION (USD MILLIONS), 2020-2029
TABLE 112 JAPAN CERAMIC BALLS MARKET BY APPLICATION (THOUSAND UNITS), 2020-2029
TABLE 113 JAPAN CERAMIC BALLS MARKET BY END USER (USD MILLIONS), 2020-2029
TABLE 114 JAPAN CERAMIC BALLS MARKET BY END USER (THOUSAND UNITS), 2020-2029
TABLE 115 SOUTH KOREA CERAMIC BALLS MARKET BY MATERIAL (USD MILLIONS), 2020-2029
TABLE 116 SOUTH KOREA CERAMIC BALLS MARKET BY MATERIAL (THOUSAND UNITS), 2020-2029
TABLE 117 SOUTH KOREA CERAMIC BALLS MARKET BY FUNCTION (USD MILLIONS), 2020-2029
TABLE 118 SOUTH KOREA CERAMIC BALLS MARKET BY FUNCTION (THOUSAND UNITS), 2020-2029
TABLE 119 SOUTH KOREA CERAMIC BALLS MARKET BY APPLICATION (USD MILLIONS), 2020-2029
TABLE 120 SOUTH KOREA CERAMIC BALLS MARKET BY APPLICATION (THOUSAND UNITS), 2020-2029
TABLE 121 SOUTH KOREA CERAMIC BALLS MARKET BY END USER (USD MILLIONS), 2020-2029
TABLE 122 SOUTH KOREA CERAMIC BALLS MARKET BY END USER (THOUSAND UNITS), 2020-2029
TABLE 123 AUSTRALIA CERAMIC BALLS MARKET BY MATERIAL (USD MILLIONS), 2020-2029
TABLE 124 AUSTRALIA CERAMIC BALLS MARKET BY MATERIAL (THOUSAND UNITS), 2020-2029
TABLE 125 AUSTRALIA CERAMIC BALLS MARKET BY FUNCTION (USD MILLIONS), 2020-2029
TABLE 126 AUSTRALIA CERAMIC BALLS MARKET BY FUNCTION (THOUSAND UNITS), 2020-2029
TABLE 127 AUSTRALIA CERAMIC BALLS MARKET BY APPLICATION (USD MILLIONS), 2020-2029
TABLE 128 AUSTRALIA CERAMIC BALLS MARKET BY APPLICATION (THOUSAND UNITS), 2020-2029
TABLE 129 AUSTRALIA CERAMIC BALLS MARKET BY END USER (USD MILLIONS), 2020-2029
TABLE 130 AUSTRALIA CERAMIC BALLS MARKET BY END USER (THOUSAND UNITS), 2020-2029
TABLE 131 SOUTH EAST ASIA CERAMIC BALLS MARKET BY MATERIAL (USD MILLIONS), 2020-2029
TABLE 132 SOUTH EAST ASIA CERAMIC BALLS MARKET BY MATERIAL (THOUSAND UNITS), 2020-2029
TABLE 133 SOUTH EAST ASIA CERAMIC BALLS MARKET BY FUNCTION (USD MILLIONS), 2020-2029
TABLE 134 SOUTH EAST ASIA CERAMIC BALLS MARKET BY FUNCTION (THOUSAND UNITS), 2020-2029
TABLE 135 SOUTH EAST ASIA CERAMIC BALLS MARKET BY APPLICATION (USD MILLIONS), 2020-2029
TABLE 136 SOUTH EAST ASIA CERAMIC BALLS MARKET BY APPLICATION (THOUSAND UNITS), 2020-2029
TABLE 137 SOUTH EAST ASIA CERAMIC BALLS MARKET BY END USER (USD MILLIONS), 2020-2029
TABLE 138 SOUTH EAST ASIA CERAMIC BALLS MARKET BY END USER (THOUSAND UNITS), 2020-2029
TABLE 139 REST OF ASIA PACIFIC CERAMIC BALLS MARKET BY MATERIAL (USD MILLIONS), 2020-2029
TABLE 140 REST OF ASIA PACIFIC CERAMIC BALLS MARKET BY MATERIAL (THOUSAND UNITS), 2020-2029
TABLE 141 REST OF ASIA PACIFIC CERAMIC BALLS MARKET BY FUNCTION (USD MILLIONS), 2020-2029
TABLE 142 REST OF ASIA PACIFIC CERAMIC BALLS MARKET BY FUNCTION (THOUSAND UNITS), 2020-2029
TABLE 143 REST OF ASIA PACIFIC CERAMIC BALLS MARKET BY APPLICATION (USD MILLIONS), 2020-2029
TABLE 144 REST OF ASIA PACIFIC CERAMIC BALLS MARKET BY APPLICATION (THOUSAND UNITS), 2020-2029
TABLE 145 REST OF ASIA PACIFIC CERAMIC BALLS MARKET BY END USER (USD MILLIONS), 2020-2029
TABLE 146 REST OF ASIA PACIFIC CERAMIC BALLS MARKET BY END USER (THOUSAND UNITS), 2020-2029
TABLE 147 EUROPE CERAMIC BALLS MARKET BY MATERIAL (USD MILLIONS), 2020-2029
TABLE 148 EUROPE CERAMIC BALLS MARKET BY MATERIAL (THOUSAND UNITS), 2020-2029
TABLE 149 EUROPE CERAMIC BALLS MARKET BY FUNCTION (USD MILLIONS), 2020-2029
TABLE 150 EUROPE CERAMIC BALLS MARKET BY FUNCTION (THOUSAND UNITS), 2020-2029
TABLE 151 EUROPE CERAMIC BALLS MARKET BY APPLICATION (USD MILLIONS), 2020-2029
TABLE 152 EUROPE CERAMIC BALLS MARKET BY APPLICATION (THOUSAND UNITS), 2020-2029
TABLE 153 EUROPE CERAMIC BALLS MARKET BY END USER (USD MILLIONS), 2020-2029
TABLE 154 EUROPE CERAMIC BALLS MARKET BY END USER (THOUSAND UNITS), 2020-2029
TABLE 155 GERMANY CERAMIC BALLS MARKET BY MATERIAL (USD MILLIONS), 2020-2029
TABLE 156 GERMANY CERAMIC BALLS MARKET BY MATERIAL (THOUSAND UNITS), 2020-2029
TABLE 157 GERMANY CERAMIC BALLS MARKET BY FUNCTION (USD MILLIONS), 2020-2029
TABLE 158 GERMANY CERAMIC BALLS MARKET BY FUNCTION (THOUSAND UNITS), 2020-2029
TABLE 159 GERMANY CERAMIC BALLS MARKET BY APPLICATION (USD MILLIONS), 2020-2029
TABLE 160 GERMANY CERAMIC BALLS MARKET BY APPLICATION (THOUSAND UNITS), 2020-2029
TABLE 161 GERMANY CERAMIC BALLS MARKET BY END USER (USD MILLIONS), 2020-2029
TABLE 162 GERMANY CERAMIC BALLS MARKET BY END USER (THOUSAND UNITS), 2020-2029
TABLE 163 UK CERAMIC BALLS MARKET BY MATERIAL (USD MILLIONS), 2020-2029
TABLE 164 UK CERAMIC BALLS MARKET BY MATERIAL (THOUSAND UNITS), 2020-2029
TABLE 165 UK CERAMIC BALLS MARKET BY FUNCTION (USD MILLIONS), 2020-2029
TABLE 166 UK CERAMIC BALLS MARKET BY FUNCTION (THOUSAND UNITS), 2020-2029
TABLE 167 UK CERAMIC BALLS MARKET BY APPLICATION (USD MILLIONS), 2020-2029
TABLE 168 UK CERAMIC BALLS MARKET BY APPLICATION (THOUSAND UNITS), 2020-2029
TABLE 169 UK CERAMIC BALLS MARKET BY END USER (USD MILLIONS), 2020-2029
TABLE 170 UK CERAMIC BALLS MARKET BY END USER (THOUSAND UNITS), 2020-2029
TABLE 171 FRANCE CERAMIC BALLS MARKET BY MATERIAL (USD MILLIONS), 2020-2029
TABLE 172 FRANCE CERAMIC BALLS MARKET BY MATERIAL (THOUSAND UNITS), 2020-2029
TABLE 173 FRANCE CERAMIC BALLS MARKET BY FUNCTION (USD MILLIONS), 2020-2029
TABLE 174 FRANCE CERAMIC BALLS MARKET BY FUNCTION (THOUSAND UNITS), 2020-2029
TABLE 175 FRANCE CERAMIC BALLS MARKET BY APPLICATION (USD MILLIONS), 2020-2029
TABLE 176 FRANCE CERAMIC BALLS MARKET BY APPLICATION (THOUSAND UNITS), 2020-2029
TABLE 177 FRANCE CERAMIC BALLS MARKET BY END USER (USD MILLIONS), 2020-2029
TABLE 178 FRANCE CERAMIC BALLS MARKET BY END USER (THOUSAND UNITS), 2020-2029
TABLE 179 ITALY CERAMIC BALLS MARKET BY MATERIAL (USD MILLIONS), 2020-2029
TABLE 180 ITALY CERAMIC BALLS MARKET BY MATERIAL (THOUSAND UNITS), 2020-2029
TABLE 181 ITALY CERAMIC BALLS MARKET BY FUNCTION (USD MILLIONS), 2020-2029
TABLE 182 ITALY CERAMIC BALLS MARKET BY FUNCTION (THOUSAND UNITS), 2020-2029
TABLE 183 ITALY CERAMIC BALLS MARKET BY APPLICATION (USD MILLIONS), 2020-2029
TABLE 184 ITALY CERAMIC BALLS MARKET BY APPLICATION (THOUSAND UNITS), 2020-2029
TABLE 185 ITALY CERAMIC BALLS MARKET BY END USER (USD MILLIONS), 2020-2029
TABLE 186 ITALY CERAMIC BALLS MARKET BY END USER (THOUSAND UNITS), 2020-2029
TABLE 187 SPAIN CERAMIC BALLS MARKET BY MATERIAL (USD MILLIONS), 2020-2029
TABLE 188 SPAIN CERAMIC BALLS MARKET BY MATERIAL (THOUSAND UNITS), 2020-2029
TABLE 189 SPAIN CERAMIC BALLS MARKET BY FUNCTION (USD MILLIONS), 2020-2029
TABLE 190 SPAIN CERAMIC BALLS MARKET BY FUNCTION (THOUSAND UNITS), 2020-2029
TABLE 191 SPAIN CERAMIC BALLS MARKET BY APPLICATION (USD MILLIONS), 2020-2029
TABLE 192 SPAIN CERAMIC BALLS MARKET BY APPLICATION (THOUSAND UNITS), 2020-2029
TABLE 193 SPAIN CERAMIC BALLS MARKET BY END USER (USD MILLIONS), 2020-2029
TABLE 194 SPAIN CERAMIC BALLS MARKET BY END USER (THOUSAND UNITS), 2020-2029
TABLE 195 RUSSIA CERAMIC BALLS MARKET BY MATERIAL (USD MILLIONS), 2020-2029
TABLE 196 RUSSIA CERAMIC BALLS MARKET BY MATERIAL (THOUSAND UNITS), 2020-2029
TABLE 197 RUSSIA CERAMIC BALLS MARKET BY FUNCTION (USD MILLIONS), 2020-2029
TABLE 198 RUSSIA CERAMIC BALLS MARKET BY FUNCTION (THOUSAND UNITS), 2020-2029
TABLE 199 RUSSIA CERAMIC BALLS MARKET BY APPLICATION (USD MILLIONS), 2020-2029
TABLE 200 RUSSIA CERAMIC BALLS MARKET BY APPLICATION (THOUSAND UNITS), 2020-2029
TABLE 201 RUSSIA CERAMIC BALLS MARKET BY END USER (USD MILLIONS), 2020-2029
TABLE 202 RUSSIA CERAMIC BALLS MARKET BY END USER (THOUSAND UNITS), 2020-2029
TABLE 203 REST OF EUROPE CERAMIC BALLS MARKET BY MATERIAL (USD MILLIONS), 2020-2029
TABLE 204 REST OF EUROPE CERAMIC BALLS MARKET BY MATERIAL (THOUSAND UNITS), 2020-2029
TABLE 205 REST OF EUROPE CERAMIC BALLS MARKET BY FUNCTION (USD MILLIONS), 2020-2029
TABLE 206 REST OF EUROPE CERAMIC BALLS MARKET BY FUNCTION (THOUSAND UNITS), 2020-2029
TABLE 207 REST OF EUROPE CERAMIC BALLS MARKET BY APPLICATION (USD MILLIONS), 2020-2029
TABLE 208 REST OF EUROPE CERAMIC BALLS MARKET BY APPLICATION (THOUSAND UNITS), 2020-2029
TABLE 209 REST OF EUROPE CERAMIC BALLS MARKET BY END USER (USD MILLIONS), 2020-2029
TABLE 210 REST OF EUROPE CERAMIC BALLS MARKET BY END USER (THOUSAND UNITS), 2020-2029
TABLE 211 MIDDLE EAST AND AFRICA CERAMIC BALLS MARKET BY MATERIAL (USD MILLIONS), 2020-2029
TABLE 212 MIDDLE EAST AND AFRICA CERAMIC BALLS MARKET BY MATERIAL (THOUSAND UNITS), 2020-2029
TABLE 213 MIDDLE EAST AND AFRICA CERAMIC BALLS MARKET BY FUNCTION (USD MILLIONS), 2020-2029
TABLE 214 MIDDLE EAST AND AFRICA CERAMIC BALLS MARKET BY FUNCTION (THOUSAND UNITS), 2020-2029
TABLE 215 MIDDLE EAST AND AFRICA CERAMIC BALLS MARKET BY APPLICATION (USD MILLIONS), 2020-2029
TABLE 216 MIDDLE EAST AND AFRICA CERAMIC BALLS MARKET BY APPLICATION (THOUSAND UNITS), 2020-2029
TABLE 217 MIDDLE EAST AND AFRICA CERAMIC BALLS MARKET BY END USER (USD MILLIONS), 2020-2029
TABLE 218 MIDDLE EAST AND AFRICA CERAMIC BALLS MARKET BY END USER (THOUSAND UNITS), 2020-2029
TABLE 219 UAE CERAMIC BALLS MARKET BY MATERIAL (USD MILLIONS), 2020-2029
TABLE 220 UAE CERAMIC BALLS MARKET BY MATERIAL (THOUSAND UNITS), 2020-2029
TABLE 221 UAE CERAMIC BALLS MARKET BY FUNCTION (USD MILLIONS), 2020-2029
TABLE 222 UAE CERAMIC BALLS MARKET BY FUNCTION (THOUSAND UNITS), 2020-2029
TABLE 223 UAE CERAMIC BALLS MARKET BY APPLICATION (USD MILLIONS), 2020-2029
TABLE 224 UAE CERAMIC BALLS MARKET BY APPLICATION (THOUSAND UNITS), 2020-2029
TABLE 225 UAE CERAMIC BALLS MARKET BY END USER (USD MILLIONS), 2020-2029
TABLE 226 UAE CERAMIC BALLS MARKET BY END USER (THOUSAND UNITS), 2020-2029
TABLE 227 SAUDI ARABIA CERAMIC BALLS MARKET BY MATERIAL (USD MILLIONS), 2020-2029
TABLE 228 SAUDI ARABIA CERAMIC BALLS MARKET BY MATERIAL (THOUSAND UNITS), 2020-2029
TABLE 229 SAUDI ARABIA CERAMIC BALLS MARKET BY FUNCTION (USD MILLIONS), 2020-2029
TABLE 230 SAUDI ARABIA CERAMIC BALLS MARKET BY FUNCTION (THOUSAND UNITS), 2020-2029
TABLE 231 SAUDI ARABIA CERAMIC BALLS MARKET BY APPLICATION (USD MILLIONS), 2020-2029
TABLE 232 SAUDI ARABIA CERAMIC BALLS MARKET BY APPLICATION (THOUSAND UNITS), 2020-2029
TABLE 233 SAUDI ARABIA CERAMIC BALLS MARKET BY END USER (USD MILLIONS), 2020-2029
TABLE 234 SAUDI ARABIA CERAMIC BALLS MARKET BY END USER (THOUSAND UNITS), 2020-2029
TABLE 235 SOUTH AFRICA CERAMIC BALLS MARKET BY MATERIAL (USD MILLIONS), 2020-2029
TABLE 236 SOUTH AFRICA CERAMIC BALLS MARKET BY MATERIAL (THOUSAND UNITS), 2020-2029
TABLE 237 SOUTH AFRICA CERAMIC BALLS MARKET BY FUNCTION (USD MILLIONS), 2020-2029
TABLE 238 SOUTH AFRICA CERAMIC BALLS MARKET BY FUNCTION (THOUSAND UNITS), 2020-2029
TABLE 239 SOUTH AFRICA CERAMIC BALLS MARKET BY APPLICATION (USD MILLIONS), 2020-2029
TABLE 240 SOUTH AFRICA CERAMIC BALLS MARKET BY APPLICATION (THOUSAND UNITS), 2020-2029
TABLE 241 SOUTH AFRICA CERAMIC BALLS MARKET BY END USER (USD MILLIONS), 2020-2029
TABLE 242 SOUTH AFRICA CERAMIC BALLS MARKET BY END USER (THOUSAND UNITS), 2020-2029
TABLE 243 REST OF MIDDLE EAST AND AFRICA CERAMIC BALLS MARKET BY MATERIAL (USD MILLIONS), 2020-2029
TABLE 244 REST OF MIDDLE EAST AND AFRICA CERAMIC BALLS MARKET BY MATERIAL (THOUSAND UNITS), 2020-2029
TABLE 245 REST OF MIDDLE EAST AND AFRICA CERAMIC BALLS MARKET BY FUNCTION (USD MILLIONS), 2020-2029
TABLE 246 REST OF MIDDLE EAST AND AFRICA CERAMIC BALLS MARKET BY FUNCTION (THOUSAND UNITS), 2020-2029
TABLE 247 REST OF MIDDLE EAST AND AFRICA CERAMIC BALLS MARKET BY APPLICATION (USD MILLIONS), 2020-2029
TABLE 248 REST OF MIDDLE EAST AND AFRICA CERAMIC BALLS MARKET BY APPLICATION (THOUSAND UNITS), 2020-2029
TABLE 249 REST OF MIDDLE EAST AND AFRICA CERAMIC BALLS MARKET BY END USER (USD MILLIONS), 2020-2029
TABLE 250 REST OF MIDDLE EAST AND AFRICA CERAMIC BALLS MARKET BY END USER (THOUSAND UNITS), 2020-2029
LIST OF FIGURES
FIGURE 1 MARKET DYNAMICS
FIGURE 2 MARKET SEGMENTATION
FIGURE 3 REPORT TIMELINES: YEARS CONSIDERED
FIGURE 4 DATA TRIANGULATION
FIGURE 5 BOTTOM-UP APPROACH
FIGURE 6 TOP-DOWN APPROACH
FIGURE 7 RESEARCH FLOW
FIGURE 8 GLOBAL CERAMIC BALLS MARKET BY MATERIAL, USD MILLION, 2020-2029
FIGURE 9 GLOBAL CERAMIC BALLS MARKET BY FUNCTION, USD MILLION, 2020-2029
FIGURE 10 GLOBAL CERAMIC BALLS MARKET BY APPLICATION, USD MILLION, 2020-2029
FIGURE 11 GLOBAL CERAMIC BALLS MARKET BY END USER, USD MILLION, 2020-2029
FIGURE 12 GLOBAL CERAMIC BALLS MARKET BY REGION, USD MILLION, 2020-2029
FIGURE 13 PORTER’S FIVE FORCES MODEL
FIGURE 14 MARKET SHARE ANALYSIS
FIGURE 15 AMATSUJI STEEL BALL MFG. CO. LTD.: COMPANY SNAPSHOT
FIGURE 16 COMPAGNIE DE SAINT-GOBAIN SA: COMPANY SNAPSHOT
FIGURE 17 COORSTEK INC.: COMPANY SNAPSHOT
FIGURE 18 FINEWAY INC.: COMPANY SNAPSHOT
FIGURE 19 INDUSTRIAL TECTONICS INC.: COMPANY SNAPSHOT
FIGURE 20 METALBALL SAS: COMPANY SNAPSHOT
FIGURE 21 SCHAEFFLER AG: COMPANY SNAPSHOT
FIGURE 22 SPHERIC TRAFALGAR LTD.: COMPANY SNAPSHOT
FIGURE 23 TOSHIBA MATERIALS CO. LTD.: COMPANY SNAPSHOT
FIGURE 24 TSUBAKI NAKASHIMA CO. LTD.: COMPANY SNAPSHOT
DOWNLOAD FREE SAMPLE REPORT
License Type
SPEAK WITH OUR ANALYST
Want to know more about the report or any specific requirement?
WANT TO CUSTOMIZE THE REPORT?
Our Clients Speak
We asked them to research ‘ Equipment market’ all over the world, and their whole arrangement was helpful to us. thehealthanalytics.com insightful analysis and reports contributed to our current analysis and in creating a future strategy. Besides, the te
Yosuke Mitsui
Senior Associate Construction Equipment Sales & Marketing
We asked them to research ‘Equipment market’ all over the world, and their whole arrangement was helpful to us. thehealthanalytics.com insightful analysis and reports contributed to our current analysis and in creating a future strategy. Besides, the te


