

Base Year Value ()
x.x %
x.x %
CAGR ()
x.x %
x.x %
Forecast Year Value ()
x.x %
x.x %
Historical Data Period
Largest Region
Forecast Period
Antireflection Coatings Market by Technology (Vacuum Deposition, Electronic Beam Evaporation, Sputtering, Others), Application (Eyewear, Electronics, Solar Panels, Automobile, Others) and Region, Global trends and forecast from 2022 to 2029
Instant access to hundreds of data points and trends
- Market estimates from 2014-2029
- Competitive analysis, industry segmentation, financial benchmarks
- Incorporates SWOT, Porter's Five Forces and risk management frameworks
- PDF report or online database with Word, Excel and PowerPoint export options
- 100% money back guarantee
Antireflection Coatings Market Overview
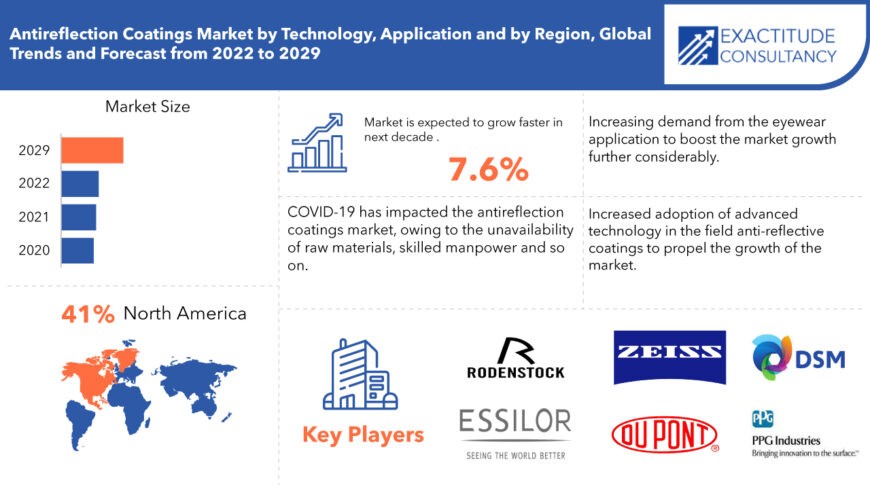
The global antireflection coatings market is expected to grow at 7.6% CAGR from 2020 to 2029. It is expected to reach above USD 8.31 billion by 2029 from USD 4.3 billion in 2020.
Anti-reflection coatings are optical coatings that minimize reflections from a surface. When utilized in conventional imaging devices and complicated systems like telescopes and solar panels, these coatings improve visibility and contrast. Furthermore, it effectively boosts the lens surface's transmittance. Anti-reflective coatings on eyewear enable a clear image while also being scratch, water, and dust resistant. When working on a computer for long periods of time, anti-reflective glasses shield your eyes from glare, preventing eye fatigue and strain. Over the next nine years, technological advances in the field of manufacturing and deposition techniques, together with rising demand for efficient optical devices from end-use applications, are likely to drive demand for coatings. Increased manufacturing of solar panels, increased demand for efficient optical devices from end-use applications, and innovations in fabrication and deposition techniques are all propelling the industry.
| ATTRIBUTE | DETAILS |
| Study period | 2020-2029 |
| Base year | 2021 |
| Estimated year | 2022 |
| Forecasted year | 2022-2029 |
| Historical period | 2018-2020 |
| Unit | Value (USD Billion), (Kilotons) |
| Segmentation | By Technology, By Application, By Region |
| By Technology
|
|
| By Application
|
|
| By Region
|
|
Increased demand for anti-reflective coatings from the eyewear and photovoltaic industries, as well as increased acceptance of anti-reflective glasses in the construction industry, are driving the expansion of the anti-reflective coating market. The high cost of the product, as well as a lack of knowledge among consumers and service providers, limit market growth. Continued developments in the anti-reflective coating market, such as the development of enhanced coatings, self-cleaning coatings, and durable coatings that give greater power supply for solar panels, is favorable and likely to create a lucrative potential for market expansion.
The availability of efficient and cost-effective deposition methods is critical to the market. In order to attain precision in deposition, innovative coating methods like as ion assisted deposition, ion beam sputtering, and advanced plasma reactive sputtering are increasingly being used. AR coatings are now being used in high-end applications such as telescopes, military & defense, and aerospace, propelling the industry forward.
Over the forecast period, rising demand for anti-reflective coating from the healthcare industry is expected to provide significant market opportunities. The increasing use of anti-reflective coating in scientific and medical screen displays is projected to boost anti-reflective coating market growth. Anti-reflective coating is projected to expand in popularity as demand for diverse consumer items rises due to rising disposable income and changing consumer lifestyles.
Covid-19 has had a significant influence on the world economy, wreaking havoc on global trade and affecting households, businesses, financial institutions, industrial facilities, and infrastructure corporations all at the same time. Short-term market demand is expected to be limited due to international trade limitations and lockout regulations on chemical sector activities. Since the pandemic knocked on the doors of numerous worldwide markets, the market has slowed. The government's lockdown resulted in a significant halt of market activity, with the participants bearing the brunt of the consequences in the form of losses, less skilled personnel, unavailability of raw materials for production, and so on.
[caption id="attachment_8886" align="alignnone" width="870"]
Frequently Asked Questions
• What is the worth of global antireflection coatings market?
The antireflection coatings market size had crossed USD 4.3 billion in 2020 and will observe a CAGR of more than 7.6 % up to 2029 driven by increased demand for efficient optical devices from end-use applications, and innovations in fabrication and deposition techniques
• What is the size of the North America antireflection coatings industry?
North America held more than 41 % of the antireflection coatings market revenue share in 2020 and will witness rising demand for anti-reflective coatings in eyeglasses and increased application in consumer goods such as smartphones, cameras, and flat panel displays.
• What are some of the market's driving forces?
Increased demand for anti-reflective coatings from the eyewear and photovoltaic industries, as well as increased acceptance of anti-reflective glasses in the construction industry, are driving the expansion of the anti-reflective coating market.
• Which are the top companies to hold the market share in antireflection coatings market?
Key players profiled in the report include Optical Coatings Japan Rodenstock GmbH, Essilor International, Carl Zeiss AG, E. I. du Pont de Nemours and Company, Koninklijke DSM N.V., Honeywell International PPG Industries, Hoya Corporation, Viavi Solutions, Inc.
• What is the leading application of antireflection coatings market?
The global antireflective coatings market is dominated by the eyewear industry. As the number of persons suffering from presbyopia rises, so does the demand for progressive lenses. Anti-reflection lenses are a cost-effective way to cut down on glare from computer screens, televisions, flat panel displays, and other electronic displays.
• Which is the largest regional market for antireflection coatings market?
Increased demand for anti-reflective coatings in eyewear applications, as well as expansion in application in consumer products such as smartphones, cameras, and flat panel displays, have generated a profitable opportunity for market growth in North America.
Antireflection Coatings Market Players
The antireflection coatings market key players include Optical Coatings Japan Rodenstock GmbH, Essilor International, Carl Zeiss AG, E. I. du Pont de Nemours and Company, Koninklijke DSM N.V., Honeywell International PPG Industries, Hoya Corporation, Viavi Solutions, Inc.
For corporate expansion, these key leaders are implementing strategic formulations such as new product development and commercialization, commercial expansion, and distribution agreements. Moreover, these participants are substantially spending in product development, which is fueling revenue generation.
Who Should Buy? Or Key stakeholders
- Construction industry companies
- End User Companies
- Research Organizations
- Investors
- Regulatory Authorities
- Others
Antireflection Coatings Market Regional Analysis
The antireflection coatings market by region includes North America, Asia-Pacific (APAC), Europe, South America, and Middle East & Africa (MEA).
- North America: includes the US, Canada, Mexico
- Asia Pacific: includes China, Japan, South Korea, India, Australia, ASEAN and Rest of APAC
- Europe: includes UK, Germany, France, Italy, Spain, Russia, and Rest of Europe
- South America: includes Brazil, Argentina and Rest of South America
- Middle East & Africa: includes Turkey, UAE, Saudi Arabia, South Africa, and Rest of MEA
North America, which includes the United States, Canada, and Mexico, accounts for the majority of the antireflective coatings industry. Rising demand for anti-reflective coatings in eyeglasses and increased application in consumer goods such as smartphones, cameras, and flat panel displays have created a profitable opportunity for market expansion in this region. Another important driving element for market expansion in this region is an increase in consumer goods demand. The presence of significant key players in this region, as well as demand for antireflective coatings in various manufacturing sectors, aided market expansion.
[caption id="attachment_8899" align="alignnone" width="680"]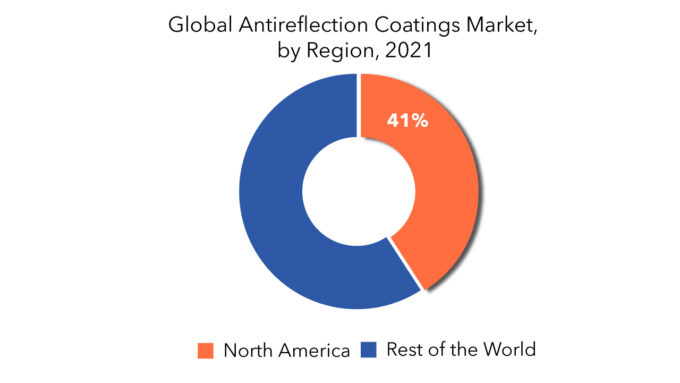
Key Market Segments: Antireflection Coatings Market
Antireflection Coatings Market by Technology, 2020-2029, (USD Billion), (Kilotons)- Vacuum Deposition
- Electronic Beam Evaporation
- Sputtering
- Others
- Eyewear
- Electronics
- Solar Panels
- Automobile
- Others
- North America
- Asia Pacific
- Europe
- Latin America
- Middle East And Africa
Antireflection Coatings Market Segment Analysis
The global antireflection coatings market is segmented based on technology, application. By technology, the market is bifurcated into vacuum deposition, electronic beam evaporation, sputtering, others. The worldwide antireflective coatings industry is dominated by vacuum deposition. A multitude of methods are used in vacuum deposition technology to deposit layers of the needed material onto the optical surface. At temperatures below atmospheric pressure, vacuum deposition is possible. Because of its low environmental effect and adaptability, vacuum deposition technology is generally employed for the application of anti-reflective coatings. Vacuum deposition has various advantages, including the ability to create an environmentally friendly and repeatable environment for the process.
By application, the market is divided into eyewear, electronics, solar panels, automobile, others. The global antireflective coatings market is dominated by the eyewear industry. As the number of persons suffering from presbyopia rises, so does the demand for progressive lenses. Presbyopia is a disorder in which the crystalline lens of the eye hardens with age, making reading at close range difficult. Anti-reflection lenses are a cost-effective way to cut down on glare from computer screens, televisions, flat panel displays, and other electronic displays. Glare is reduced and reflectance is reduced using anti-reflective coatings. This enhances visual awareness while also making the display easier to read. The presence of broad marketing conditions creates positive market growth conditions.
[caption id="attachment_8888" align="alignnone" width="680"]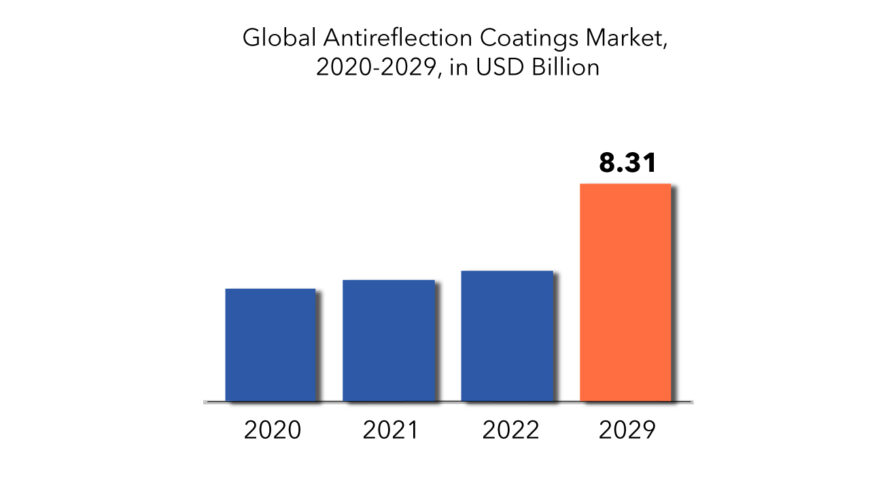
- INTRODUCTION
- MARKET DEFINITION
- MARKET SEGMENTATION
- RESEARCH TIMELINES
- ASSUMPTIONS AND LIMITATIONS
- RESEARCH METHODOLOGY
- DATA MINING
- SECONDARY RESEARCH
- PRIMARY RESEARCH
- SUBJECT-MATTER EXPERTS’ ADVICE
- QUALITY CHECKS
- FINAL REVIEW
- DATA TRIANGULATION
- BOTTOM-UP APPROACH
- TOP-DOWN APPROACH
- RESEARCH FLOW
- DATA SOURCES
- DATA MINING
- EXECUTIVE SUMMARY
- MARKET OVERVIEW
- GLOBAL ANTIREFLECTION COATINGS MARKET OUTLOOK
- MARKET DRIVERS
- MARKET RESTRAINTS
- MARKET OPPORTUNITIES
- IMPACT OF COVID-19 ON ANTIREFLECTION COATINGS MARKET
- PORTER’S FIVE FORCES MODEL
- THREAT FROM NEW ENTRANTS
- THREAT FROM SUBSTITUTES
- BARGAINING POWER OF SUPPLIERS
- BARGAINING POWER OF CUSTOMERS
- DEGREE OF COMPETITION
- INDUSTRY VALUE CHAIN ANALYSIS
- GLOBAL ANTIREFLECTION COATINGS MARKET OUTLOOK
- GLOBAL ANTIREFLECTION COATINGS MARKET BY TECHNOLOGY, 2020-2029, (USD MILLION), (KILOTONS)
- VACUUM DEPOSITION
- ELECTRONIC BEAM EVAPORATION
- SPUTTERING
- OTHERS
- GLOBAL ANTIREFLECTION COATINGS MARKET BY APPLICATION, 2020-2029, (USD MILLION), (KILOTONS)
- EYEWEAR
- ELECTRONICS
- SOLAR PANELS
- AUTOMOBILE
- OTHERS
- GLOBAL ANTIREFLECTION COATINGS MARKET BY REGION, 2020-2029, (USD MILLION), (KILOTONS)
- NORTH AMERICA
- US
- CANADA
- MEXICO
- SOUTH AMERICA
- BRAZIL
- ARGENTINA
- COLOMBIA
- REST OF SOUTH AMERICA
- EUROPE
- GERMANY
- UK
- FRANCE
- ITALY
- SPAIN
- RUSSIA
- REST OF EUROPE
- ASIA PACIFIC
- INDIA
- CHINA
- JAPAN
- SOUTH KOREA
- AUSTRALIA
- SOUTH-EAST ASIA
- REST OF ASIA PACIFIC
- MIDDLE EAST AND AFRICA
- UAE
- SAUDI ARABIA
- SOUTH AFRICA
- REST OF MIDDLE EAST AND AFRICA
- NORTH AMERICA
- COMPANY PROFILES* (BUSINESS OVERVIEW, COMPANY SNAPSHOT, PRODUCTS OFFERED, RECENT DEVELOPMENTS)
-
-
- OPTICAL COATINGS JAPAN RODENSTOCK GMBH
- ESSILOR INTERNATIONAL
- CARL ZEISS AG
- E. I. DU PONT DE NEMOURS
- KONINKLIJKE DSM N.V.
- HONEYWELL INTERNATIONAL PPG INDUSTRIES
- HOYA CORPORATION
- VIAVI SOLUTIONS, INC. *THE COMPANY LIST IS INDICATIVE
-
LIST OF TABLES
TABLE 1 GLOBAL ANTIREFLECTION COATINGS MARKET BY TECHNOLOGY (USD MILLIONS) 2020-2029
TABLE 2 GLOBAL ANTIREFLECTION COATINGS MARKET BY TECHNOLOGY (KILOTONS) 2020-2029
TABLE 3 GLOBAL ANTIREFLECTION COATINGS MARKET BY APPLICATION (USD MILLIONS) 2020-2029
TABLE 4 GLOBAL ANTIREFLECTION COATINGS MARKET BY APPLICATION (KILOTONS) 2020-2029
TABLE 5 GLOBAL ANTIREFLECTION COATINGS MARKET BY REGION (USD MILLIONS) 2020-2029
TABLE 6 GLOBAL ANTIREFLECTION COATINGS MARKET BY REGION (KILOTONS) 2020-2029
TABLE 7 US ANTIREFLECTION COATINGS MARKET BY TECHNOLOGY (USD MILLIONS) 2020-2029
TABLE 8 US ANTIREFLECTION COATINGS MARKET BY TECHNOLOGY (KILOTONS) 2020-2029
TABLE 9 US ANTIREFLECTION COATINGS MARKET BY APPLICATION (USD MILLIONS) 2020-2029
TABLE 10 US ANTIREFLECTION COATINGS MARKET BY APPLICATION (KILOTONS) 2020-2029
TABLE 11 CANADA ANTIREFLECTION COATINGS MARKET BY TECHNOLOGY (USD MILLIONS) 2020-2029
TABLE 12 CANADA ANTIREFLECTION COATINGS MARKET BY TECHNOLOGY (KILOTONS) 2020-2029
TABLE 13 CANADA ANTIREFLECTION COATINGS MARKET BY APPLICATION (USD MILLIONS) 2020-2029
TABLE 14 CANADA ANTIREFLECTION COATINGS MARKET BY APPLICATION (KILOTONS) 2020-2029
TABLE 15 MEXICO ANTIREFLECTION COATINGS MARKET BY TECHNOLOGY (USD MILLIONS) 2020-2029
TABLE 16 MEXICO ANTIREFLECTION COATINGS MARKET BY TECHNOLOGY (KILOTONS) 2020-2029
TABLE 17 MEXICO ANTIREFLECTION COATINGS MARKET BY APPLICATION (USD MILLIONS) 2020-2029
TABLE 18 MEXICO ANTIREFLECTION COATINGS MARKET BY APPLICATION (KILOTONS) 2020-2029
TABLE 19 BRAZIL ANTIREFLECTION COATINGS MARKET BY TECHNOLOGY (USD MILLIONS) 2020-2029
TABLE 20 BRAZIL ANTIREFLECTION COATINGS MARKET BY TECHNOLOGY (KILOTONS) 2020-2029
TABLE 21 BRAZIL ANTIREFLECTION COATINGS MARKET BY APPLICATION (USD MILLIONS) 2020-2029
TABLE 22 BRAZIL ANTIREFLECTION COATINGS MARKET BY APPLICATION (KILOTONS) 2020-2029
TABLE 23 ARGENTINA ANTIREFLECTION COATINGS MARKET BY TECHNOLOGY (USD MILLIONS) 2020-2029
TABLE 24 ARGENTINA ANTIREFLECTION COATINGS MARKET BY TECHNOLOGY (KILOTONS) 2020-2029
TABLE 25 ARGENTINA ANTIREFLECTION COATINGS MARKET BY APPLICATION (USD MILLIONS) 2020-2029
TABLE 26 ARGENTINA ANTIREFLECTION COATINGS MARKET BY APPLICATION (KILOTONS) 2020-2029
TABLE 27 COLOMBIA ANTIREFLECTION COATINGS MARKET BY TECHNOLOGY (USD MILLIONS) 2020-2029
TABLE 28 COLOMBIA ANTIREFLECTION COATINGS MARKET BY TECHNOLOGY (KILOTONS) 2020-2029
TABLE 29 COLOMBIA ANTIREFLECTION COATINGS MARKET BY APPLICATION (USD MILLIONS) 2020-2029
TABLE 30 COLOMBIA ANTIREFLECTION COATINGS MARKET BY APPLICATION (KILOTONS) 2020-2029
TABLE 31 REST OF SOUTH AMERICA ANTIREFLECTION COATINGS MARKET BY TECHNOLOGY (USD MILLIONS) 2020-2029
TABLE 32 REST OF SOUTH AMERICA ANTIREFLECTION COATINGS MARKET BY TECHNOLOGY (KILOTONS) 2020-2029
TABLE 33 REST OF SOUTH AMERICA ANTIREFLECTION COATINGS MARKET BY APPLICATION (USD MILLIONS) 2020-2029
TABLE 34 REST OF SOUTH AMERICA ANTIREFLECTION COATINGS MARKET BY APPLICATION (KILOTONS) 2020-2029
TABLE 35 INDIA ANTIREFLECTION COATINGS MARKET BY TECHNOLOGY (USD MILLIONS) 2020-2029
TABLE 36 INDIA ANTIREFLECTION COATINGS MARKET BY TECHNOLOGY (KILOTONS) 2020-2029
TABLE 37 INDIA ANTIREFLECTION COATINGS MARKET BY APPLICATION (USD MILLIONS) 2020-2029
TABLE 38 INDIA ANTIREFLECTION COATINGS MARKET BY APPLICATION (KILOTONS) 2020-2029
TABLE 39 CHINA ANTIREFLECTION COATINGS MARKET BY TECHNOLOGY (USD MILLIONS) 2020-2029
TABLE 40 CHINA ANTIREFLECTION COATINGS MARKET BY TECHNOLOGY (KILOTONS) 2020-2029
TABLE 41 CHINA ANTIREFLECTION COATINGS MARKET BY APPLICATION (USD MILLIONS) 2020-2029
TABLE 42 CHINA ANTIREFLECTION COATINGS MARKET BY APPLICATION (KILOTONS) 2020-2029
TABLE 43 JAPAN ANTIREFLECTION COATINGS MARKET BY TECHNOLOGY (USD MILLIONS) 2020-2029
TABLE 44 JAPAN ANTIREFLECTION COATINGS MARKET BY TECHNOLOGY (KILOTONS) 2020-2029
TABLE 45 JAPAN ANTIREFLECTION COATINGS MARKET BY APPLICATION (USD MILLIONS) 2020-2029
TABLE 46 JAPAN ANTIREFLECTION COATINGS MARKET BY APPLICATION (KILOTONS) 2020-2029
TABLE 47 SOUTH KOREA ANTIREFLECTION COATINGS MARKET BY TECHNOLOGY (USD MILLIONS) 2020-2029
TABLE 48 SOUTH KOREA ANTIREFLECTION COATINGS MARKET BY TECHNOLOGY (KILOTONS) 2020-2029
TABLE 49 SOUTH KOREA ANTIREFLECTION COATINGS MARKET BY APPLICATION (USD MILLIONS) 2020-2029
TABLE 50 SOUTH KOREA ANTIREFLECTION COATINGS MARKET BY APPLICATION (KILOTONS) 2020-2029
TABLE 51 AUSTRALIA ANTIREFLECTION COATINGS MARKET BY TECHNOLOGY (USD MILLIONS) 2020-2029
TABLE 52 AUSTRALIA ANTIREFLECTION COATINGS MARKET BY TECHNOLOGY (KILOTONS) 2020-2029
TABLE 53 AUSTRALIA ANTIREFLECTION COATINGS MARKET BY APPLICATION (USD MILLIONS) 2020-2029
TABLE 54 AUSTRALIA ANTIREFLECTION COATINGS MARKET BY APPLICATION (KILOTONS) 2020-2029
TABLE 55 SOUTH-EAST ASIA ANTIREFLECTION COATINGS MARKET BY TECHNOLOGY (USD MILLIONS) 2020-2029
TABLE 56 SOUTH-EAST ASIA ANTIREFLECTION COATINGS MARKET BY TECHNOLOGY (KILOTONS) 2020-2029
TABLE 57 SOUTH-EAST ASIA ANTIREFLECTION COATINGS MARKET BY APPLICATION (USD MILLIONS) 2020-2029
TABLE 58 SOUTH-EAST ASIA ANTIREFLECTION COATINGS MARKET BY APPLICATION (KILOTONS) 2020-2029
TABLE 59 REST OF ASIA PACIFIC ANTIREFLECTION COATINGS MARKET BY TECHNOLOGY (USD MILLIONS) 2020-2029
TABLE 60 REST OF ASIA PACIFIC ANTIREFLECTION COATINGS MARKET BY TECHNOLOGY (KILOTONS) 2020-2029
TABLE 61 REST OF ASIA PACIFIC ANTIREFLECTION COATINGS MARKET BY APPLICATION (USD MILLIONS) 2020-2029
TABLE 62 REST OF ASIA PACIFIC ANTIREFLECTION COATINGS MARKET BY APPLICATION (KILOTONS) 2020-2029
TABLE 63 GERMANY ANTIREFLECTION COATINGS MARKET BY TECHNOLOGY (USD MILLIONS) 2020-2029
TABLE 64 GERMANY ANTIREFLECTION COATINGS MARKET BY TECHNOLOGY (KILOTONS) 2020-2029
TABLE 65 GERMANY ANTIREFLECTION COATINGS MARKET BY APPLICATION (USD MILLIONS) 2020-2029
TABLE 66 GERMANY ANTIREFLECTION COATINGS MARKET BY APPLICATION (KILOTONS) 2020-2029
TABLE 67 UK ANTIREFLECTION COATINGS MARKET BY TECHNOLOGY (USD MILLIONS) 2020-2029
TABLE 68 UK ANTIREFLECTION COATINGS MARKET BY TECHNOLOGY (KILOTONS) 2020-2029
TABLE 69 UK ANTIREFLECTION COATINGS MARKET BY APPLICATION (USD MILLIONS) 2020-2029
TABLE 70 UK ANTIREFLECTION COATINGS MARKET BY APPLICATION (KILOTONS) 2020-2029
TABLE 71 FRANCE ANTIREFLECTION COATINGS MARKET BY TECHNOLOGY (USD MILLIONS) 2020-2029
TABLE 72 FRANCE ANTIREFLECTION COATINGS MARKET BY TECHNOLOGY (KILOTONS) 2020-2029
TABLE 73 FRANCE ANTIREFLECTION COATINGS MARKET BY APPLICATION (USD MILLIONS) 2020-2029
TABLE 74 FRANCE ANTIREFLECTION COATINGS MARKET BY APPLICATION (KILOTONS) 2020-2029
TABLE 75 ITALY ANTIREFLECTION COATINGS MARKET BY TECHNOLOGY (USD MILLIONS) 2020-2029
TABLE 76 ITALY ANTIREFLECTION COATINGS MARKET BY TECHNOLOGY (KILOTONS) 2020-2029
TABLE 77 ITALY ANTIREFLECTION COATINGS MARKET BY APPLICATION (USD MILLIONS) 2020-2029
TABLE 78 ITALY ANTIREFLECTION COATINGS MARKET BY APPLICATION (KILOTONS) 2020-2029
TABLE 79 SPAIN ANTIREFLECTION COATINGS MARKET BY TECHNOLOGY (USD MILLIONS) 2020-2029
TABLE 80 SPAIN ANTIREFLECTION COATINGS MARKET BY TECHNOLOGY (KILOTONS) 2020-2029
TABLE 81 SPAIN ANTIREFLECTION COATINGS MARKET BY APPLICATION (USD MILLIONS) 2020-2029
TABLE 82 SPAIN ANTIREFLECTION COATINGS MARKET BY APPLICATION (KILOTONS) 2020-2029
TABLE 83 RUSSIA ANTIREFLECTION COATINGS MARKET BY TECHNOLOGY (USD MILLIONS) 2020-2029
TABLE 84 RUSSIA ANTIREFLECTION COATINGS MARKET BY TECHNOLOGY (KILOTONS) 2020-2029
TABLE 85 RUSSIA ANTIREFLECTION COATINGS MARKET BY APPLICATION (USD MILLIONS) 2020-2029
TABLE 86 RUSSIA ANTIREFLECTION COATINGS MARKET BY APPLICATION (KILOTONS) 2020-2029
TABLE 87 REST OF EUROPE ANTIREFLECTION COATINGS MARKET BY TECHNOLOGY (USD MILLIONS) 2020-2029
TABLE 88 REST OF EUROPE ANTIREFLECTION COATINGS MARKET BY TECHNOLOGY (KILOTONS) 2020-2029
TABLE 89 REST OF EUROPE ANTIREFLECTION COATINGS MARKET BY APPLICATION (USD MILLIONS) 2020-2029
TABLE 90 REST OF EUROPE ANTIREFLECTION COATINGS MARKET BY APPLICATION (KILOTONS) 2020-2029
TABLE 91 UAE ANTIREFLECTION COATINGS MARKET BY TECHNOLOGY (USD MILLIONS) 2020-2029
TABLE 92 UAE ANTIREFLECTION COATINGS MARKET BY TECHNOLOGY (KILOTONS) 2020-2029
TABLE 93 UAE ANTIREFLECTION COATINGS MARKET BY APPLICATION (USD MILLIONS) 2020-2029
TABLE 94 UAE ANTIREFLECTION COATINGS MARKET BY APPLICATION (KILOTONS) 2020-2029
TABLE 95 SAUDI ARABIA ANTIREFLECTION COATINGS MARKET BY TECHNOLOGY (USD MILLIONS) 2020-2029
TABLE 96 SAUDI ARABIA ANTIREFLECTION COATINGS MARKET BY TECHNOLOGY (KILOTONS) 2020-2029
TABLE 97 SAUDI ARABIA ANTIREFLECTION COATINGS MARKET BY APPLICATION (USD MILLIONS) 2020-2029
TABLE 98 SAUDI ARABIA ANTIREFLECTION COATINGS MARKET BY APPLICATION (KILOTONS) 2020-2029
TABLE 99 SOUTH AFRICA ANTIREFLECTION COATINGS MARKET BY TECHNOLOGY (USD MILLIONS) 2020-2029
TABLE 100 SOUTH AFRICA ANTIREFLECTION COATINGS MARKET BY TECHNOLOGY (KILOTONS) 2020-2029
TABLE 101 SOUTH AFRICA ANTIREFLECTION COATINGS MARKET BY APPLICATION (USD MILLIONS) 2020-2029
TABLE 102 SOUTH AFRICA ANTIREFLECTION COATINGS MARKET BY APPLICATION (KILOTONS) 2020-2029
TABLE 103 REST OF MIDDLE EAST AND AFRICA ANTIREFLECTION COATINGS MARKET BY TECHNOLOGY (USD MILLIONS) 2020-2029
TABLE 104 REST OF MIDDLE EAST AND AFRICA ANTIREFLECTION COATINGS MARKET BY TECHNOLOGY (KILOTONS) 2020-2029
TABLE 105 REST OF MIDDLE EAST AND AFRICA ANTIREFLECTION COATINGS MARKET BY APPLICATION (USD MILLIONS) 2020-2029
TABLE 106 REST OF MIDDLE EAST AND AFRICA ANTIREFLECTION COATINGS MARKET BY APPLICATION (KILOTONS) 2020-2029
LIST OF FIGURES
FIGURE 1 MARKET DYNAMICS
FIGURE 2 MARKET SEGMENTATION
FIGURE 3 REPORT TIMELINES: YEARS CONSIDERED
FIGURE 4 DATA TRIANGULATION
FIGURE 5 BOTTOM-UP APPROACH
FIGURE 6 TOP-DOWN APPROACH
FIGURE 7 RESEARCH FLOW
FIGURE 8 GLOBAL ANTIREFLECTION COATINGS MARKET BY TECHNOLOGY, USD MILLION, 2020-2029
FIGURE 9 GLOBAL ANTIREFLECTION COATINGS MARKET BY APPLICATION, USD MILLION, 2020-2029
FIGURE 10 GLOBAL ANTIREFLECTION COATINGS MARKET BY REGION, USD MILLION, 2020-2029
FIGURE 11 PORTER’S FIVE FORCES MODEL
FIGURE 12 NORTH AMERICA ANTIREFLECTION COATINGS MARKET SNAPSHOT
FIGURE 13 EUROPE ANTIREFLECTION COATINGS MARKET SNAPSHOT
FIGURE 14 SOUTH AMERICA ANTIREFLECTION COATINGS MARKET SNAPSHOT
FIGURE 15 ASIA PACIFIC ANTIREFLECTION COATINGS MARKET SNAPSHOT
FIGURE 16 MIDDLE EAST ASIA AND AFRICA ANTIREFLECTION COATINGS MARKET SNAPSHOT
FIGURE 17 MARKET SHARE ANALYSIS
FIGURE 18 OPTICAL COATINGS JAPAN RODENSTOCK GMBH: COMPANY SNAPSHOT
FIGURE 19 ESSILOR INTERNATIONAL: COMPANY SNAPSHOT
FIGURE 20 CARL ZEISS AG: COMPANY SNAPSHOT
FIGURE 21 E. I. DU PONT DE NEMOURS: COMPANY SNAPSHOT
FIGURE 22 KONINKLIJKE DSM N.V.: COMPANY SNAPSHOT
FIGURE 23 HONEYWELL INTERNATIONAL PPG INDUSTRIES: COMPANY SNAPSHOT
FIGURE 24 HOYA CORPORATION: COMPANY SNAPSHOT
FIGURE 25 VIAVI SOLUTIONS, INC.: COMPANY SNAPSHOT
DOWNLOAD FREE SAMPLE REPORT
License Type
SPEAK WITH OUR ANALYST
Want to know more about the report or any specific requirement?
WANT TO CUSTOMIZE THE REPORT?
Our Clients Speak
We asked them to research ‘ Equipment market’ all over the world, and their whole arrangement was helpful to us. thehealthanalytics.com insightful analysis and reports contributed to our current analysis and in creating a future strategy. Besides, the te
Yosuke Mitsui
Senior Associate Construction Equipment Sales & Marketing
We asked them to research ‘Equipment market’ all over the world, and their whole arrangement was helpful to us. thehealthanalytics.com insightful analysis and reports contributed to our current analysis and in creating a future strategy. Besides, the te


