Report Outlook
| Market Size | CAGR | Dominating Region |
|---|---|---|
| USD 238.71 billion | 6.4% | Asia Pacific |
| By Product | By Application | By Regions |
|---|---|---|
|
|
|
SCOPE OF THE REPORT
Flat glass Market Overview
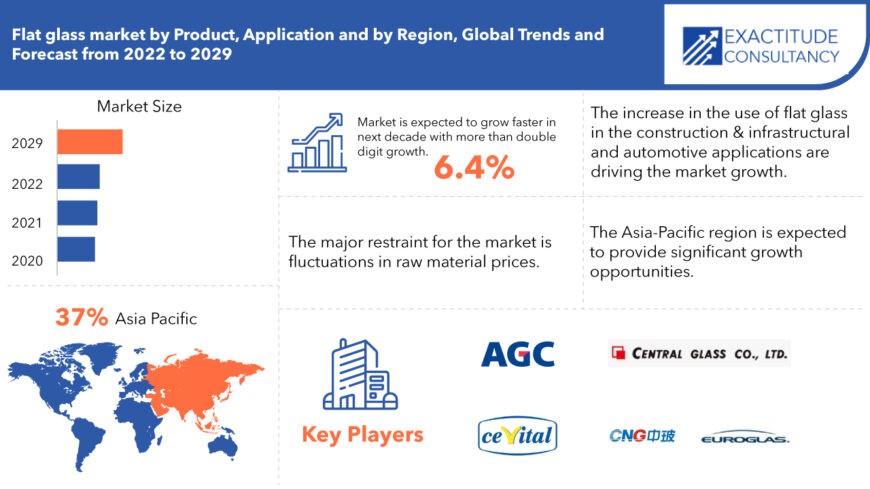
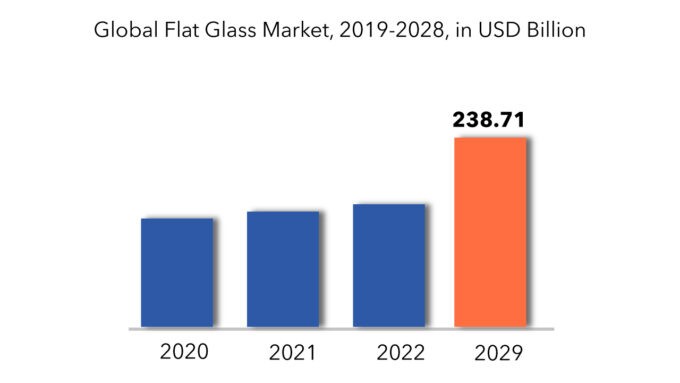
The global flat glass market size is estimated to be valued at USD 136.58 billion in 2020 and is projected to reach USD 238.71 billion by 2029, recording a CAGR of 6.4%.
Flat glass, also known as plate glass, is manufactured in a planar form and finds widespread application in glass doors, windows, windshields, and transparent walls within various sectors including automotive and architecture. Occasionally, plate glass is subjected to bending post-production to render it suitable for specific uses. Predominantly produced through the float process, most plate glass consists of soda-lime composition, characterized by elevated levels of magnesium oxide and sodium oxide relative to container glass, while exhibiting diminished proportions of calcium oxide, silica, and aluminum oxide.

The escalating awareness surrounding energy conservation has precipitated the adoption of products boasting low energy ratings and a heightened reliance on readily available natural energy sources. The incorporation of such glass in both residential and commercial structures facilitates the utilization of natural light, thereby mitigating the expense and consumption associated with artificial lighting. Governments across diverse nations have instituted regulations to incentivize energy-efficient practices within the construction domain. Structures conforming to these stringent standards for energy efficiency exhibit substantially reduced energy consumption, ranging between 40% to 60% in comparison to their non-compliant counterparts, thereby catalyzing the uptake of this glass variant and thereby fostering market expansion.
The burgeoning landscape of construction endeavors and infrastructural advancements has engendered a surge in demand for flat glass, extensively employed in roofing, window installations, facades, and as architectural accents for internal partitions. Flat glass endows buildings with commendable properties such as acoustic and thermal insulation, thereby driving its demand across the building and construction sector. Furthermore, the rapid pace of industrialization has spurred the deployment of this glass type in commercial edifices, aimed at conserving energy by maximizing natural light utilization, consequently propelling market growth trajectories.

Flat Glass Market Segment Analysis
Based on product, the global flat glass market is segmented into Basic, Tempered, Laminated and Insulated. The insulated product segment leads the global flat glass market. The demand for curtain walls, storefronts, above glazing, non-vision locations, and commercial and operable windows is expected to remain a major driver of this segment’s growth. Manufacturers have been forced to expand their manufacturing capacities in response to rising demand.
The architectural application segment accounted for majority share of total revenue. The category will increase further at a stable growth rate on account of the increasing construction activities and infrastructural projects as a result of the fast urbanization and growing population across the globe. The product has a wide range of uses in the automotive industry, including vehicle windows, doors, windshields, side panels, sunroofs, and lighting. However, due to a drop in global vehicle manufacturing, the automotive application category has seen limited development in recent years.
Flat Glass Market Players
Market players focus on growth strategies, such as new product launches, collaborations, partnerships, operational expansion, mergers & acquisitions, and awareness campaigns. Companies operating the target market can focus on partnerships and collaborations, in order to develop advanced products which in turn create lucrative growth opportunities. Few of the important market players AGC Inc, Central Glass Ltd, Cevital Group, China Glass Holding Ltd, Euroglas, Fuyao Glass Industry Group Co., Ltd, Guardian Industries, Nippon Sheet Glass Co., Ltd, Saint-Gobain and Şişecam Group.
Companies are mainly in the developing and they are competing closely with each other. Innovation is one of the most important and key strategy as it has to be for any market. However, companies in the market have also opted and successfully driven inorganic growth strategies like mergers & acquisition and so on.
Who Should Buy? Or Key Stakeholders
- Flat glass Companies
- Research Organizations
- Investors
- Regulatory Authorities
- Others
Key Takeaways:
- The global flat glass market size is estimated to be recording a CAGR of 6.4%.
- Based on product, the insulated product segment leads the global flat glass market.
- The architectural application segment accounted for majority share of total revenue.
- The major share is expected to be occupied by Asia Pacific for global flat glass market during the forecast period.
- The flat glass market is experiencing steady growth driven by increasing demand from construction and automotive industries for energy-efficient and lightweight materials.
Flat Glass Market Regional Analysis
The Flat glass Market by region includes North America, Asia-Pacific (APAC), Europe, South America, and Middle East & Africa (MEA).
- North America: includes US, Canada and Mexico
- Asia Pacific: includes China, Japan, South Korea, India, Australia, ASEAN and Rest of APAC
- Europe: includes UK, Germany, France, Italy, Spain, Russia, and Rest of Europe
- South America: includes Brazil, Argentina and Rest of South America
- Middle East & Africa: includes Turkey, UAE, Saudi Arabia, South Africa, and Rest of MEA

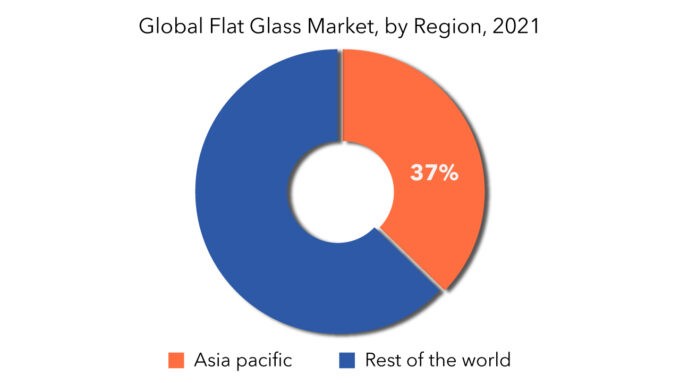
The major share is expected to be occupied by Asia Pacific for global flat glass market during the forecast period. Asia Pacific dominates the flat glass market, accounting for a huge share of the worldwide revenue. Over the forecast period, infrastructure upgrades in the region’s developing economies are likely to boost market growth. Southeast Asia is also one of the developing regional markets, with countries such as China and Japan beginning to invest there. North America’s construction activity was hampered, particularly in the first half of 2020. However, due to an increase in residential construction activity, the market in the United States saw a moderate recovery in the second half of 2020.
Key Market Segments: Flat Glass Market
Flat Glass Market by Product, 2020-2029, (USD Million) (Kilotons)
- Basic
- Tempered
- Laminated
- Insulated
Flat Glass Market by Application, 2020-2029, (In USD Million) (Kilotons)
- Architectural
- Automotive
Flat Glass Market by Regions, 2020-2029, (In USD Million) (Kilotons)
- North America
- Europe
- Asia Pacific
- South America
- Middle East And Africa
Important Countries In All Regions Are Covered.
Key Question Answered
- What is the current market size of this high growth market?
- What is the overall growth rate?
- What are the key growth areas, applications, end uses and types?
- Key reasons for growth
- Challenges for growth
- Who are the important market players in this market?
- What are the key strategies of these players?
- What technological developments are happening in this area?
Table of Content
- Introduction
- Market Definition
- Market Segmentation
- Research Timelines
- Assumptions And Limitations
- Research Methodology
- Data Mining
- Secondary Research
- Primary Research
- Subject-Matter Experts’ Advice
- Quality Checks
- Final Review
- Data Triangulation
- Bottom-Up Approach
- Top-Down Approach
- Research Flow
- Data Sources
- Data Mining
- Executive Summary
- Market Overview
- Global Flat glass Market Outlook
- Market Drivers
- Market Restraints
- Market Opportunities
- Impact Of Covid-19 On Global Flat Glass Market
- Global Flat glass Market Outlook
- Global Flat glass Market By Product, (USD Million) (Kilotons)
- Basic
- Tempered
- Laminated
- Insulated
- Global Flat glass Market By Application, (USD Million) (Kilotons)
- Architectural
- Automotive
- Global Flat glass Market By Region, (USD Million) (Kilotons)
- Introduction
- Asia-Pacific
- China
- India
- Japan
- South Korea
- Australia
- South-East Asia
- Rest Of Asia-Pacific
- North America
- United States
- Canada
- Mexico
- Europe
- Germany
- United Kingdom
- France
- Italy
- Spain
- Russia
- Rest Of Europe
- South America
- Brazil
- Argentina
- Colombia
- Rest Of South America
- Middle East And Africa
- UAE
- Saudi Arabia
- South Africa
- Rest Of Middle East And Africa
- Company Profiles* (Business Overview, Company Snapshot, Products Offered, Recent Developments)
- AGC Inc
- Central Glass Ltd
- Cevital Group
- China Glass Holding Ltd
- Euroglas
- Fuyao Glass Industry Group Co., Ltd
- Guardian Industries
- Nippon Sheet Glass Co., Ltd
- Saint-Gobain
- Şişecam Group
*The Company List Is Indicative
LIST OF TABLES
TABLE 1 GLOBAL FLAT GLASS MARKET BY PRODUCT (USD MILLIONS), 2020-2029
TABLE 2 GLOBAL FLAT GLASS MARKET BY PRODUCT (KILOTONS), 2020-2029
TABLE 3 GLOBAL FLAT GLASS MARKET BY APPLICATION (USD MILLIONS), 2020-2029
TABLE 4 GLOBAL FLAT GLASS MARKET BY APPLICATION (KILOTONS), 2020-2029
TABLE 5 GLOBAL FLAT GLASS MARKET BY REGION (USD MILLIONS), 2020-2029
TABLE 6 GLOBAL FLAT GLASS MARKET BY REGION (KILOTONS), 2020-2029
TABLE 7 NORTH AMERICA FLAT GLASS MARKET BY COUNTRY (USD MILLIONS), 2020-2029
TABLE 8 NORTH AMERICA FLAT GLASS MARKET BY COUNTRY (KILOTONS), 2020-2029
TABLE 9 US FLAT GLASS MARKET BY PRODUCT (USD MILLIONS), 2020-2029
TABLE 10 US FLAT GLASS MARKET BY PRODUCT (KILOTONS), 2020-2029
TABLE 11 US FLAT GLASS MARKET BY APPLICATION (USD MILLIONS), 2020-2029
TABLE 12 US FLAT GLASS MARKET BY APPLICATION (KILOTONS), 2020-2029
TABLE 13 CANADA FLAT GLASS MARKET BY PRODUCT (USD MILLIONS), 2020-2029
TABLE 14 CANADA FLAT GLASS MARKET BY PRODUCT (KILOTONS), 2020-2029
TABLE 15 CANADA FLAT GLASS MARKET BY APPLICATION (USD MILLIONS), 2020-2029
TABLE 16 CANADA FLAT GLASS MARKET BY APPLICATION (KILOTONS), 2020-2029
TABLE 17 MEXICO FLAT GLASS MARKET BY PRODUCT (USD MILLIONS), 2020-2029
TABLE 18 MEXICO FLAT GLASS MARKET BY PRODUCT (KILOTONS), 2020-2029
TABLE 19 MEXICO FLAT GLASS MARKET BY APPLICATION (USD MILLIONS), 2020-2029
TABLE 20 MEXICO FLAT GLASS MARKET BY APPLICATION (KILOTONS), 2020-2029
TABLE 21 SOUTH AMERICA FLAT GLASS MARKET BY COUNTRY (USD MILLIONS), 2020-2029
TABLE 22 SOUTH AMERICA FLAT GLASS MARKET BY COUNTRY (KILOTONS), 2020-2029
TABLE 23 BRAZIL FLAT GLASS MARKET BY PRODUCT (USD MILLIONS), 2020-2029
TABLE 24 BRAZIL FLAT GLASS MARKET BY PRODUCT (KILOTONS), 2020-2029
TABLE 25 BRAZIL FLAT GLASS MARKET BY APPLICATION (USD MILLIONS), 2020-2029
TABLE 26 BRAZIL FLAT GLASS MARKET BY APPLICATION (KILOTONS), 2020-2029
TABLE 27 ARGENTINA FLAT GLASS MARKET BY PRODUCT (USD MILLIONS), 2020-2029
TABLE 28 ARGENTINA FLAT GLASS MARKET BY PRODUCT (KILOTONS), 2020-2029
TABLE 29 ARGENTINA FLAT GLASS MARKET BY APPLICATION (USD MILLIONS), 2020-2029
TABLE 30 ARGENTINA FLAT GLASS MARKET BY APPLICATION (KILOTONS), 2020-2029
TABLE 31 COLOMBIA FLAT GLASS MARKET BY PRODUCT (USD MILLIONS), 2020-2029
TABLE 32 COLOMBIA FLAT GLASS MARKET BY PRODUCT (KILOTONS), 2020-2029
TABLE 33 COLOMBIA FLAT GLASS MARKET BY APPLICATION (USD MILLIONS), 2020-2029
TABLE 34 COLOMBIA FLAT GLASS MARKET BY APPLICATION (KILOTONS), 2020-2029
TABLE 35 REST OF SOUTH AMERICA FLAT GLASS MARKET BY PRODUCT (USD MILLIONS), 2020-2029
TABLE 36 REST OF SOUTH AMERICA FLAT GLASS MARKET BY PRODUCT (KILOTONS), 2020-2029
TABLE 37 REST OF SOUTH AMERICA FLAT GLASS MARKET BY APPLICATION (USD MILLIONS), 2020-2029
TABLE 38 REST OF SOUTH AMERICA FLAT GLASS MARKET BY APPLICATION (KILOTONS), 2020-2029
TABLE 39 ASIA-PACIFIC FLAT GLASS MARKET BY COUNTRY (USD MILLIONS), 2020-2029
TABLE 40 ASIA-PACIFIC FLAT GLASS MARKET BY COUNTRY (KILOTONS), 2020-2029
TABLE 41 INDIA FLAT GLASS MARKET BY PRODUCT (USD MILLIONS), 2020-2029
TABLE 42 INDIA FLAT GLASS MARKET BY PRODUCT (KILOTONS), 2020-2029
TABLE 43 INDIA FLAT GLASS MARKET BY APPLICATION (USD MILLIONS), 2020-2029
TABLE 44 INDIA FLAT GLASS MARKET BY APPLICATION (KILOTONS), 2020-2029
TABLE 45 CHINA FLAT GLASS MARKET BY PRODUCT (USD MILLIONS), 2020-2029
TABLE 46 CHINA FLAT GLASS MARKET BY PRODUCT (KILOTONS), 2020-2029
TABLE 47 CHINA FLAT GLASS MARKET BY APPLICATION (USD MILLIONS), 2020-2029
TABLE 48 CHINA FLAT GLASS MARKET BY APPLICATION (KILOTONS), 2020-2029
TABLE 49 JAPAN FLAT GLASS MARKET BY PRODUCT (USD MILLIONS), 2020-2029
TABLE 50 JAPAN FLAT GLASS MARKET BY PRODUCT (KILOTONS), 2020-2029
TABLE 51 JAPAN FLAT GLASS MARKET BY APPLICATION (USD MILLIONS), 2020-2029
TABLE 52 JAPAN FLAT GLASS MARKET BY APPLICATION (KILOTONS), 2020-2029
TABLE 53 SOUTH KOREA FLAT GLASS MARKET BY PRODUCT (USD MILLIONS), 2020-2029
TABLE 54 SOUTH KOREA FLAT GLASS MARKET BY PRODUCT (KILOTONS), 2020-2029
TABLE 55 SOUTH KOREA FLAT GLASS MARKET BY APPLICATION (USD MILLIONS), 2020-2029
TABLE 56 SOUTH KOREA FLAT GLASS MARKET BY APPLICATION (KILOTONS), 2020-2029
TABLE 57 AUSTRALIA FLAT GLASS MARKET BY PRODUCT (USD MILLIONS), 2020-2029
TABLE 58 AUSTRALIA FLAT GLASS MARKET BY PRODUCT (KILOTONS), 2020-2029
TABLE 59 AUSTRALIA FLAT GLASS MARKET BY APPLICATION (USD MILLIONS), 2020-2029
TABLE 60 AUSTRALIA FLAT GLASS MARKET BY APPLICATION (KILOTONS), 2020-2029
TABLE 61 SOUTH-EAST ASIA FLAT GLASS MARKET BY PRODUCT (USD MILLIONS), 2020-2029
TABLE 62 SOUTH-EAST ASIA FLAT GLASS MARKET BY PRODUCT (KILOTONS), 2020-2029
TABLE 63 SOUTH-EAST ASIA FLAT GLASS MARKET BY APPLICATION (USD MILLIONS), 2020-2029
TABLE 64 SOUTH-EAST ASIA FLAT GLASS MARKET BY APPLICATION (KILOTONS), 2020-2029
TABLE 65 REST OF ASIA PACIFIC FLAT GLASS MARKET BY PRODUCT (USD MILLIONS), 2020-2029
TABLE 66 REST OF ASIA PACIFIC FLAT GLASS MARKET BY PRODUCT (KILOTONS), 2020-2029
TABLE 67 REST OF ASIA PACIFIC FLAT GLASS MARKET BY APPLICATION (USD MILLIONS), 2020-2029
TABLE 68 REST OF ASIA PACIFIC FLAT GLASS MARKET BY APPLICATION (KILOTONS), 2020-2029
TABLE 69 EUROPE FLAT GLASS MARKET BY COUNTRY (USD MILLIONS), 2020-2029
TABLE 70 EUROPE FLAT GLASS MARKET BY COUNTRY (KILOTONS), 2020-2029
TABLE 71 GERMANY FLAT GLASS MARKET BY PRODUCT (USD MILLIONS), 2020-2029
TABLE 72 GERMANY FLAT GLASS MARKET BY PRODUCT (KILOTONS), 2020-2029
TABLE 73 GERMANY FLAT GLASS MARKET BY APPLICATION (USD MILLIONS), 2020-2029
TABLE 74 GERMANY FLAT GLASS MARKET BY APPLICATION (KILOTONS), 2020-2029
TABLE 75 UK FLAT GLASS MARKET BY PRODUCT (USD MILLIONS), 2020-2029
TABLE 76 UK FLAT GLASS MARKET BY PRODUCT (KILOTONS), 2020-2029
TABLE 77 UK FLAT GLASS MARKET BY APPLICATION (USD MILLIONS), 2020-2029
TABLE 78 UK FLAT GLASS MARKET BY APPLICATION (KILOTONS), 2020-2029
TABLE 79 FRANCE FLAT GLASS MARKET BY PRODUCT (USD MILLIONS), 2020-2029
TABLE 80 FRANCE FLAT GLASS MARKET BY PRODUCT (KILOTONS), 2020-2029
TABLE 81 FRANCE FLAT GLASS MARKET BY APPLICATION (USD MILLIONS), 2020-2029
TABLE 82 FRANCE FLAT GLASS MARKET BY APPLICATION (KILOTONS), 2020-2029
TABLE 83 ITALY FLAT GLASS MARKET BY PRODUCT (USD MILLIONS), 2020-2029
TABLE 84 ITALY FLAT GLASS MARKET BY PRODUCT (KILOTONS), 2020-2029
TABLE 85 ITALY FLAT GLASS MARKET BY APPLICATION (USD MILLIONS), 2020-2029
TABLE 86 ITALY FLAT GLASS MARKET BY APPLICATION (KILOTONS), 2020-2029
TABLE 87 SPAIN FLAT GLASS MARKET BY PRODUCT (USD MILLIONS), 2020-2029
TABLE 88 SPAIN FLAT GLASS MARKET BY PRODUCT (KILOTONS), 2020-2029
TABLE 89 SPAIN FLAT GLASS MARKET BY APPLICATION (USD MILLIONS), 2020-2029
TABLE 90 SPAIN FLAT GLASS MARKET BY APPLICATION (KILOTONS), 2020-2029
TABLE 91 RUSSIA FLAT GLASS MARKET BY PRODUCT (USD MILLIONS), 2020-2029
TABLE 92 RUSSIA FLAT GLASS MARKET BY PRODUCT (KILOTONS), 2020-2029
TABLE 93 RUSSIA FLAT GLASS MARKET BY APPLICATION (USD MILLIONS), 2020-2029
TABLE 94 RUSSIA FLAT GLASS MARKET BY APPLICATION (KILOTONS), 2020-2029
TABLE 95 REST OF EUROPE FLAT GLASS MARKET BY PRODUCT (USD MILLIONS), 2020-2029
TABLE 96 REST OF EUROPE FLAT GLASS MARKET BY PRODUCT (KILOTONS), 2020-2029
TABLE 97 REST OF EUROPE FLAT GLASS MARKET BY APPLICATION (USD MILLIONS), 2020-2029
TABLE 98 REST OF EUROPE FLAT GLASS MARKET BY APPLICATION (KILOTONS), 2020-2029
TABLE 99 MIDDLE EAST AND AFRICA FLAT GLASS MARKET BY COUNTRY (USD MILLIONS), 2020-2029
TABLE 100 MIDDLE EAST AND AFRICA FLAT GLASS MARKET BY COUNTRY (KILOTONS), 2020-2029
TABLE 101 UAE FLAT GLASS MARKET BY PRODUCT (USD MILLIONS), 2020-2029
TABLE 102 UAE FLAT GLASS MARKET BY PRODUCT (KILOTONS), 2020-2029
TABLE 103 UAE FLAT GLASS MARKET BY APPLICATION (USD MILLIONS), 2020-2029
TABLE 104 UAE FLAT GLASS MARKET BY APPLICATION (KILOTONS), 2020-2029
TABLE 105 SAUDI ARABIA FLAT GLASS MARKET BY PRODUCT (USD MILLIONS), 2020-2029
TABLE 106 SAUDI ARABIA FLAT GLASS MARKET BY PRODUCT (KILOTONS), 2020-2029
TABLE 107 SAUDI ARABIA FLAT GLASS MARKET BY APPLICATION (USD MILLIONS), 2020-2029
TABLE 108 SAUDI ARABIA FLAT GLASS MARKET BY APPLICATION (KILOTONS), 2020-2029
TABLE 109 SOUTH AFRICA FLAT GLASS MARKET BY PRODUCT (USD MILLIONS), 2020-2029
TABLE 110 SOUTH AFRICA FLAT GLASS MARKET BY PRODUCT (KILOTONS), 2020-2029
TABLE 111 SOUTH AFRICA FLAT GLASS MARKET BY APPLICATION (USD MILLIONS), 2020-2029
TABLE 112 SOUTH AFRICA FLAT GLASS MARKET BY APPLICATION (KILOTONS), 2020-2029
TABLE 113 REST OF MIDDLE EAST AND AFRICA FLAT GLASS MARKET BY PRODUCT (USD MILLIONS), 2020-2029
TABLE 114 REST OF MIDDLE EAST AND AFRICA FLAT GLASS MARKET BY PRODUCT (KILOTONS), 2020-2029
TABLE 115 REST OF MIDDLE EAST AND AFRICA FLAT GLASS MARKET BY APPLICATION (USD MILLIONS), 2020-2029
TABLE 116 REST OF MIDDLE EAST AND AFRICA FLAT GLASS MARKET BY APPLICATION (KILOTONS), 2020-2029
LIST OF FIGURES
FIGURE 1 MARKET DYNAMICS
FIGURE 2 MARKET SEGMENTATION
FIGURE 3 REPORT TIMELINES: YEARS CONSIDERED
FIGURE 4 DATA TRIANGULATION
FIGURE 5 BOTTOM-UP APPROACH
FIGURE 6 TOP-DOWN APPROACH
FIGURE 7 RESEARCH FLOW
FIGURE 8 GLOBAL FLAT GLASS MARKET BY PRODUCT, USD MILLION, 2020-2029
FIGURE 9 GLOBAL FLAT GLASS MARKET BY APPLICATION, USD MILLION, 2020-2029
FIGURE 10 GLOBAL FLAT GLASS MARKET BY REGION, USD MILLION, 2020-2029
FIGURE 11 PORTER’S FIVE FORCES MODEL
FIGURE 12 GLOBAL FLAT GLASS MARKET BY PRODUCT, USD MILLION, 2020-2029
FIGURE 13 GLOBAL FLAT GLASS MARKET BY APPLICATION, USD MILLION, 2020-2029
FIGURE 14 GLOBAL FLAT GLASS MARKET BY REGION, USD MILLION, 2020-2029
FIGURE 15 FLAT GLASS MARKET BY REGION 2020
FIGURE 16 MARKET SHARE ANALYSIS
FIGURE 17 AGC INC: COMPANY SNAPSHOT
FIGURE 18 CENTRAL GLASS LTD: COMPANY SNAPSHOT
FIGURE 19 CEVITAL GROUP: COMPANY SNAPSHOT
FIGURE 20 CHINA GLASS HOLDING LTD: COMPANY SNAPSHOT
FIGURE 21 EUROGLAS: COMPANY SNAPSHOT
FIGURE 22 FUYAO GLASS INDUSTRY GROUP CO., LTD: COMPANY SNAPSHOT
FIGURE 23 GUARDIAN INDUSTRIES: COMPANY SNAPSHOT
FIGURE 24 NIPPON SHEET GLASS CO., LTD: COMPANY SNAPSHOT
FIGURE 25 SAINT-GOBAIN: COMPANY SNAPSHOT
FIGURE 26 ŞIŞECAM GROUP: COMPANY SNAPSHOT
In-Depth Database
Our Report’s database covers almost all topics of all regions over the Globe.
Recognised Publishing Sources
Tie ups with top publishers around the globe.
Customer Support
Complete pre and post sales
support.
Safe & Secure
Complete secure payment
process.
