

Base Year Value ()
x.x %
x.x %
CAGR ()
x.x %
x.x %
Forecast Year Value ()
x.x %
x.x %
Historical Data Period
Largest Region
Forecast Period
Globaler Markt für feuerfestes Glas nach Typ (laminiert, keramisch, gehärtet, verdrahtet), Anwendung (Automobil, Bauwesen, Brandbekämpfung, Verteidigung und Marine) und Endverbrauchsindustrie (Automobil, Brandbekämpfung, Verteidigung und Marine) und Region, globale Trends und Prognose von 2022 bis 2029
Instant access to hundreds of data points and trends
- Market estimates from 2014-2029
- Competitive analysis, industry segmentation, financial benchmarks
- Incorporates SWOT, Porter's Five Forces and risk management frameworks
- PDF report or online database with Word, Excel and PowerPoint export options
- 100% money back guarantee
Übersicht – Markt für feuerfestes Glas
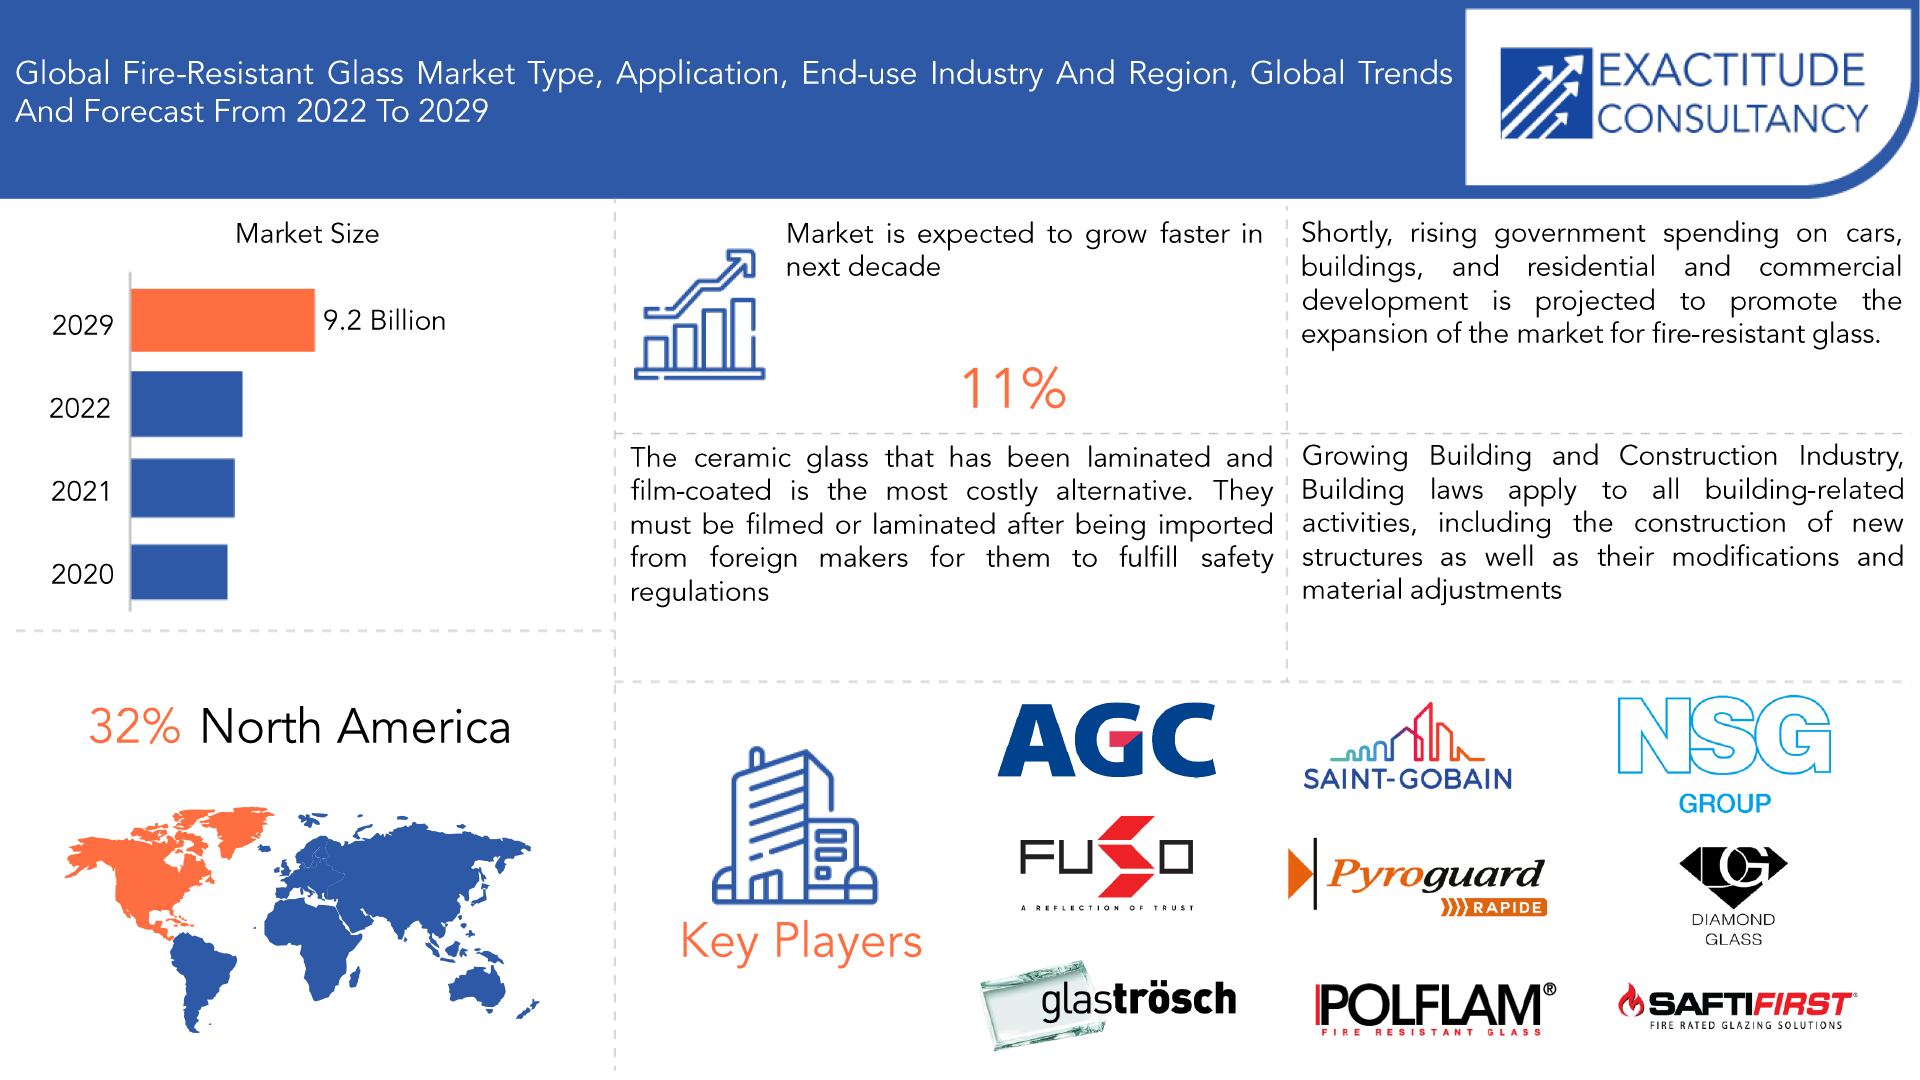
Der globale Markt für feuerfestes Glas soll von 2022 bis 2029 um durchschnittlich 11 % jährlich wachsen. Es wird erwartet, dass der Marktwert von 9,2 Milliarden US-Dollar im Jahr 2029 auf über 4,5 Milliarden US-Dollar im Jahr 2022 ansteigt.
Im Prognosezeitraum wird erwartet, dass die zunehmende Zahl von Brandunfällen und die Expansion der Baubranche das Marktwachstum beschleunigen werden. Weltweit investieren nationale Regierungen mehr Geld, um den Brandschutz aller Arten von Gebäuden, einschließlich Wohn- und Geschäftsgebäuden, zu verbessern, als Reaktion auf die Zunahme von Brandvorfällen. Darüber hinaus hat die Bevölkerungsverschiebung in städtische Wirtschaftszentren die Nachfrage nach Hochhäusern und städtischen Wohnprojekten erhöht, was zur Schaffung einer Vielzahl von Wohnprojekten mit angemessenen Brandschutzkriterien geführt hat. Im Laufe des Prognosezeitraums werden diese Faktoren wahrscheinlich den Markt antreiben.
Dies hat das öffentliche Bewusstsein für die Notwendigkeit geschärft, in Gebäuden Brandschutzausrüstungen zu installieren, was in den kommenden Jahren voraussichtlich die Nachfrage nach feuerfestem Glas im Land erhöhen wird. Außerdem wird erwartet, dass der Markt im Prognosezeitraum aufgrund der steigenden Kaufkraft der Verbraucher und der Zunahme von Brandvorfällen in den letzten Jahren wachsen wird. Die Militärausgaben steigen und es gibt eine wachsende Nachfrage aus dem Kfz-Ersatzteilmarkt, was der Branche ebenfalls beim Wachstum hilft.
| ATTRIBUT | DETAILS |
| Studiendauer | 2022–2029 |
| Basisjahr | 2021 |
| Geschätztes Jahr | 2022 |
| Voraussichtliches Jahr | 2022–2029 |
| Historischer Zeitraum | 2018-2022 |
| Einheit | Wert (Milliarden USD ), (Millionen Quadratfuß) |
| Segmentierung | Nach Typ, Anwendung, Endbenutzerbranche und Region. |
| Nach Typ |
|
| Nach Anwendung |
|
| Nach Endverbraucherbranche |
|
| Nach Region |
|
Aufgrund seiner besonderen Eigenschaften, wie der Verhinderung der Ausbreitung von Rauch, Hitze und Feuer, wird Brandschutzglas in der Bauindustrie in Bauteilen wie Fenstern , Verglasungen und Türen eingesetzt; dies ist der Haupttreiber der Marktnachfrage. In den Vereinigten Staaten wurde die durchschnittliche monatliche Investition in ein neues Privatgebäude prognostiziert.
Die Expansion des Marktes wird voraussichtlich durch strenge staatliche Vorschriften für die Produktion von feuerfestem Glas sowie durch die steigenden Kosten der zur Glasherstellung verwendeten Rohstoffe eingeschränkt. Der Aufstieg der feuerfesten Glasindustrie wird hingegen wahrscheinlich durch erhöhte staatliche Ausgaben für die Rüstungsindustrie gefördert.
Fast 40 % des gesamten Umsatzes im Jahr 2022 stammten aus dem Keramikbereich. Der hohe Prozentsatz kann auf Isolierglaskomponenten zurückzuführen sein, die im Wohn- und Gewerbebau immer beliebter werden und eine Feuerbeständigkeit von 20 Minuten bis 3 Stunden aufweisen und den Thermoschock von Wasser aus Feuerwehrschläuchen und Wassersprinklern überstehen können. Im Verlauf des Prognosezeitraums wird daher erwartet, dass das Segmentwachstum durch die günstigen Eigenschaften von Keramikglas verstärkt wird.
Die COVID-19-Epidemie verursachte 2022 einen Marktrückgang. Die Pandemie betraf jeden Marktteilnehmer entlang der Wertschöpfungskette der Branche. Die Krise brachte neue Schwierigkeiten mit sich, wie Schwankungen der Rohstoffpreise, Arbeitslosigkeit, geringe Produktion, erforderliche Werksschließungen und Verzögerungen in der Logistik, die die Marktexpansion während der Krise behinderten. In der zweiten Hälfte des Jahres 2022 begann die Erholung des Marktszenarios. Bis Mai oder Juni 2022 waren alle Produktionsanlagen, Logistikzentren, Lieferketten und Projektstandorte geschlossen. Danach begannen die Unternehmen, ihre Geschäftstätigkeit auszuweiten. Die Branchen arbeiten härter daran, die Verluste auszugleichen, die sie 2022 erlitten haben.
Aufgrund seiner vielfältigen Einsatzmöglichkeiten in Brandschutztüren, die für Brandschutz sorgen sollen, steigt die Nachfrage nach gehärtetem Glas weltweit. Die Außenschicht dieses Glases ist mit einer speziellen Beschichtung versehen, die einen Teil der Wärme reflektiert und die Wärmemenge verringert, die durch das Glas dringt. Die Nachfrage nach feuerfestem Glas dürfte daher durch erhebliche Investitionen in gehobene Wohn- und Gewerbebauten getrieben werden. Aufgrund seiner hohen Festigkeit und Härte wird Architekturglas in der Baubranche häufig eingesetzt. Weitere Faktoren, die der Branche Auftrieb verleihen, sind die Einhaltung von Bauvorschriften und die zunehmende Betonung der Regulierungsbehörden auf die Verbesserung der Brandschutzanforderungen in Gebäuden.
[Bildunterschrift id="attachment_18366" align="aligncenter" width="1920"]
Frequently Asked Questions
• What is the worth of the global fire-resistant glass market?
The global Fire-resistant glass market is designed to grow at 11 % CAGR from 2022 to 2029. It is expected to reach above USD 4.5 Billion by 2029 from USD 9.2 Billion in 2022.
• What are the key factors influencing the growth of the fire-resistant glass market?
Over the projection period, it is anticipated that the growing incidence of fire accidents and expansion in the construction industry will accelerate market growth. Globally, national governments are investing more money to boost the fire safety of all types of buildings, including residential and commercial ones, in response to an increase in fire-related incidents.
• What are some of the market's driving forces?
Due to its special characteristics, such as preventing the spread of smoke, heat, and fire, fire-resistant glasses are employed in the construction industry in components such as windows, glazing, and doors; this is the main driver driving the market demand. In the United States, the average monthly investment on a new private building was projected.
• Which are the top companies to hold the market share in the Fire-resistant glass market?
The economic landscape of the industry has also been surveyed with some of the key players being AGC Inc., Compagnie De Saint Gobain S.A., Fuso Glass India Pvt. Ltd., Nippon Sheet Glass Co. Ltd., Pyroguard Engineers Pvt. Ltd., Promat International NV (Etex Group), Ravensby Glass Co. Ltd. (Malcolm, Ogilvie & Co. Ltd. Group), Schott AG (Carl-Zeiss-Stiftung), Softy First Fire Rated Glazing Solutions (O'Keeffe's Inc.) and Technical Glass Products Inc. (Allegion Plc).
• What is the leading Application of the fire-resistant glass market?
Because of its many potentials uses in fire doors, which are intended to provide fire safety, tempered glass is experiencing an increase in demand on a global scale. The outer layer of this glass has a specific coating put to it to reflect some heat and lessen the amount of heat that passes through the glass. The demand for fire-resistant glass is therefore likely to be driven by significant investments in upmarket residential and commercial constructions. Due to its high strength and hardness, architectural glass is widely employed in the building and construction industry. Other factors boosting the industry include the adherence to building codes and the increasing emphasis regulatory bodies are placing on enhancing fire safety requirements in structures.
• Which is the largest regional market for Fire-resistant glass market?
The market for fire-rated glass worldwide is dominated by North America, which is anticipated to expand throughout the projected period. The regional market is propelled by expanding consumer purchasing power, increased infrastructure expenditures, and a greater emphasis on enhancing building and commercial apartment fire safety regulations by regulatory and governmental bodies.
Segment Analysis- Fire Resistant Glass Market
Automotive, aerospace, military & defense, and other applications are included in the others segment. The need for safety glass, which complies with the stringent flammability and structural airworthiness criteria for aviation uses in windows, cabin dividers, and glass screens are expected to increase as the automobile sector places an increasing emphasis on its incorporation.
There is a larger danger of fire explosion mishaps in maritime applications because vessels are exposed to rough seas, strong winds, noise, and extreme temperature extremes, especially offshore vessels. Rising safety concerns about vessel containers sinking in the event of a fire outbreak have led to an increase in the use of fire-resistant glass products in the marine industry.
Gel-filled glass consists of two or more layers of glass, with a translucent gel that reacts to a specific temperature filling the gap between the layers of glass. The use of gel-filled fire-resistance glass is increased by regulatory support meant to encourage the use of passive fire products. Over the forecast period, this trend is anticipated to expand the application of passive fire protection in conjunction with gel-based lightweight fire-resistant glass.
With a market share of almost 32% in 2022, North America was the region with the largest growth rate (CAGR) over the projection period. The regional market is being driven by factors such as an increase in infrastructure investments, rising consumer spending power, and increased attention on upgrading building and commercial apartment fire safety regulations by regulatory and governmental agencies.
[caption id="attachment_18369" align="aligncenter" width="1920"]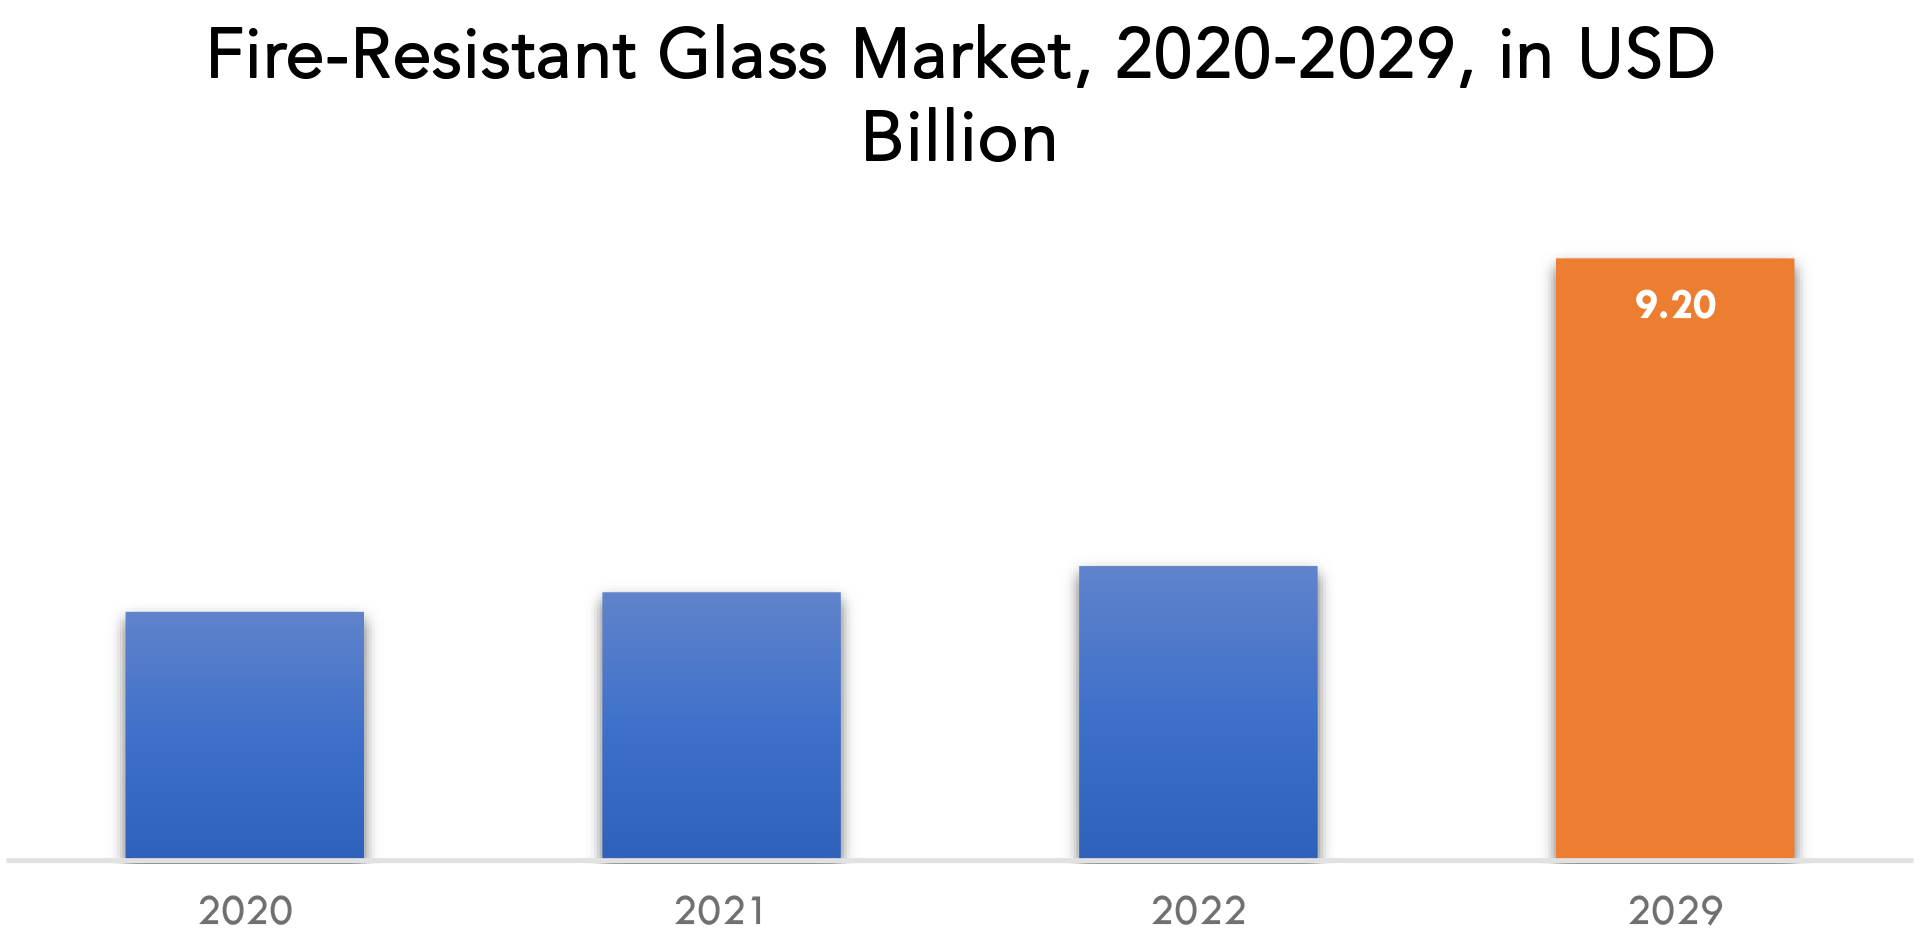
Market Players: Fire-Resistance Glass Market
The economic landscape of the industry has also been surveyed with some of the key players being AGC Inc., Compagnie De Saint Gobain S.A., Fuso Glass India Pvt. Ltd., Nippon Sheet Glass Co. Ltd., Pyroguard Engineers Pvt. Ltd., Promat International NV (Etex Group), Ravensby Glass Co. Ltd. (Malcolm, Ogilvie & Co. Ltd. Group), Schott AG (Carl-Zeiss-Stiftung), Softy First Fire Rated Glazing Solutions (O'Keeffe's Inc.) and Technical Glass Products Inc. (Allegion Plc).
For corporate expansion, these key leaders are implementing strategic formulations such as new product development and commercialization, commercial expansion, and distribution agreements. Moreover, these participants are substantially spending on product development, which is fueling revenue generation.
Industry Development:
- March 2023 - Leading producer of glass, chemicals, and high-tech materials AGC (AGC Inc., Tokyo headquarters, Yoshinori Hirai, president) has announced that it has decided to increase its production capacity for fluorochemical products in order to meet the high demand, such as for semiconductor-related applications. Operation of the expansion, which will cost around 35 billion yen, is expected to start in the second quarter of 2025 at the AGC Chiba Plant in Ichihara City, Chiba Prefecture, Japan.
- March 2023 - Saint-Gobain Weber's 3D printing business unit has developed a new digital tool for creating personalized stairs fast and effectively using 3D concrete printing, a cutting-edge method that conserves resources and CO2.
- March 2023 - NSG company is happy to report that, for the second year in a row, CDP*1, an international non-governmental organization that strives to disclose information on environmental consequences, has recognized it as a "Supplier Engagement Leader," the highest-ranking in the Supplier Engagement Assessment.
Who Should Buy? Or Key stakeholders
- Investors
- Technology Companies
- Research Organizations
- Automotive industries
- Regulatory Authorities
- Institutional & retail players
- Others
Regional Analysis- Fire-resistant Glass Market
The Fire-resistant glass market by region includes North America, Asia-Pacific (APAC), Europe, South America, and Middle East & Africa (MEA).
- North America: includes the US, Canada, Mexico
- Asia Pacific: includes China, Japan, South Korea, India, Australia, ASEAN, and Rest of APAC
- Europe: includes the UK, Germany, France, Italy, Spain, Russia, and the Rest of Europe
- South America: includes Brazil, Argentina, and Rest of South America
- Middle East & Africa: includes Turkey, UAE, Saudi Arabia, South Africa, and the Rest of MEA
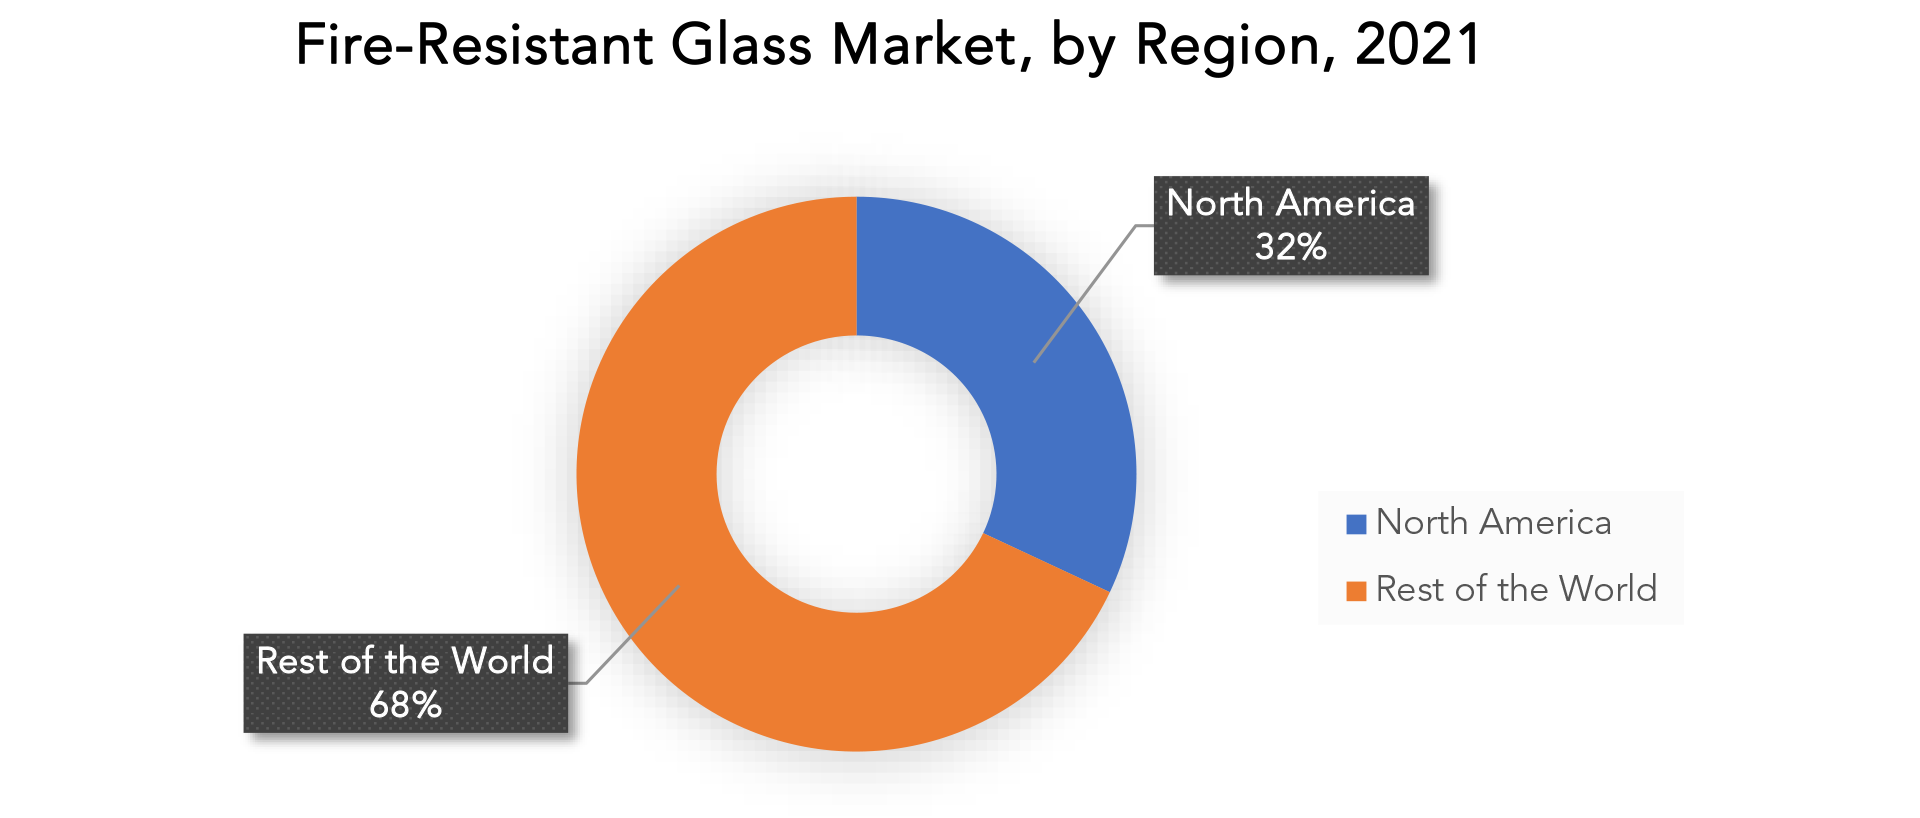
The market for fire-rated glass worldwide is dominated by North America, which is anticipated to expand throughout the projected period. The regional market is propelled by expanding consumer purchasing power, increased infrastructure expenditures, and a greater emphasis on enhancing building and commercial apartment fire safety regulations by regulatory and governmental bodies. In the following years, it is anticipated that the North American market for fire-rated glass would expand noticeably due to the rising usage of modern fire-rated glazing to enhance external and interior aesthetics.
While this makes it feasible for designers to build warm, open spaces in regions that need to be safeguarded from fire, regional expansion is being driven by the expanding number of applicable rules being produced. For instance, the IBC governs the use of fire-rated glass in the United States (International Building Code).
As the region's building activity rises and fire mishaps become more common, product consumption is projected to rise, particularly in emerging nations. For instance, by the US International Trade Administration. Cost increases and a rise in the use of these glasses in the development of infrastructure for homes and businesses will be the main drivers of market expansion in this sector. The market in the region is being driven by increased foreign investment as a result of the growth of production facilities across a range of end-user sectors and growing living standards.
Key Market Segments: Fire-Resistant Glass Market
Fire-Resistant Glass Market By Type, 2022-2029, (USD Billion), (Million Square Ft)- Laminated
- Ceramic
- Tempered
- Wired
- Building & Construction
- Marine
- Fire-Fighting
- Defense
- Others
- Automotive
- Fire-Fighting
- Defense
- Marine
- Construction
- North America
- Asia Pacific
- Europe
- South America
- Middle East And Africa
Exactitude Consultancy Services Key Objectives:
- Increasing sales and market share
- Developing new technology
- Improving profitability
- Entering new markets
- Enhancing brand reputation
Key Question Answered
- What is the expected growth rate of the fire-resistant glass market over the next 7 years?
- What are the end-user industries driving demand for the market and what is their outlook?
- What are the opportunities for growth in emerging markets such as Asia-Pacific, the Middle East, and Africa?
- How is the economic environment affecting the fire-resistant glass market, including factors such as interest rates, inflation, and exchange rates?
- What is the expected impact of government policies and regulations on the fire-resistant glass market?
- What are the key drivers of growth in the fire-resistant glass market?
- Who are the market’s major players, and what is their market share?
- What are the fire-resistant glass market's distribution channels and supply chain dynamics?
- What are the technological advancements and innovations in the fire-resistant glass market and their impact on product development and growth?
- What are the regulatory considerations and their impact on the market?
- What are the challenges faced by players in the fire-resistant glass market and how are they addressing these challenges?
- What are the opportunities for growth and expansion in the fire-resistant glass market?
- What is the pricing trend of fire-resistant glass in the market and what is the impact of raw material prices on the price trend?
- EINFÜHRUNG
- MARKTDEFINITION
- MARKTSEGMENTIERUNG
- FORSCHUNGSZEITPLAN
- ANNAHMEN UND EINSCHRÄNKUNGEN
- FORSCHUNGSMETHODIK
- DATENMINING
- Sekundärforschung
- PRIMÄRFORSCHUNG
- RAT VON FACHEXPERTEN
- QUALITÄTSPRÜFUNGEN
- ABSCHLIESSENDE ÜBERPRÜFUNG
- DATENTRIANGULATION
- Bottom-Up-Ansatz
- TOP-DOWN-ANSATZ
- FORSCHUNGSABLAUF
- DATENQUELLEN
- DATENMINING
- ZUSAMMENFASSUNG
- MARKTÜBERSICHT
- GLOBALER MARKTAUSBLICK FÜR BRANDSCHUTZGLAS
- MARKTTREIBER
- Marktbeschränkungen
- Marktchancen
- Auswirkungen von COVID-19 auf den Markt für Brandschutzglas
- PORTERS FÜNF-KRÄFTE-MODELL
- Bedrohung durch Neueinsteiger
- THREAT FROM SUBSTITUTES
- BARGAINING POWER OF SUPPLIERS
- BARGAINING POWER OF CUSTOMERS
- DEGREE OF COMPETITION
- INDUSTRY VALUE CHAIN ANALYSIS
- GLOBALER MARKTAUSBLICK FÜR BRANDSCHUTZGLAS
- GLOBAL FIRE-RESISTANT GLASS MARKET BY TYPE, 2022-2029, (USD BILLION), (MILLION SQUARE FT)
- LAMINATED
- CERAMIC
- TEMPERED
- WIRED
- GLOBAL FIRE-RESISTANT GLASS MARKET BY APPLICATION, 2022-2029, (USD BILLION), (MILLION SQUARE FT)
- BUILDING & CONSTRUCTION
- MARINE
- FIRE-FIGHTING
- DEFENSE
- OTHERS
- GLOBAL FIRE-RESISTANT GLASS MARKET BY END-USER INDUSTRY, 2022-2029, (USD BILLION), (MILLION SQUARE FT)
- AUTOMOTIVE
- FIRE-FIGHTING
- DEFENSE
- MARINE
- CONSTRUCTION
- GLOBAL FIRE-RESISTANT GLASS MARKET BY REGION, 2022-2029, (USD BILLION), (MILLION SQUARE FT)
- NORTH AMERICA
- US
- CANADA
- MEXICO
- SOUTH AMERICA
- BRAZIL
- ARGENTINA
- COLOMBIA
- REST OF SOUTH AMERICA
- EUROPE
- GERMANY
- UK
- FRANCE
- ITALY
- SPAIN
- RUSSIA
- REST OF EUROPE
- ASIA PACIFIC
- INDIA
- CHINA
- JAPAN
- SOUTH KOREA
- AUSTRALIA
- SOUTH-EAST ASIA
- REST OF ASIA PACIFIC
- MIDDLE EAST AND AFRICA
- UAE
- SAUDI ARABIA
- SOUTH AFRICA
- REST OF MIDDLE EAST AND AFRICA
- NORTH AMERICA
- COMPANY PROFILES*
(BUSINESS OVERVIEW, COMPANY SNAPSHOT, PRODUCTS OFFERED, RECENT DEVELOPMENTS)
- AGC INC
- COMPAGINE DE SAINT GOBAIN S.A
- FUSO GLASS INDIA PVD. LTD
- 9NIPPON SHEET GLASS
- PLAYGROUND ENGINEERS PVT.LTD
- PROMAT INTERNATIONAL NV
- RAVENSBY GLASS
- SCHOTT AG
- SOFTY FIRST FIRE-RATED GAZING SOLUTIONS
- TECHNICAL GLASS PRODUCTS INC
*THE COMPANY LIST IS INDICATIVE
LIST OF TABLES
TABLE 1 GLOBAL FIRE-RESISTANT GLASS MARKET BY TYPE (USD BILLION) 2022-2029
TABLE 2 GLOBAL FIRE-RESISTANT GLASS MARKET BY TYPE (MILLION SQUARE FT) 2022-2029
TABLE 3 GLOBAL FIRE-RESISTANT GLASS MARKET BY APPLICATION (USD BILLION) 2022-2029
TABLE 4 GLOBAL FIRE-RESISTANT GLASS MARKET BY APPLICATION (MILLION SQUARE FT) 2022-2029
TABLE 5 GLOBAL FIRE-RESISTANT GLASS MARKET BY END USER (USD BILLION) 2022-2029
TABLE 6 GLOBAL FIRE-RESISTANT GLASS MARKET BY END USER (MILLION SQUARE FT) 2022-2029
TABLE 7 GLOBAL FIRE-RESISTANT GLASS MARKET BY REGION (USD BILLION) 2022-2029
TABLE 8 GLOBAL FIRE-RESISTANT GLASS MARKET BY REGION (MILLION SQUARE FT) 2022-2029
TABLE 9 NORTH AMERICA FIRE-RESISTANT GLASS MARKET BY COUNTRY (USD BILLION) 2022-2029
TABLE 10 NORTH AMERICA FIRE-RESISTANT GLASS MARKET BY COUNTRY (MILLION SQUARE FT) 2022-2029
TABLE 11 NORTH AMERICA FIRE-RESISTANT GLASS MARKET BY TYPE (USD BILLION) 2022-2029
TABLE 12 NORTH AMERICA FIRE-RESISTANT GLASS MARKET BY TYPE (MILLION SQUARE FT) 2022-2029
TABLE 13 NORTH AMERICA FIRE-RESISTANT GLASS MARKET BY APPLICATION (USD BILLION) 2022-2029
TABLE 14 NORTH AMERICA FIRE-RESISTANT GLASS MARKET BY APPLICATION (MILLION SQUARE FT) 2022-2029
TABLE 15 NORTH AMERICA FIRE-RESISTANT GLASS MARKET BY END USER (USD BILLION) 2022-2029
TABLE 16 NORTH AMERICA FIRE-RESISTANT GLASS MARKET BY END USER (MILLION SQUARE FT) 2022-2029
TABLE 17 US FIRE-RESISTANT GLASS MARKET BY TYPE (USD BILLION) 2022-2029
TABLE 18 US FIRE-RESISTANT GLASS MARKET BY TYPE (MILLION SQUARE FT) 2022-2029
TABLE 19 US FIRE-RESISTANT GLASS MARKET BY APPLICATION (USD BILLION) 2022-2029
TABLE 20 US FIRE-RESISTANT GLASS MARKET BY APPLICATION (MILLION SQUARE FT) 2022-2029
TABLE 21 US FIRE-RESISTANT GLASS MARKET BY END USER (USD BILLION) 2022-2029
TABLE 22 US FIRE-RESISTANT GLASS MARKET BY END USER (MILLION SQUARE FT) 2022-2029
TABLE 23 CANADA FIRE-RESISTANT GLASS MARKET BY TYPE (USD BILLION) 2022-2029
TABLE 24 CANADA FIRE-RESISTANT GLASS MARKET BY TYPE (MILLION SQUARE FT) 2022-2029
TABLE 25 CANADA FIRE-RESISTANT GLASS MARKET BY APPLICATION (USD BILLION) 2022-2029
TABLE 26 CANADA FIRE-RESISTANT GLASS MARKET BY APPLICATION (MILLION SQUARE FT) 2022-2029
TABLE 27 CANADA FIRE-RESISTANT GLASS MARKET BY END USER (USD BILLION) 2022-2029
TABLE 28 CANADA FIRE-RESISTANT GLASS MARKET BY END USER (MILLION SQUARE FT) 2022-2029
TABLE 29 MEXICO FIRE-RESISTANT GLASS MARKET BY TYPE (USD BILLION) 2022-2029
TABLE 30 MEXICO FIRE-RESISTANT GLASS MARKET BY TYPE (MILLION SQUARE FT) 2022-2029
TABLE 31 MEXICO FIRE-RESISTANT GLASS MARKET BY APPLICATION (USD BILLION) 2022-2029
TABLE 32 MEXICO FIRE-RESISTANT GLASS MARKET BY APPLICATION (MILLION SQUARE FT) 2022-2029
TABLE 33 MEXICO FIRE-RESISTANT GLASS MARKET BY END USER (USD BILLION) 2022-2029
TABLE 34 MEXICO FIRE-RESISTANT GLASS MARKET BY END USER (MILLION SQUARE FT) 2022-2029
TABLE 35 SOUTH AMERICA FIRE-RESISTANT GLASS MARKET BY COUNTRY (USD BILLION) 2022-2029
TABLE 36 SOUTH AMERICA FIRE-RESISTANT GLASS MARKET BY COUNTRY (MILLION SQUARE FT) 2022-2029
TABLE 37 SOUTH AMERICA FIRE-RESISTANT GLASS MARKET BY TYPE (USD BILLION) 2022-2029
TABLE 38 SOUTH AMERICA FIRE-RESISTANT GLASS MARKET BY TYPE (MILLION SQUARE FT) 2022-2029
TABLE 39 SOUTH AMERICA FIRE-RESISTANT GLASS MARKET BY APPLICATION (USD BILLION) 2022-2029
TABLE 40 SOUTH AMERICA FIRE-RESISTANT GLASS MARKET BY APPLICATION (MILLION SQUARE FT) 2022-2029
TABLE 41 SOUTH AMERICA FIRE-RESISTANT GLASS MARKET BY END USER (USD BILLION) 2022-2029
TABLE 42 SOUTH AMERICA FIRE-RESISTANT GLASS MARKET BY END USER (MILLION SQUARE FT) 2022-2029
TABLE 43 BRAZIL FIRE-RESISTANT GLASS MARKET BY TYPE (USD BILLION) 2022-2029
TABLE 44 BRAZIL FIRE-RESISTANT GLASS MARKET BY TYPE (MILLION SQUARE FT) 2022-2029
TABLE 45 BRAZIL FIRE-RESISTANT GLASS MARKET BY APPLICATION (USD BILLION) 2022-2029
TABLE 46 BRAZIL FIRE-RESISTANT GLASS MARKET BY APPLICATION (MILLION SQUARE FT) 2022-2029
TABLE 47 BRAZIL FIRE-RESISTANT GLASS MARKET BY END USER (USD BILLION) 2022-2029
TABLE 48 BRAZIL FIRE-RESISTANT GLASS MARKET BY END USER (MILLION SQUARE FT) 2022-2029
TABLE 49 ARGENTINA FIRE-RESISTANT GLASS MARKET BY TYPE (USD BILLION) 2022-2029
TABLE 50 ARGENTINA FIRE-RESISTANT GLASS MARKET BY TYPE (MILLION SQUARE FT) 2022-2029
TABLE 51 ARGENTINA FIRE-RESISTANT GLASS MARKET BY APPLICATION (USD BILLION) 2022-2029
TABLE 52 ARGENTINA FIRE-RESISTANT GLASS MARKET BY APPLICATION (MILLION SQUARE FT) 2022-2029
TABLE 53 ARGENTINA FIRE-RESISTANT GLASS MARKET BY END USER (USD BILLION) 2022-2029
TABLE 54 ARGENTINA FIRE-RESISTANT GLASS MARKET BY END USER (MILLION SQUARE FT) 2022-2029
TABLE 55 COLOMBIA FIRE-RESISTANT GLASS MARKET BY TYPE (USD BILLION) 2022-2029
TABLE 56 COLOMBIA FIRE-RESISTANT GLASS MARKET BY TYPE (MILLION SQUARE FT) 2022-2029
TABLE 57 COLOMBIA FIRE-RESISTANT GLASS MARKET BY APPLICATION (USD BILLION) 2022-2029
TABLE 58 COLOMBIA FIRE-RESISTANT GLASS MARKET BY APPLICATION (MILLION SQUARE FT) 2022-2029
TABLE 59 COLOMBIA FIRE-RESISTANT GLASS MARKET BY END USER (USD BILLION) 2022-2029
TABLE 60 COLOMBIA FIRE-RESISTANT GLASS MARKET BY END USER (MILLION SQUARE FT) 2022-2029
TABLE 61 REST OF SOUTH AMERICA FIRE-RESISTANT GLASS MARKET BY TYPE (USD BILLION) 2022-2029
TABLE 62 REST OF SOUTH AMERICA FIRE-RESISTANT GLASS MARKET BY TYPE (MILLION SQUARE FT) 2022-2029
TABLE 63 REST OF SOUTH AMERICA FIRE-RESISTANT GLASS MARKET BY APPLICATION (USD BILLION) 2022-2029
TABLE 64 REST OF SOUTH AMERICA FIRE-RESISTANT GLASS MARKET BY APPLICATION (MILLION SQUARE FT) 2022-2029
TABLE 65 REST OF SOUTH AMERICA FIRE-RESISTANT GLASS MARKET BY END USER (USD BILLION) 2022-2029
TABLE 66 REST OF SOUTH AMERICA FIRE-RESISTANT GLASS MARKET BY END USER (MILLION SQUARE FT) 2022-2029
TABLE 67 ASIA-PACIFIC FIRE-RESISTANT GLASS MARKET BY COUNTRY (USD BILLION) 2022-2029
TABLE 68 ASIA-PACIFIC FIRE-RESISTANT GLASS MARKET BY COUNTRY (MILLION SQUARE FT) 2022-2029
TABLE 69 ASIA-PACIFIC FIRE-RESISTANT GLASS MARKET BY TYPE (USD BILLION) 2022-2029
TABLE 70 ASIA-PACIFIC FIRE-RESISTANT GLASS MARKET BY TYPE (MILLION SQUARE FT) 2022-2029
TABLE 71 ASIA-PACIFIC FIRE-RESISTANT GLASS MARKET BY APPLICATION (USD BILLION) 2022-2029
TABLE 72 ASIA-PACIFIC FIRE-RESISTANT GLASS MARKET BY APPLICATION (MILLION SQUARE FT) 2022-2029
TABLE 73 ASIA-PACIFIC FIRE-RESISTANT GLASS MARKET BY END USER (USD BILLION) 2022-2029
TABLE 74 ASIA-PACIFIC FIRE-RESISTANT GLASS MARKET BY END USER (MILLION SQUARE FT) 2022-2029
TABLE 75 INDIA FIRE-RESISTANT GLASS MARKET BY TYPE (USD BILLION) 2022-2029
TABLE 76 INDIA FIRE-RESISTANT GLASS MARKET BY TYPE (MILLION SQUARE FT) 2022-2029
TABLE 77 INDIA FIRE-RESISTANT GLASS MARKET BY APPLICATION (USD BILLION) 2022-2029
TABLE 78 INDIA FIRE-RESISTANT GLASS MARKET BY APPLICATION (MILLION SQUARE FT) 2022-2029
TABLE 79 INDIA FIRE-RESISTANT GLASS MARKET BY END USER (USD BILLION) 2022-2029
TABLE 80 INDIA FIRE-RESISTANT GLASS MARKET BY END USER (MILLION SQUARE FT) 2022-2029
TABLE 81 CHINA FIRE-RESISTANT GLASS MARKET BY TYPE (USD BILLION) 2022-2029
TABLE 82 CHINA FIRE-RESISTANT GLASS MARKET BY TYPE (MILLION SQUARE FT) 2022-2029
TABLE 83 CHINA FIRE-RESISTANT GLASS MARKET BY APPLICATION (USD BILLION) 2022-2029
TABLE 84 CHINA FIRE-RESISTANT GLASS MARKET BY APPLICATION (MILLION SQUARE FT) 2022-2029
TABLE 85 CHINA FIRE-RESISTANT GLASS MARKET BY END USER (USD BILLION) 2022-2029
TABLE 86 CHINA FIRE-RESISTANT GLASS MARKET BY END USER (MILLION SQUARE FT) 2022-2029
TABLE 87 JAPAN FIRE-RESISTANT GLASS MARKET BY TYPE (USD BILLION) 2022-2029
TABLE 88 JAPAN FIRE-RESISTANT GLASS MARKET BY TYPE (MILLION SQUARE FT) 2022-2029
TABLE 89 JAPAN FIRE-RESISTANT GLASS MARKET BY APPLICATION (USD BILLION) 2022-2029
TABLE 90 JAPAN FIRE-RESISTANT GLASS MARKET BY APPLICATION (MILLION SQUARE FT) 2022-2029
TABLE 91 JAPAN FIRE-RESISTANT GLASS MARKET BY END USER (USD BILLION) 2022-2029
TABLE 92 JAPAN FIRE-RESISTANT GLASS MARKET BY END USER (MILLION SQUARE FT) 2022-2029
TABLE 93 SOUTH KOREA FIRE-RESISTANT GLASS MARKET BY TYPE (USD BILLION) 2022-2029
TABLE 94 SOUTH KOREA FIRE-RESISTANT GLASS MARKET BY TYPE (MILLION SQUARE FT) 2022-2029
TABLE 95 SOUTH KOREA FIRE-RESISTANT GLASS MARKET BY APPLICATION (USD BILLION) 2022-2029
TABLE 96 SOUTH KOREA FIRE-RESISTANT GLASS MARKET BY APPLICATION (MILLION SQUARE FT) 2022-2029
TABLE 97 SOUTH KOREA FIRE-RESISTANT GLASS MARKET BY END USER (USD BILLION) 2022-2029
TABLE 98 SOUTH KOREA FIRE-RESISTANT GLASS MARKET BY END USER (MILLION SQUARE FT) 2022-2029
TABLE 99 AUSTRALIA FIRE-RESISTANT GLASS MARKET BY TYPE (USD BILLION) 2022-2029
TABLE 100 AUSTRALIA FIRE-RESISTANT GLASS MARKET BY TYPE (MILLION SQUARE FT) 2022-2029
TABLE 101 AUSTRALIA FIRE-RESISTANT GLASS MARKET BY APPLICATION (USD BILLION) 2022-2029
TABLE 102 AUSTRALIA FIRE-RESISTANT GLASS MARKET BY APPLICATION (MILLION SQUARE FT) 2022-2029
TABLE 103 AUSTRALIA FIRE-RESISTANT GLASS MARKET BY END USER (USD BILLION) 2022-2029
TABLE 104 AUSTRALIA FIRE-RESISTANT GLASS MARKET BY END USER (MILLION SQUARE FT) 2022-2029
TABLE 105 SOUTH-EAST ASIA FIRE-RESISTANT GLASS MARKET BY TYPE (USD BILLION) 2022-2029
TABLE 106 SOUTH-EAST ASIA FIRE-RESISTANT GLASS MARKET BY TYPE (MILLION SQUARE FT) 2022-2029
TABLE 107 SOUTH-EAST ASIA FIRE-RESISTANT GLASS MARKET BY APPLICATION (USD BILLION) 2022-2029
TABLE 108 SOUTH-EAST ASIA FIRE-RESISTANT GLASS MARKET BY APPLICATION (MILLION SQUARE FT) 2022-2029
TABLE 109 SOUTH-EAST ASIA FIRE-RESISTANT GLASS MARKET BY END USER (USD BILLION) 2022-2029
TABLE 110 SOUTH-EAST ASIA FIRE-RESISTANT GLASS MARKET BY END USER (MILLION SQUARE FT) 2022-2029
TABLE 111 REST OF ASIA PACIFIC FIRE-RESISTANT GLASS MARKET BY TYPE (USD BILLION) 2022-2029
TABLE 112 REST OF ASIA PACIFIC FIRE-RESISTANT GLASS MARKET BY TYPE (MILLION SQUARE FT) 2022-2029
TABLE 113 REST OF ASIA PACIFIC FIRE-RESISTANT GLASS MARKET BY APPLICATION (USD BILLION) 2022-2029
TABLE 114 REST OF ASIA PACIFIC FIRE-RESISTANT GLASS MARKET BY APPLICATION (MILLION SQUARE FT) 2022-2029
TABLE 115 REST OF ASIA PACIFIC FIRE-RESISTANT GLASS MARKET BY END USER (USD BILLION) 2022-2029
TABLE 116 REST OF ASIA PACIFIC FIRE-RESISTANT GLASS MARKET BY END USER (MILLION SQUARE FT) 2022-2029
TABLE 117 EUROPE FIRE-RESISTANT GLASS MARKET BY COUNTRY (USD BILLION) 2022-2029
TABLE 118 EUROPE FIRE-RESISTANT GLASS MARKET BY COUNTRY (MILLION SQUARE FT) 2022-2029
TABLE 119 ASIA-PACIFIC FIRE-RESISTANT GLASS MARKET BY TYPE (USD BILLION) 2022-2029
TABLE 120 ASIA-PACIFIC FIRE-RESISTANT GLASS MARKET BY TYPE (MILLION SQUARE FT) 2022-2029
TABLE 121 ASIA-PACIFIC FIRE-RESISTANT GLASS MARKET BY APPLICATION (USD BILLION) 2022-2029
TABLE 122 ASIA-PACIFIC FIRE-RESISTANT GLASS MARKET BY APPLICATION (MILLION SQUARE FT) 2022-2029
TABLE 123 ASIA-PACIFIC FIRE-RESISTANT GLASS MARKET BY END USER (USD BILLION) 2022-2029
TABLE 124 ASIA-PACIFIC FIRE-RESISTANT GLASS MARKET BY END USER (MILLION SQUARE FT) 2022-2029
TABLE 125 GERMANY FIRE-RESISTANT GLASS MARKET BY TYPE (USD BILLION) 2022-2029
TABLE 126 GERMANY FIRE-RESISTANT GLASS MARKET BY TYPE (MILLION SQUARE FT) 2022-2029
TABLE 127 GERMANY FIRE-RESISTANT GLASS MARKET BY APPLICATION (USD BILLION) 2022-2029
TABLE 128 GERMANY FIRE-RESISTANT GLASS MARKET BY APPLICATION (MILLION SQUARE FT) 2022-2029
TABLE 129 GERMANY FIRE-RESISTANT GLASS MARKET BY END USER (USD BILLION) 2022-2029
TABLE 130 GERMANY FIRE-RESISTANT GLASS MARKET BY END USER (MILLION SQUARE FT) 2022-2029
TABLE 131 UK FIRE-RESISTANT GLASS MARKET BY TYPE (USD BILLION) 2022-2029
TABLE 132 UK FIRE-RESISTANT GLASS MARKET BY TYPE (MILLION SQUARE FT) 2022-2029
TABLE 133 UK FIRE-RESISTANT GLASS MARKET BY APPLICATION (USD BILLION) 2022-2029
TABLE 134 UK FIRE-RESISTANT GLASS MARKET BY APPLICATION (MILLION SQUARE FT) 2022-2029
TABLE 135 UK FIRE-RESISTANT GLASS MARKET BY END USER (USD BILLION) 2022-2029
TABLE 136 UK FIRE-RESISTANT GLASS MARKET BY END USER (MILLION SQUARE FT) 2022-2029
TABLE 137 FRANCE FIRE-RESISTANT GLASS MARKET BY TYPE (USD BILLION) 2022-2029
TABLE 138 FRANCE FIRE-RESISTANT GLASS MARKET BY TYPE (MILLION SQUARE FT) 2022-2029
TABLE 139 FRANCE FIRE-RESISTANT GLASS MARKET BY APPLICATION (USD BILLION) 2022-2029
TABLE 140 FRANCE FIRE-RESISTANT GLASS MARKET BY APPLICATION (MILLION SQUARE FT) 2022-2029
TABLE 141 FRANCE FIRE-RESISTANT GLASS MARKET BY END USER (USD BILLION) 2022-2029
TABLE 142 FRANCE FIRE-RESISTANT GLASS MARKET BY END USER (MILLION SQUARE FT) 2022-2029
TABLE 143 ITALY FIRE-RESISTANT GLASS MARKET BY TYPE (USD BILLION) 2022-2029
TABLE 144 ITALY FIRE-RESISTANT GLASS MARKET BY TYPE (MILLION SQUARE FT) 2022-2029
TABLE 145 ITALY FIRE-RESISTANT GLASS MARKET BY APPLICATION (USD BILLION) 2022-2029
TABLE 146 ITALY FIRE-RESISTANT GLASS MARKET BY APPLICATION (MILLION SQUARE FT) 2022-2029
TABLE 147 ITALY FIRE-RESISTANT GLASS MARKET BY END USER (USD BILLION) 2022-2029
TABLE 148 ITALY FIRE-RESISTANT GLASS MARKET BY END USER (MILLION SQUARE FT) 2022-2029
TABLE 149 SPAIN FIRE-RESISTANT GLASS MARKET BY TYPE (USD BILLION) 2022-2029
TABLE 150 SPAIN FIRE-RESISTANT GLASS MARKET BY TYPE (MILLION SQUARE FT) 2022-2029
TABLE 151 SPAIN FIRE-RESISTANT GLASS MARKET BY APPLICATION (USD BILLION) 2022-2029
TABLE 152 SPAIN FIRE-RESISTANT GLASS MARKET BY APPLICATION (MILLION SQUARE FT) 2022-2029
TABLE 153 SPAIN FIRE-RESISTANT GLASS MARKET BY END USER (USD BILLION) 2022-2029
TABLE 154 SPAIN FIRE-RESISTANT GLASS MARKET BY END USER (MILLION SQUARE FT) 2022-2029
TABLE 155 RUSSIA FIRE-RESISTANT GLASS MARKET BY TYPE (USD BILLION) 2022-2029
TABLE 156 RUSSIA FIRE-RESISTANT GLASS MARKET BY TYPE (MILLION SQUARE FT) 2022-2029
TABLE 157 RUSSIA FIRE-RESISTANT GLASS MARKET BY APPLICATION (USD BILLION) 2022-2029
TABLE 158 RUSSIA FIRE-RESISTANT GLASS MARKET BY APPLICATION (MILLION SQUARE FT) 2022-2029
TABLE 159 RUSSIA FIRE-RESISTANT GLASS MARKET BY END USER (USD BILLION) 2022-2029
TABLE 160 RUSSIA FIRE-RESISTANT GLASS MARKET BY END USER (MILLION SQUARE FT) 2022-2029
TABLE 161 REST OF EUROPE FIRE-RESISTANT GLASS MARKET BY TYPE (USD BILLION) 2022-2029
TABLE 162 REST OF EUROPE FIRE-RESISTANT GLASS MARKET BY TYPE (MILLION SQUARE FT) 2022-2029
TABLE 163 REST OF EUROPE FIRE-RESISTANT GLASS MARKET BY APPLICATION (USD BILLION) 2022-2029
TABLE 164 REST OF EUROPE FIRE-RESISTANT GLASS MARKET BY APPLICATION (MILLION SQUARE FT) 2022-2029
TABLE 165 REST OF EUROPE FIRE-RESISTANT GLASS MARKET BY END USER (USD BILLION) 2022-2029
TABLE 166 REST OF EUROPE FIRE-RESISTANT GLASS MARKET BY END USER (MILLION SQUARE FT) 2022-2029
TABLE 167 MIDDLE EAST AND AFRICA FIRE-RESISTANT GLASS MARKET BY COUNTRY (USD BILLION) 2022-2029
TABLE 168 MIDDLE EAST AND AFRICA FIRE-RESISTANT GLASS MARKET BY COUNTRY (MILLION SQUARE FT) 2022-2029
TABLE 169 MIDDLE EAST AND AFRICA FIRE-RESISTANT GLASS MARKET BY TYPE (USD BILLION) 2022-2029
TABLE 170 MIDDLE EAST AND AFRICA FIRE-RESISTANT GLASS MARKET BY TYPE (MILLION SQUARE FT) 2022-2029
TABLE 171 MIDDLE EAST AND AFRICA FIRE-RESISTANT GLASS MARKET BY APPLICATION (USD BILLION) 2022-2029
TABLE 172 MIDDLE EAST AND AFRICA FIRE-RESISTANT GLASS MARKET BY APPLICATION (MILLION SQUARE FT) 2022-2029
TABLE 173 MIDDLE EAST AND AFRICA FIRE-RESISTANT GLASS MARKET BY END USER (USD BILLION) 2022-2029
TABLE 174 MIDDLE EAST AND AFRICA FIRE-RESISTANT GLASS MARKET BY END USER (MILLION SQUARE FT) 2022-2029
TABLE 175 UAE FIRE-RESISTANT GLASS MARKET BY TYPE (USD BILLION) 2022-2029
TABLE 176 UAE FIRE-RESISTANT GLASS MARKET BY TYPE (MILLION SQUARE FT) 2022-2029
TABLE 177 UAE FIRE-RESISTANT GLASS MARKET BY APPLICATION (USD BILLION) 2022-2029
TABLE 178 UAE FIRE-RESISTANT GLASS MARKET BY APPLICATION (MILLION SQUARE FT) 2022-2029
TABLE 179 UAE FIRE-RESISTANT GLASS MARKET BY END USER (USD BILLION) 2022-2029
TABLE 180 UAE FIRE-RESISTANT GLASS MARKET BY END USER (MILLION SQUARE FT) 2022-2029
TABLE 181 SAUDI ARABIA FIRE-RESISTANT GLASS MARKET BY TYPE (USD BILLION) 2022-2029
TABLE 182 SAUDI ARABIA FIRE-RESISTANT GLASS MARKET BY TYPE (MILLION SQUARE FT) 2022-2029
TABLE 183 SAUDI ARABIA FIRE-RESISTANT GLASS MARKET BY APPLICATION (USD BILLION) 2022-2029
TABLE 184 SAUDI ARABIA FIRE-RESISTANT GLASS MARKET BY APPLICATION (MILLION SQUARE FT) 2022-2029
TABLE 185 SAUDI ARABIA FIRE-RESISTANT GLASS MARKET BY END USER (USD BILLION) 2022-2029
TABLE 186 SAUDI ARABIA FIRE-RESISTANT GLASS MARKET BY END USER (MILLION SQUARE FT) 2022-2029
TABLE 187 SOUTH AFRICA FIRE-RESISTANT GLASS MARKET BY TYPE (USD BILLION) 2022-2029
TABLE 188 SOUTH AFRICA FIRE-RESISTANT GLASS MARKET BY TYPE (MILLION SQUARE FT) 2022-2029
TABLE 189 SOUTH AFRICA FIRE-RESISTANT GLASS MARKET BY APPLICATION (USD BILLION) 2022-2029
TABLE 190 SOUTH AFRICA FIRE-RESISTANT GLASS MARKET BY APPLICATION (MILLION SQUARE FT) 2022-2029
TABLE 191 SOUTH AFRICA FIRE-RESISTANT GLASS MARKET BY END USER (USD BILLION) 2022-2029
TABLE 192 SOUTH AFRICA FIRE-RESISTANT GLASS MARKET BY END USER (MILLION SQUARE FT) 2022-2029
TABLE 193 REST OF MIDDLE EAST AND AFRICA FIRE-RESISTANT GLASS MARKET BY TYPE (USD BILLION) 2022-2029
TABLE 194 REST OF MIDDLE EAST AND AFRICA FIRE-RESISTANT GLASS MARKET BY TYPE (MILLION SQUARE FT) 2022-2029
TABLE 195 REST OF MIDDLE EAST AND AFRICA FIRE-RESISTANT GLASS MARKET BY APPLICATION (USD BILLION) 2022-2029
TABLE 196 REST OF MIDDLE EAST AND AFRICA FIRE-RESISTANT GLASS MARKET BY APPLICATION (MILLION SQUARE FT) 2022-2029
TABLE 197 REST OF MIDDLE EAST AND AFRICA FIRE-RESISTANT GLASS MARKET BY END USER (USD BILLION) 2022-2029
TABLE 198 REST OF MIDDLE EAST AND AFRICA FIRE-RESISTANT GLASS MARKET BY END USER (MILLION SQUARE FT) 2022-2029
LIST OF FIGURES
FIGURE 1 MARKET DYNAMICS
FIGURE 2 MARKET SEGMENTATION
FIGURE 3 REPORT TIMELINES: YEARS CONSIDERED
FIGURE 4 DATA TRIANGULATION
FIGURE 5 BOTTOM-UP APPROACH
FIGURE 6 TOP-DOWN APPROACH
FIGURE 7 RESEARCH FLOW
FIGURE 8 GLOBAL FIRE-RESISTANT GLASS MARKET BY TYPE, USD BILLION, 2022-2029
FIGURE 9 GLOBAL FIRE-RESISTANT GLASS MARKET BY APPLICATION, USD BILLION, 2022-2029
FIGURE 10 GLOBAL FIRE-RESISTANT GLASS MARKET BY END USER, USD BILLION, 2022-2029
FIGURE 11 GLOBAL FIRE-RESISTANT GLASS MARKET BY REGION, USD BILLION, 2022-2029
FIGURE 12 PORTER’S FIVE FORCES MODEL
FIGURE 13 GLOBAL FIRE-RESISTANT GLASS MARKET BY TYPE, 2021
FIGURE 14 GLOBAL FIRE-RESISTANT GLASS MARKET BY APPLICATION 2021
FIGURE 15 GLOBAL FIRE-RESISTANT GLASS MARKET BY END USER 2021
FIGURE 16 FIRE-RESISTANT GLASS MARKET BY REGION 2021
FIGURE 17 MARKET SHARE ANALYSIS
FIGURE 18 MARKET SHARE ANALYSIS
FIGURE 19 AGC INC: COMPANY SNAPSHOT
FIGURE 20 COMPAGNIE DE SAINT GOBAIN S.A: COMPANY SNAPSHOT
FIGURE 21 FUSO GLASS INDIA PVT. LTD: COMPANY SNAPSHOT
FIGURE 22 NIPPON SHEETS GLASS CO.: COMPANY SNAPSHOT
FIGURE 23 PYROGUARD ENGINEERS PVT. LTD: COMPANY SNAPSHOT
FIGURE 24 RAVENSBY GLASS CO. LTD: COMPANY SNAPSHOT
FIGURE 25 SCHOTT AG: COMPANY SNAPSHOT
FIGURE 26 SOFTY FIRST FIRE-RATED GAZING SOLUTIONS: COMPANY SNAPSHOT
FIGURE 27 TECHNICAL GLASS PRODUCTS INC: COMPANY SNAPSHOT
DOWNLOAD FREE SAMPLE REPORT
License Type
SPEAK WITH OUR ANALYST
Want to know more about the report or any specific requirement?
WANT TO CUSTOMIZE THE REPORT?
Our Clients Speak
We asked them to research ‘ Equipment market’ all over the world, and their whole arrangement was helpful to us. thehealthanalytics.com insightful analysis and reports contributed to our current analysis and in creating a future strategy. Besides, the te
Yosuke Mitsui
Senior Associate Construction Equipment Sales & Marketing
We asked them to research ‘Equipment market’ all over the world, and their whole arrangement was helpful to us. thehealthanalytics.com insightful analysis and reports contributed to our current analysis and in creating a future strategy. Besides, the te


