

Base Year Value ()
x.x %
x.x %
CAGR ()
x.x %
x.x %
Forecast Year Value ()
x.x %
x.x %
Historical Data Period
Largest Region
Forecast Period
Markt für Glasfaserroving nach Produkttyp (Single-End-Roving, Multi-End-Roving, Chopped Roving), nach Glasart (E-Glas, ECR-Glas, H-Glas, AR-Glas, S-Glas), nach Endverbraucher (Transport, Bau und Infrastruktur, Elektrik und Elektronik, Rohre und Tanks, Marine, Luft- und Raumfahrt und Verteidigung, Windenergie) und Region, globale Trends und Prognose von 2022 bis 2029
Instant access to hundreds of data points and trends
- Market estimates from 2014-2029
- Competitive analysis, industry segmentation, financial benchmarks
- Incorporates SWOT, Porter's Five Forces and risk management frameworks
- PDF report or online database with Word, Excel and PowerPoint export options
- 100% money back guarantee
Marktübersicht für Glasfaserroving
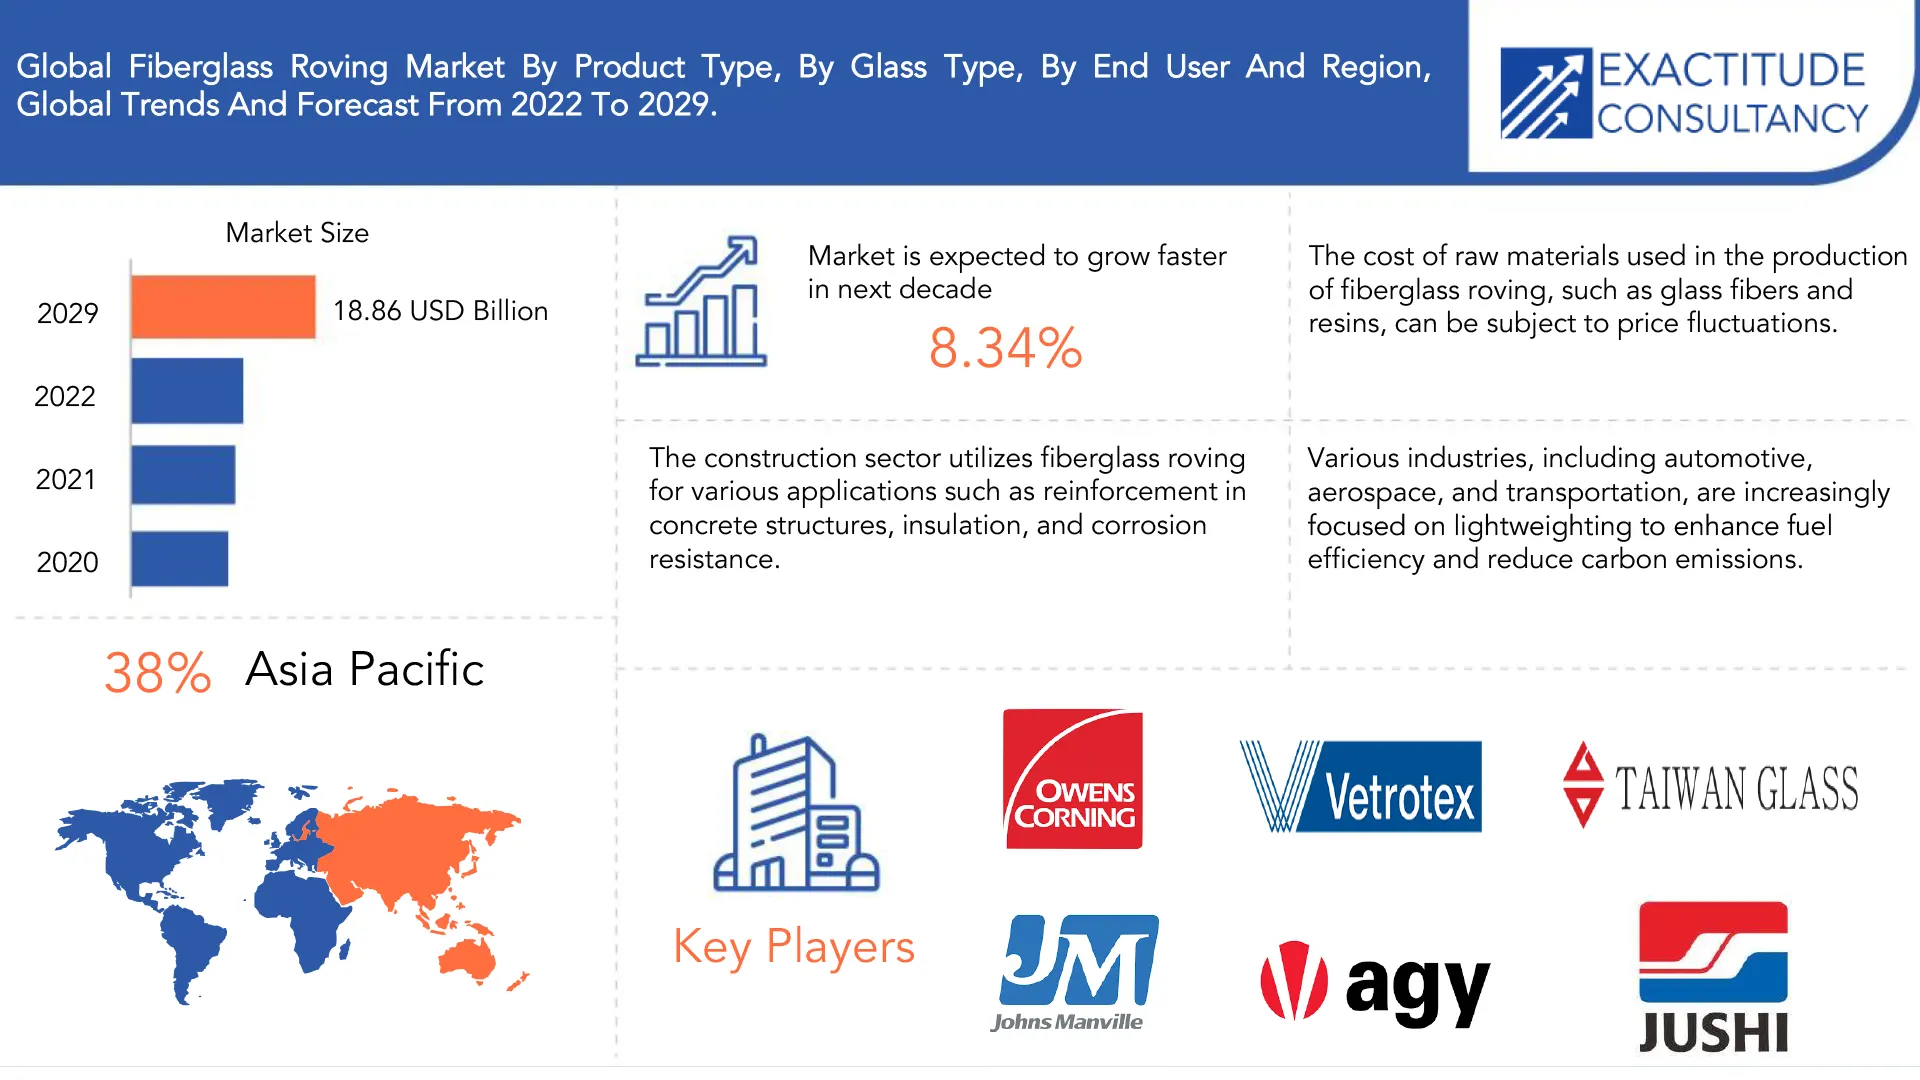
Der Markt für Glasfaserrovings wird voraussichtlich von 2022 bis 2029 um durchschnittlich 8,34 % jährlich wachsen. Es wird erwartet, dass er von 9,17 Milliarden US-Dollar im Jahr 2020 auf über 18,86 Milliarden US-Dollar im Jahr 2029 ansteigt.
Glasfaserroving ist ein Verstärkungsmaterial, das bei der Herstellung von Verbundwerkstoffen verwendet wird . Es wird hergestellt, indem geschmolzenes Glas durch feine Düsen gezogen wird, wodurch kontinuierliche Glasfaserfilamente entstehen . Diese Filamente werden dann zu einem Strang zusammengeführt, der als Roving bezeichnet wird. Glasfaserroving ist für seine hohe Zugfestigkeit, Wärmebeständigkeit, Korrosionsbeständigkeit und elektrischen Isoliereigenschaften bekannt. Es wird in verschiedenen Branchen wie der Automobil-, Luft- und Raumfahrt-, Bau-, Windenergie- und Schifffahrtsindustrie häufig verwendet, um die Eigenschaften von Verbundprodukten wie Karosserieteilen, Bootsrümpfen, Windturbinenblättern, Rohren und Tanks zu verstärken und zu verbessern.
[Bildunterschrift id="attachment_26418" align="aligncenter" width="1920"]
Die steigende Nachfrage nach korrosionsbeständigen Materialien ist ein wichtiger Treiber für den Markt für Glasfaserroving. Glasfaserroving weist eine ausgezeichnete Korrosionsbeständigkeit auf, was es für Branchen wie Öl und Gas, chemische Verarbeitung und Schifffahrt äußerst attraktiv macht . Diese Branchen benötigen Materialien, die rauen Umgebungen und der Einwirkung korrosiver Substanzen standhalten. Die Korrosionsbeständigkeit von Glasfaserroving ermöglicht seinen Einsatz bei der Herstellung korrosionsbeständiger Komponenten, Strukturen und Geräte. Da sich die Industrien auf die Verbesserung der Haltbarkeit und Langlebigkeit ihrer Produkte konzentrieren, steigt die Nachfrage nach Glasfaserroving als korrosionsbeständigem Verstärkungsmaterial weiter an. Dieser Treiber eröffnet dem Markt für Glasfaserroving Möglichkeiten, den wachsenden Bedarf korrosionsgefährdeter Branchen zu decken.
The volatility in raw material prices poses a significant restraint on the fiberglass roving market. The cost of raw materials used in the production of fiberglass roving, such as glass fibers and resins, can fluctuate unpredictably. These price fluctuations can impact the profitability and cost structure of fiberglass roving manufacturers, making it challenging to maintain stable pricing and margins. Sudden increases in raw material prices can lead to higher production costs, which may be difficult to pass on to customers. Moreover, the uncertainty in raw material costs can affect long-term planning, investments, and decision-making in the fiberglass roving industry. Managing and mitigating the impact of raw material price volatility becomes crucial for sustained growth and profitability in the market.
Lightweighting initiatives present a significant opportunity for the fiberglass roving market. Various industries, including automotive, aerospace, and transportation, are increasingly focused on reducing weight to improve fuel efficiency and reduce carbon emissions. Fiberglass roving, known for its high strength-to-weight ratio, can be a preferred reinforcement material in lightweighting applications. By incorporating fiberglass roving into composite structures, manufacturers can achieve substantial weight reduction while maintaining structural integrity and performance. This opportunity allows the fiberglass roving market to cater to the growing demand for lightweight materials in industries that prioritize sustainability and efficiency. By providing a solution for lightweighting initiatives, fiberglass roving can contribute to the development of more fuel-efficient vehicles, aerospace components, and transportation systems.
The COVID-19 pandemic had a significant negative impact on the fiberglass roving market. The outbreak led to disruptions in global supply chains, manufacturing operations, and reduced economic activity. The construction industry, a major consumer of fiberglass roving, experienced slowdowns and project delays due to lockdowns and social distancing measures. The automotive and aerospace sectors, which also utilize fiberglass roving, faced a decline in demand as consumer spending and travel were severely affected. Additionally, the closure of manufacturing facilities and restrictions on international trade disrupted the supply of raw materials, impacting production capabilities. Uncertainty and reduced investments during the pandemic further affected market growth. While the fiberglass roving market is expected to recover as economies stabilize, the short-term negative impact of COVID-19 on the industry had significant.
| ATTRIBUTE | DETAILS |
| Study period | 2020-2029 |
| Base year | 2021 |
| Estimated year | 2022 |
| Forecasted year | 2022-2029 |
| Historical period | 2018-2020 |
| Unit | Value (USD Billion), (Kilotons) |
| Segmentation | By Product Type, By Glass Type, By End User, By Region. |
| By Product Type |
|
| By Glass Type |
|
| By End User |
|
| By Region |
|
Frequently Asked Questions
• What is the worth of fiberglass roving market?
The fiberglass roving market is expected to grow at 8.34 % CAGR from 2022 to 2029. It is expected to reach above USD 18.86 Billion by 2029 from USD 9.17 Billion in 2020.
• What is the size of the Asia Pacific fiberglass roving industry?
Asia Pacific held more than 38% of the fiberglass roving market revenue share in 2021 and will witness expansion in the forecast period.
• What are some of the market's driving forces?
Fiberglass roving is used as a reinforcement material in the production of lightweight composites. With increasing emphasis on fuel efficiency and reducing vehicle weight in industries like automotive and aerospace, there is a rising demand for fiberglass roving to manufacture lightweight components.
• Which are the top companies to hold the market share in fiberglass roving market?
The fiberglass roving market key players include Taiwan Glass Industry Corp., Owens Corning, China Beihai Fiberglass Co. Ltd., Saint-Gobain S.A., AGY Holdings Corp, Binani Industries Ltd, Nippon Electrical Glass Co. Ltd, Taishan Fiberglass Inc., Jushi India Fiberglass (P) Ltd, Johns Manville
• What is the leading application of fiberglass roving market?
The transportation industry is major sector where the application of fiberglass roving has seen more.
• Which is the largest regional market for fiberglass roving market?
The markets largest share is in the Asia Pacific region.
Fiberglass Roving Market Segment Analysis
The single-end roving product type is the dominant segment in the fiberglass roving market. Single-end roving consists of individual continuous filaments of glass that are gathered together into a single strand. This product type offers flexibility and ease of handling during the manufacturing process. It is widely used in various applications across industries such as automotive, construction, aerospace, and wind energy. The dominance of single-end roving in the market can be attributed to its versatility, cost-effectiveness, and suitability for a wide range of composite manufacturing processes.
[caption id="attachment_26419" align="aligncenter" width="1920"]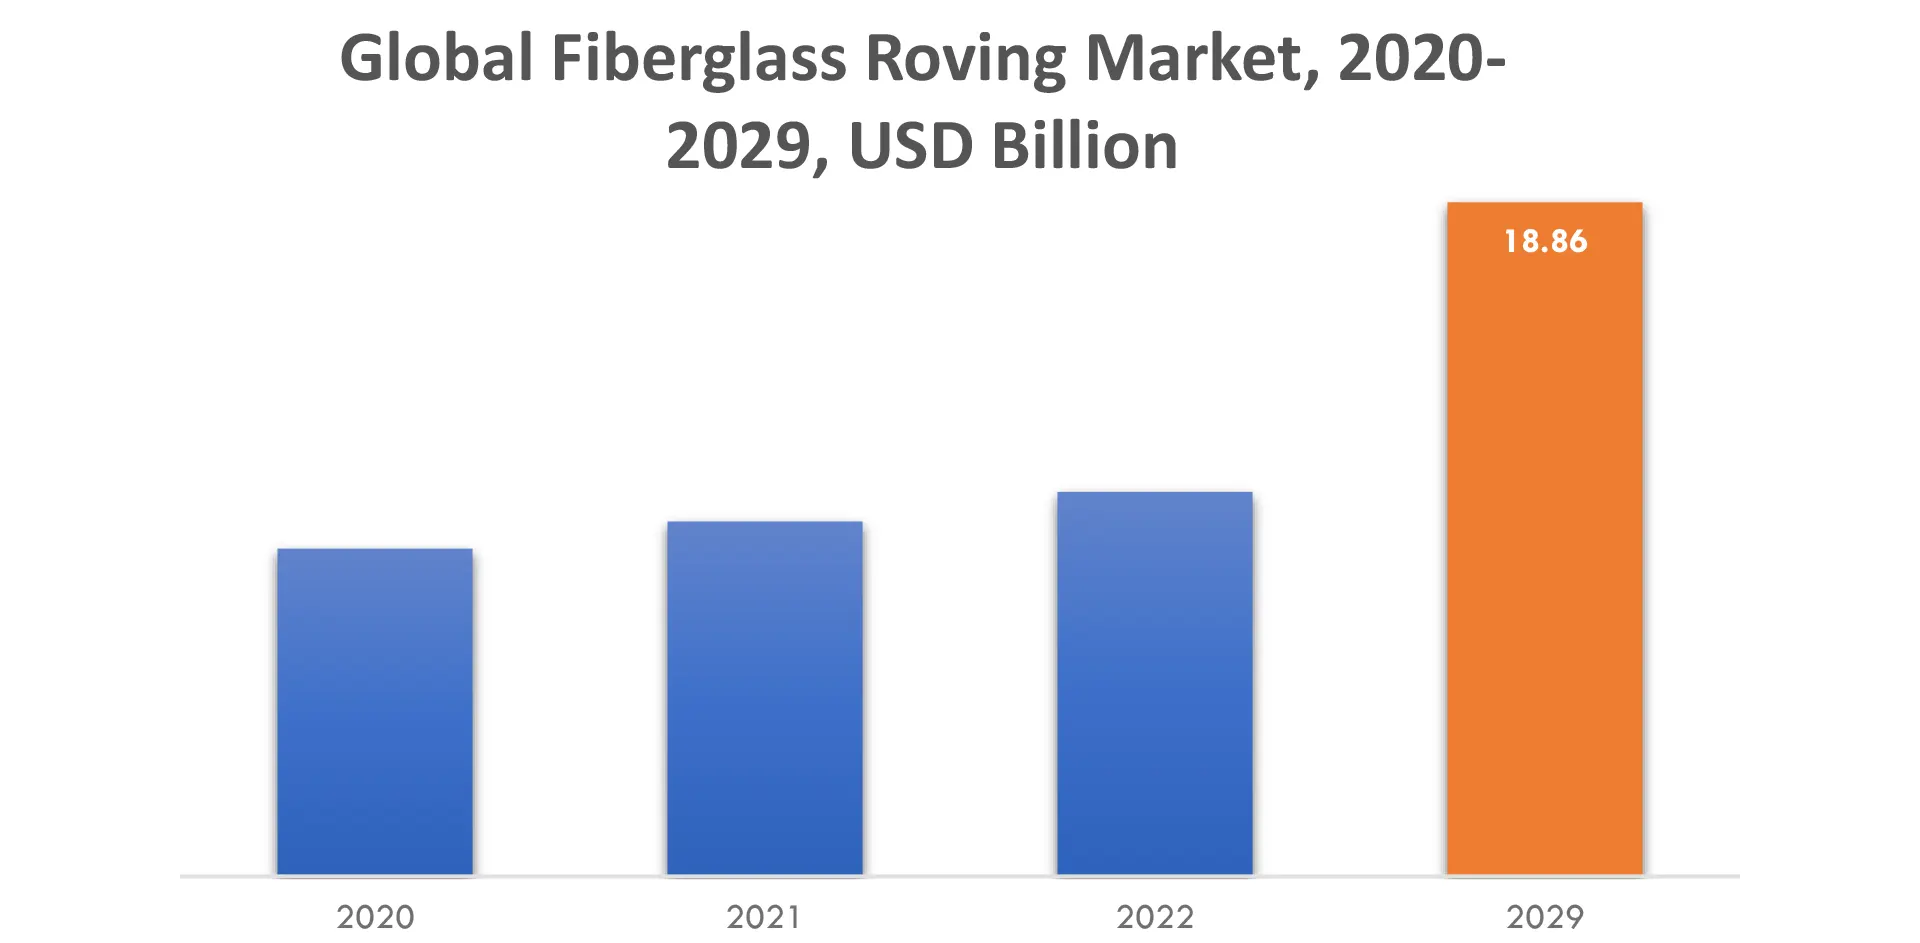
The E-glass fiber segment holds a significant share in the global fiberglass roving market. E-glass fiber is the most commonly used type of glass fiber for reinforcement purposes. It offers excellent properties such as high strength, good electrical insulation, and corrosion resistance, making it suitable for various applications. E-glass fiber is widely utilized in industries such as automotive, construction, aerospace, and electrical and electronics. Its dominance in the fiberglass roving market is attributed to its versatile properties, availability, and established manufacturing processes.
The transportation end-use industry segment holds the largest share in the fiberglass roving market. This sector encompasses applications in automotive, aerospace, and other transportation-related industries. The demand for fiberglass roving in transportation is driven by the need for lightweight materials that provide strength, durability, and fuel efficiency. Fiberglass roving finds extensive usage in automotive body panels, interior components, aircraft parts, and other transportation applications. The transportation industry's reliance on fiberglass roving makes it a key contributor to the overall market size and growth.
Who Should Buy? Or Key Stakeholders
- Chemicals Companies
- Transportation Companies
- Raw Material Manufacturer
- Market Research
- Research and Development Institutes
- Consulting Firms
- Venture capitalists
- Investors
- Supplier and Distributor
- Others
Fiberglass Roving Market Regional Analysis
The Fiberglass Roving market by region includes North America, Asia-Pacific (APAC), Europe, South America, and Middle East & Africa (MEA).
- North America: includes the US, Canada, Mexico
- Asia Pacific: includes China, Japan, South Korea, India, Australia, ASEAN and Rest of APAC
- Europe: includes UK, Germany, France, Italy, Spain, Russia, and Rest of Europe
- South America: includes Brazil, Argentina and Rest of South America
- Middle East & Africa: includes Turkey, UAE, Saudi Arabia, South Africa, and Rest of MEA
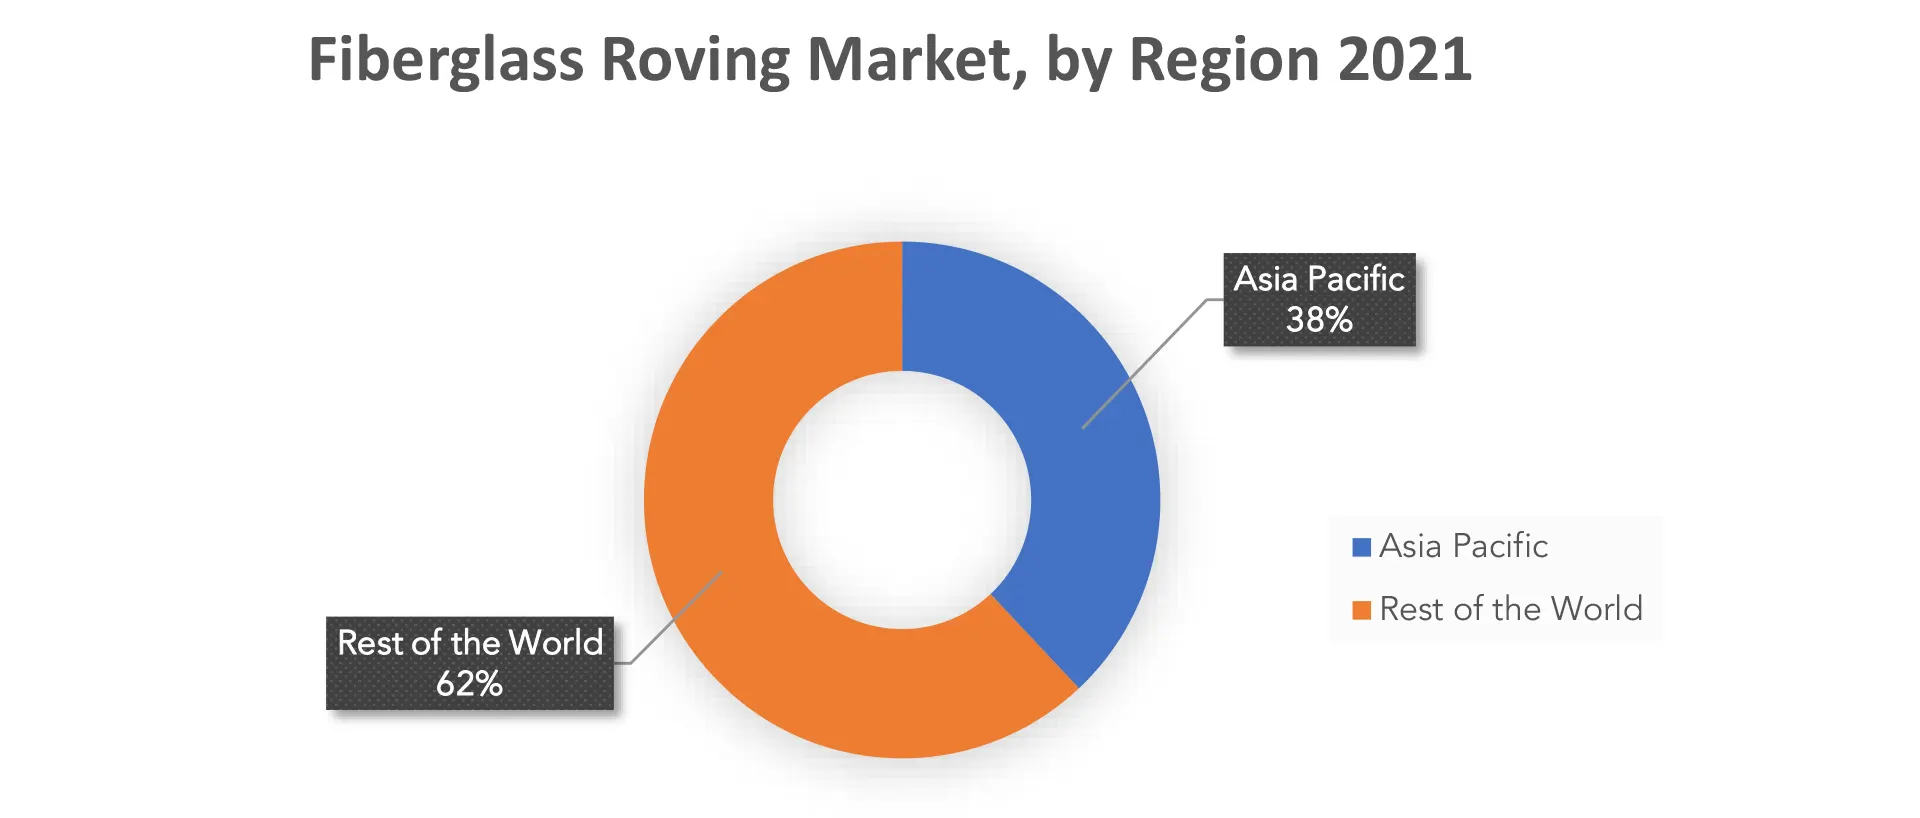
Asia Pacific is a key consumer of fiberglass roving, representing a significant market share. The region's strong demand for fiberglass roving is driven by various factors. The rapid industrialization and infrastructure development in countries like China, India, and Southeast Asian nations contribute to the increased consumption of fiberglass roving in construction, automotive, and other industries. Additionally, the growing manufacturing sector, rising population, and urbanization drive the demand for fiberglass roving in the Asia Pacific region. The presence of major end-use industries and the continuous growth of emerging economies in the region further solidify its position as a key consumer of fiberglass roving.
North America is a prominent market for fiberglass roving. The region encompasses the US, Canada, and Mexico, all of which contribute to the demand for fiberglass roving. North America's strong construction industry, advanced automotive sector, and aerospace industry create substantial opportunities for fiberglass roving usage. Additionally, the region's emphasis on renewable energy, including wind power, drives the need for fiberglass roving in wind turbine manufacturing. North America's commitment to technological advancements, innovation, and sustainability further supports the growth of the fiberglass roving market in the region.
Key Market Segments: Fiberglass Roving Market
Fiberglass Roving Market by Product Type, 2020-2029, (USD Billion), (Kilotons).- Single-End Roving
- Multi-End Roving
- Chopped Roving
- E-Glass
- ECR-Glass
- H-Glass
- AR-Glass
- S-Glass
- Transportation
- Construction & Infrastructure
- Electrical & Electronics
- Pipes & Tanks
- Marine
- Aerospace & Defense
- Wind Energy
- North America
- Asia Pacific
- Europe
- South America
- Middle East and Africa
Exactitude Consultancy Services Key Objectives:
- Increasing sales and market share
- Developing new technology
- Improving profitability
- Entering new markets
- Enhancing brand reputation
Key Question Answered
- What is the expected growth rate of the fiberglass roving market over the next 7 years?
- Who are the major players in the fiberglass roving market and what is their market share?
- What are the end-user industries driving demand for market and what is their outlook?
- What are the opportunities for growth in emerging markets such as Asia-pacific, middle east, and Africa?
- How is the economic environment affecting the fiberglass roving market, including factors such as interest rates, inflation, and exchange rates?
- What is the expected impact of government policies and regulations on the fiberglass roving market?
- What is the current and forecasted size and growth rate of the global fiberglass roving market?
- What are the key drivers of growth in the fiberglass roving market?
- What are the distribution channels and supply chain dynamics in the fiberglass roving market?
- What are the technological advancements and innovations in the fiberglass roving market and their impact on material development and growth?
- What are the regulatory considerations and their impact on the market?
- What are the challenges faced by players in the fiberglass roving market and how are they addressing these challenges?
- What are the opportunities for growth and expansion in the fiberglass roving market?
- What are the products offerings and specifications of leading players in the market?
- What is the pricing trend of fiberglass roving in the market and what is the impact of raw material prices on the price trend?
- INTRODUCTION
- MARKET DEFINITION
- MARKET SEGMENTATION
- RESEARCH TIMELINES
- ASSUMPTIONS AND LIMITATIONS
- RESEARCH METHODOLOGY
- DATA MINING
- SECONDARY RESEARCH
- PRIMARY RESEARCH
- SUBJECT-MATTER EXPERTS’ ADVICE
- QUALITY CHECKS
- FINAL REVIEW
- DATA TRIANGULATION
- BOTTOM-UP APPROACH
- TOP-DOWN APPROACH
- RESEARCH FLOW
- DATA SOURCES
- DATA MINING
- EXECUTIVE SUMMARY
- MARKET OVERVIEW
- GLOBAL FIBERGLASS ROVING MARKET OUTLOOK
- MARKET DRIVERS
- MARKET RESTRAINTS
- MARKET OPPORTUNITIES
- IMPACT OF COVID-19 ON FIBERGLASS ROVING MARKET
- PORTER’S FIVE FORCES MODEL
- THREAT FROM NEW ENTRANTS
- THREAT FROM SUBSTITUTES
- BARGAINING POWER OF SUPPLIERS
- BARGAINING POWER OF CUSTOMERS
- DEGREE OF COMPETITION
- INDUSTRY VALUE CHAIN ANALYSIS
- GLOBAL FIBERGLASS ROVING MARKET OUTLOOK
- GLOBAL FIBERGLASS ROVING MARKET BY PRODUCT TYPE, 2020-2029, (USD BILLION), (KILOTONS)
- SINGLE-END ROVING
- MULTI-END ROVING
- CHOPPED ROVING
- GLOBAL FIBERGLASS ROVING MARKET BY GLASS TYPE, 2020-2029, (USD BILLION), (KILOTONS)
- E-GLASS
- ECR-GLASS
- H-GLASS
- AR-GLASS
- S-GLASS
- GLOBAL FIBERGLASS ROVING MARKET BY END USER, 2020-2029, (USD BILLION), (KILOTONS)
- TRANSPORTATION
- CONSTRUCTION & INFRASTRUCTURE
- ELECTRICAL & ELECTRONICS
- PIPES & TANKS
- MARINE
- AEROSPACE & DEFENSE
- WIND ENERGY
- GLOBAL FIBERGLASS ROVING MARKET BY REGION, 2020-2029, (USD BILLION), (KILOTONS)
- NORTH AMERICA
- US
- CANADA
- MEXICO
- SOUTH AMERICA
- BRAZIL
- ARGENTINA
- COLOMBIA
- REST OF SOUTH AMERICA
- EUROPE
- GERMANY
- UK
- FRANCE
- ITALY
- SPAIN
- RUSSIA
- REST OF EUROPE
- ASIA PACIFIC
- INDIA
- CHINA
- JAPAN
- SOUTH KOREA
- AUSTRALIA
- SOUTH-EAST ASIA
- REST OF ASIA PACIFIC
- MIDDLE EAST AND AFRICA
- UAE
- SAUDI ARABIA
- SOUTH AFRICA
- REST OF MIDDLE EAST AND AFRICA
- NORTH AMERICA
COMPANY PROFILES* (BUSINESS OVERVIEW, COMPANY SNAPSHOT, PRODUCT OFFERED, RECENT DEVELOPMENTS)
- TAIWAN GLASS INDUSTRY CORP.
- OWENS CORNING
- CHINA BEIHAI FIBERGLASS CO. LTD.
- SAINT-GOBAIN S.A.
- AGY HOLDINGS CORP
- BINANI INDUSTRIES LTD
- NIPPON ELECTRICAL GLASS CO. LTD
- TAISHAN FIBERGLASS INC.
- JUSHI INDIA FIBERGLASS (P) LTD.
- JOHNS MANVILLE *THE COMPANY LIST IS INDICATIVE
LIST OF TABLES
TABLE 1 GLOBAL FIBERGLASS ROVING MARKET BY PRODUCT TYPE (USD BILLION) 2020-2029
TABLE 2 GLOBAL FIBERGLASS ROVING MARKET BY PRODUCT TYPE (KILOTONS) 2020-2029
TABLE 3 GLOBAL FIBERGLASS ROVING MARKET BY GLASS TYPE (USD BILLION) 2020-2029
TABLE 4 GLOBAL FIBERGLASS ROVING MARKET BY GLASS TYPE (KILOTONS) 2020-2029
TABLE 5 GLOBAL FIBERGLASS ROVING MARKET BY END USER (USD BILLION) 2020-2029
TABLE 6 GLOBAL FIBERGLASS ROVING MARKET BY END USER (KILOTONS) 2020-2029
TABLE 7 GLOBAL FIBERGLASS ROVING MARKET BY REGION (USD BILLION) 2020-2029
TABLE 8 GLOBAL FIBERGLASS ROVING MARKET BY REGION (KILOTONS) 2020-2029
TABLE 9 NORTH AMERICA FIBERGLASS ROVING MARKET BY COUNTRY (USD BILLION) 2020-2029
TABLE 10 NORTH AMERICA FIBERGLASS ROVING MARKET BY COUNTRY (KILOTONS) 2020-2029
TABLE 11 NORTH AMERICA FIBERGLASS ROVING MARKET BY PRODUCT TYPE (USD BILLION) 2020-2029
TABLE 12 NORTH AMERICA FIBERGLASS ROVING MARKET BY PRODUCT TYPE (KILOTONS) 2020-2029
TABLE 13 NORTH AMERICA FIBERGLASS ROVING MARKET BY GLASS TYPE (USD BILLION) 2020-2029
TABLE 14 NORTH AMERICA FIBERGLASS ROVING MARKET BY GLASS TYPE (KILOTONS) 2020-2029
TABLE 15 NORTH AMERICA FIBERGLASS ROVING MARKET BY END USER (USD BILLION) 2020-2029
TABLE 16 NORTH AMERICA FIBERGLASS ROVING MARKET BY END USER (KILOTONS) 2020-2029
TABLE 17 US FIBERGLASS ROVING MARKET BY PRODUCT TYPE (USD BILLION) 2020-2029
TABLE 18 US FIBERGLASS ROVING MARKET BY PRODUCT TYPE (KILOTONS) 2020-2029
TABLE 19 US FIBERGLASS ROVING MARKET BY GLASS TYPE (USD BILLION) 2020-2029
TABLE 20 US FIBERGLASS ROVING MARKET BY GLASS TYPE (KILOTONS) 2020-2029
TABLE 21 US FIBERGLASS ROVING MARKET BY END USER (USD BILLION) 2020-2029
TABLE 22 US FIBERGLASS ROVING MARKET BY END USER (KILOTONS) 2020-2029
TABLE 23 CANADA FIBERGLASS ROVING MARKET BY PRODUCT TYPE (USD BILLION) 2020-2029
TABLE 24 CANADA FIBERGLASS ROVING MARKET BY PRODUCT TYPE (KILOTONS) 2020-2029
TABLE 25 CANADA FIBERGLASS ROVING MARKET BY GLASS TYPE (USD BILLION) 2020-2029
TABLE 26 CANADA FIBERGLASS ROVING MARKET BY GLASS TYPE (KILOTONS) 2020-2029
TABLE 27 CANADA FIBERGLASS ROVING MARKET BY END USER (USD BILLION) 2020-2029
TABLE 28 CANADA FIBERGLASS ROVING MARKET BY END USER (KILOTONS) 2020-2029
TABLE 29 MEXICO FIBERGLASS ROVING MARKET BY PRODUCT TYPE (USD BILLION) 2020-2029
TABLE 30 MEXICO FIBERGLASS ROVING MARKET BY PRODUCT TYPE (KILOTONS) 2020-2029
TABLE 31 MEXICO FIBERGLASS ROVING MARKET BY GLASS TYPE (USD BILLION) 2020-2029
TABLE 32 MEXICO FIBERGLASS ROVING MARKET BY GLASS TYPE (KILOTONS) 2020-2029
TABLE 33 MEXICO FIBERGLASS ROVING MARKET BY END USER (USD BILLION) 2020-2029
TABLE 34 MEXICO FIBERGLASS ROVING MARKET BY END USER (KILOTONS) 2020-2029
TABLE 35 SOUTH AMERICA FIBERGLASS ROVING MARKET BY COUNTRY (USD BILLION) 2020-2029
TABLE 36 SOUTH AMERICA FIBERGLASS ROVING MARKET BY COUNTRY (KILOTONS) 2020-2029
TABLE 37 SOUTH AMERICA FIBERGLASS ROVING MARKET BY PRODUCT TYPE (USD BILLION) 2020-2029
TABLE 38 SOUTH AMERICA FIBERGLASS ROVING MARKET BY PRODUCT TYPE (KILOTONS) 2020-2029
TABLE 39 SOUTH AMERICA FIBERGLASS ROVING MARKET BY GLASS TYPE (USD BILLION) 2020-2029
TABLE 40 SOUTH AMERICA FIBERGLASS ROVING MARKET BY GLASS TYPE (KILOTONS) 2020-2029
TABLE 41 SOUTH AMERICA FIBERGLASS ROVING MARKET BY END USER (USD BILLION) 2020-2029
TABLE 42 SOUTH AMERICA FIBERGLASS ROVING MARKET BY END USER (KILOTONS) 2020-2029
TABLE 43 BRAZIL FIBERGLASS ROVING MARKET BY PRODUCT TYPE (USD BILLION) 2020-2029
TABLE 44 BRAZIL FIBERGLASS ROVING MARKET BY PRODUCT TYPE (KILOTONS) 2020-2029
TABLE 45 BRAZIL FIBERGLASS ROVING MARKET BY GLASS TYPE (USD BILLION) 2020-2029
TABLE 46 BRAZIL FIBERGLASS ROVING MARKET BY GLASS TYPE (KILOTONS) 2020-2029
TABLE 47 BRAZIL FIBERGLASS ROVING MARKET BY END USER (USD BILLION) 2020-2029
TABLE 48 BRAZIL FIBERGLASS ROVING MARKET BY END USER (KILOTONS) 2020-2029
TABLE 49 ARGENTINA FIBERGLASS ROVING MARKET BY PRODUCT TYPE (USD BILLION) 2020-2029
TABLE 50 ARGENTINA FIBERGLASS ROVING MARKET BY PRODUCT TYPE (KILOTONS) 2020-2029
TABLE 51 ARGENTINA FIBERGLASS ROVING MARKET BY GLASS TYPE (USD BILLION) 2020-2029
TABLE 52 ARGENTINA FIBERGLASS ROVING MARKET BY GLASS TYPE (KILOTONS) 2020-2029
TABLE 53 ARGENTINA FIBERGLASS ROVING MARKET BY END USER (USD BILLION) 2020-2029
TABLE 54 ARGENTINA FIBERGLASS ROVING MARKET BY END USER (KILOTONS) 2020-2029
TABLE 55 COLOMBIA FIBERGLASS ROVING MARKET BY PRODUCT TYPE (USD BILLION) 2020-2029
TABLE 56 COLOMBIA FIBERGLASS ROVING MARKET BY PRODUCT TYPE (KILOTONS) 2020-2029
TABLE 57 COLOMBIA FIBERGLASS ROVING MARKET BY GLASS TYPE (USD BILLION) 2020-2029
TABLE 58 COLOMBIA FIBERGLASS ROVING MARKET BY GLASS TYPE (KILOTONS) 2020-2029
TABLE 59 COLOMBIA FIBERGLASS ROVING MARKET BY END USER (USD BILLION) 2020-2029
TABLE 60 COLOMBIA FIBERGLASS ROVING MARKET BY END USER (KILOTONS) 2020-2029
TABLE 61 REST OF SOUTH AMERICA FIBERGLASS ROVING MARKET BY PRODUCT TYPE (USD BILLION) 2020-2029
TABLE 62 REST OF SOUTH AMERICA FIBERGLASS ROVING MARKET BY PRODUCT TYPE (KILOTONS) 2020-2029
TABLE 63 REST OF SOUTH AMERICA FIBERGLASS ROVING MARKET BY GLASS TYPE (USD BILLION) 2020-2029
TABLE 64 REST OF SOUTH AMERICA FIBERGLASS ROVING MARKET BY GLASS TYPE (KILOTONS) 2020-2029
TABLE 65 REST OF SOUTH AMERICA FIBERGLASS ROVING MARKET BY END USER (USD BILLION) 2020-2029
TABLE 66 REST OF SOUTH AMERICA FIBERGLASS ROVING MARKET BY END USER (KILOTONS) 2020-2029
TABLE 67 ASIA-PACIFIC FIBERGLASS ROVING MARKET BY COUNTRY (USD BILLION) 2020-2029
TABLE 68 ASIA-PACIFIC FIBERGLASS ROVING MARKET BY COUNTRY (KILOTONS) 2020-2029
TABLE 69 ASIA-PACIFIC FIBERGLASS ROVING MARKET BY PRODUCT TYPE (USD BILLION) 2020-2029
TABLE 70 ASIA-PACIFIC FIBERGLASS ROVING MARKET BY PRODUCT TYPE (KILOTONS) 2020-2029
TABLE 71 ASIA-PACIFIC FIBERGLASS ROVING MARKET BY GLASS TYPE (USD BILLION) 2020-2029
TABLE 72 ASIA-PACIFIC FIBERGLASS ROVING MARKET BY GLASS TYPE (KILOTONS) 2020-2029
TABLE 73 ASIA-PACIFIC FIBERGLASS ROVING MARKET BY END USER (USD BILLION) 2020-2029
TABLE 74 ASIA-PACIFIC FIBERGLASS ROVING MARKET BY END USER (KILOTONS) 2020-2029
TABLE 75 INDIA FIBERGLASS ROVING MARKET BY PRODUCT TYPE (USD BILLION) 2020-2029
TABLE 76 INDIA FIBERGLASS ROVING MARKET BY PRODUCT TYPE (KILOTONS) 2020-2029
TABLE 77 INDIA FIBERGLASS ROVING MARKET BY GLASS TYPE (USD BILLION) 2020-2029
TABLE 78 INDIA FIBERGLASS ROVING MARKET BY GLASS TYPE (KILOTONS) 2020-2029
TABLE 79 INDIA FIBERGLASS ROVING MARKET BY END USER (USD BILLION) 2020-2029
TABLE 80 INDIA FIBERGLASS ROVING MARKET BY END USER (KILOTONS) 2020-2029
TABLE 81 CHINA FIBERGLASS ROVING MARKET BY PRODUCT TYPE (USD BILLION) 2020-2029
TABLE 82 CHINA FIBERGLASS ROVING MARKET BY PRODUCT TYPE (KILOTONS) 2020-2029
TABLE 83 CHINA FIBERGLASS ROVING MARKET BY GLASS TYPE (USD BILLION) 2020-2029
TABLE 84 CHINA FIBERGLASS ROVING MARKET BY GLASS TYPE (KILOTONS) 2020-2029
TABLE 85 CHINA FIBERGLASS ROVING MARKET BY END USER (USD BILLION) 2020-2029
TABLE 86 CHINA FIBERGLASS ROVING MARKET BY END USER (KILOTONS) 2020-2029
TABLE 87 JAPAN FIBERGLASS ROVING MARKET BY PRODUCT TYPE (USD BILLION) 2020-2029
TABLE 88 JAPAN FIBERGLASS ROVING MARKET BY PRODUCT TYPE (KILOTONS) 2020-2029
TABLE 89 JAPAN FIBERGLASS ROVING MARKET BY GLASS TYPE (USD BILLION) 2020-2029
TABLE 90 JAPAN FIBERGLASS ROVING MARKET BY GLASS TYPE (KILOTONS) 2020-2029
TABLE 91 JAPAN FIBERGLASS ROVING MARKET BY END USER (USD BILLION) 2020-2029
TABLE 92 JAPAN FIBERGLASS ROVING MARKET BY END USER (KILOTONS) 2020-2029
TABLE 93 SOUTH KOREA FIBERGLASS ROVING MARKET BY PRODUCT TYPE (USD BILLION) 2020-2029
TABLE 94 SOUTH KOREA FIBERGLASS ROVING MARKET BY PRODUCT TYPE (KILOTONS) 2020-2029
TABLE 95 SOUTH KOREA FIBERGLASS ROVING MARKET BY GLASS TYPE (USD BILLION) 2020-2029
TABLE 96 SOUTH KOREA FIBERGLASS ROVING MARKET BY GLASS TYPE (KILOTONS) 2020-2029
TABLE 97 SOUTH KOREA FIBERGLASS ROVING MARKET BY END USER (USD BILLION) 2020-2029
TABLE 98 SOUTH KOREA FIBERGLASS ROVING MARKET BY END USER (KILOTONS) 2020-2029
TABLE 99 AUSTRALIA FIBERGLASS ROVING MARKET BY PRODUCT TYPE (USD BILLION) 2020-2029
TABLE 100 AUSTRALIA FIBERGLASS ROVING MARKET BY PRODUCT TYPE (KILOTONS) 2020-2029
TABLE 101 AUSTRALIA FIBERGLASS ROVING MARKET BY GLASS TYPE (USD BILLION) 2020-2029
TABLE 102 AUSTRALIA FIBERGLASS ROVING MARKET BY GLASS TYPE (KILOTONS) 2020-2029
TABLE 103 AUSTRALIA FIBERGLASS ROVING MARKET BY END USER (USD BILLION) 2020-2029
TABLE 104 AUSTRALIA FIBERGLASS ROVING MARKET BY END USER (KILOTONS) 2020-2029
TABLE 105 SOUTH-EAST ASIA FIBERGLASS ROVING MARKET BY PRODUCT TYPE (USD BILLION) 2020-2029
TABLE 106 SOUTH-EAST ASIA FIBERGLASS ROVING MARKET BY PRODUCT TYPE (KILOTONS) 2020-2029
TABLE 107 SOUTH-EAST ASIA FIBERGLASS ROVING MARKET BY GLASS TYPE (USD BILLION) 2020-2029
TABLE 108 SOUTH-EAST ASIA FIBERGLASS ROVING MARKET BY GLASS TYPE (KILOTONS) 2020-2029
TABLE 109 SOUTH-EAST ASIA FIBERGLASS ROVING MARKET BY END USER (USD BILLION) 2020-2029
TABLE 110 SOUTH-EAST ASIA FIBERGLASS ROVING MARKET BY END USER (KILOTONS) 2020-2029
TABLE 111 REST OF ASIA PACIFIC FIBERGLASS ROVING MARKET BY PRODUCT TYPE (USD BILLION) 2020-2029
TABLE 112 REST OF ASIA PACIFIC FIBERGLASS ROVING MARKET BY PRODUCT TYPE (KILOTONS) 2020-2029
TABLE 113 REST OF ASIA PACIFIC FIBERGLASS ROVING MARKET BY GLASS TYPE (USD BILLION) 2020-2029
TABLE 114 REST OF ASIA PACIFIC FIBERGLASS ROVING MARKET BY GLASS TYPE (KILOTONS) 2020-2029
TABLE 115 REST OF ASIA PACIFIC FIBERGLASS ROVING MARKET BY END USER (USD BILLION) 2020-2029
TABLE 116 REST OF ASIA PACIFIC FIBERGLASS ROVING MARKET BY END USER (KILOTONS) 2020-2029
TABLE 117 EUROPE FIBERGLASS ROVING MARKET BY COUNTRY (USD BILLION) 2020-2029
TABLE 118 EUROPE FIBERGLASS ROVING MARKET BY COUNTRY (KILOTONS) 2020-2029
TABLE 119 EUROPE FIBERGLASS ROVING MARKET BY PRODUCT TYPE (USD BILLION) 2020-2029
TABLE 120 EUROPE FIBERGLASS ROVING MARKET BY PRODUCT TYPE (KILOTONS) 2020-2029
TABLE 121 EUROPE FIBERGLASS ROVING MARKET BY GLASS TYPE (USD BILLION) 2020-2029
TABLE 122 EUROPE FIBERGLASS ROVING MARKET BY GLASS TYPE (KILOTONS) 2020-2029
TABLE 123 EUROPE FIBERGLASS ROVING MARKET BY END USER (USD BILLION) 2020-2029
TABLE 124 EUROPE FIBERGLASS ROVING MARKET BY END USER (KILOTONS) 2020-2029
TABLE 125 GERMANY FIBERGLASS ROVING MARKET BY PRODUCT TYPE (USD BILLION) 2020-2029
TABLE 126 GERMANY FIBERGLASS ROVING MARKET BY PRODUCT TYPE (KILOTONS) 2020-2029
TABLE 127 GERMANY FIBERGLASS ROVING MARKET BY GLASS TYPE (USD BILLION) 2020-2029
TABLE 128 GERMANY FIBERGLASS ROVING MARKET BY GLASS TYPE (KILOTONS) 2020-2029
TABLE 129 GERMANY FIBERGLASS ROVING MARKET BY END USER (USD BILLION) 2020-2029
TABLE 130 GERMANY FIBERGLASS ROVING MARKET BY END USER (KILOTONS) 2020-2029
TABLE 131 UK FIBERGLASS ROVING MARKET BY PRODUCT TYPE (USD BILLION) 2020-2029
TABLE 132 UK FIBERGLASS ROVING MARKET BY PRODUCT TYPE (KILOTONS) 2020-2029
TABLE 133 UK FIBERGLASS ROVING MARKET BY GLASS TYPE (USD BILLION) 2020-2029
TABLE 134 UK FIBERGLASS ROVING MARKET BY GLASS TYPE (KILOTONS) 2020-2029
TABLE 135 UK FIBERGLASS ROVING MARKET BY END USER (USD BILLION) 2020-2029
TABLE 136 UK FIBERGLASS ROVING MARKET BY END USER (KILOTONS) 2020-2029
TABLE 137 FRANCE FIBERGLASS ROVING MARKET BY PRODUCT TYPE (USD BILLION) 2020-2029
TABLE 138 FRANCE FIBERGLASS ROVING MARKET BY PRODUCT TYPE (KILOTONS) 2020-2029
TABLE 139 FRANCE FIBERGLASS ROVING MARKET BY GLASS TYPE (USD BILLION) 2020-2029
TABLE 140 FRANCE FIBERGLASS ROVING MARKET BY GLASS TYPE (KILOTONS) 2020-2029
TABLE 141 FRANCE FIBERGLASS ROVING MARKET BY END USER (USD BILLION) 2020-2029
TABLE 142 FRANCE FIBERGLASS ROVING MARKET BY END USER (KILOTONS) 2020-2029
TABLE 143 ITALY FIBERGLASS ROVING MARKET BY PRODUCT TYPE (USD BILLION) 2020-2029
TABLE 144 ITALY FIBERGLASS ROVING MARKET BY PRODUCT TYPE (KILOTONS) 2020-2029
TABLE 145 ITALY FIBERGLASS ROVING MARKET BY GLASS TYPE (USD BILLION) 2020-2029
TABLE 146 ITALY FIBERGLASS ROVING MARKET BY GLASS TYPE (KILOTONS) 2020-2029
TABLE 147 ITALY FIBERGLASS ROVING MARKET BY END USER (USD BILLION) 2020-2029
TABLE 148 ITALY FIBERGLASS ROVING MARKET BY END USER (KILOTONS) 2020-2029
TABLE 149 SPAIN FIBERGLASS ROVING MARKET BY PRODUCT TYPE (USD BILLION) 2020-2029
TABLE 150 SPAIN FIBERGLASS ROVING MARKET BY PRODUCT TYPE (KILOTONS) 2020-2029
TABLE 151 SPAIN FIBERGLASS ROVING MARKET BY GLASS TYPE (USD BILLION) 2020-2029
TABLE 152 SPAIN FIBERGLASS ROVING MARKET BY GLASS TYPE (KILOTONS) 2020-2029
TABLE 153 SPAIN FIBERGLASS ROVING MARKET BY END USER (USD BILLION) 2020-2029
TABLE 154 SPAIN FIBERGLASS ROVING MARKET BY END USER (KILOTONS) 2020-2029
TABLE 155 RUSSIA FIBERGLASS ROVING MARKET BY PRODUCT TYPE (USD BILLION) 2020-2029
TABLE 156 RUSSIA FIBERGLASS ROVING MARKET BY PRODUCT TYPE (KILOTONS) 2020-2029
TABLE 157 RUSSIA FIBERGLASS ROVING MARKET BY GLASS TYPE (USD BILLION) 2020-2029
TABLE 158 RUSSIA FIBERGLASS ROVING MARKET BY GLASS TYPE (KILOTONS) 2020-2029
TABLE 159 RUSSIA FIBERGLASS ROVING MARKET BY END USER (USD BILLION) 2020-2029
TABLE 160 RUSSIA FIBERGLASS ROVING MARKET BY END USER (KILOTONS) 2020-2029
TABLE 161 REST OF EUROPE FIBERGLASS ROVING MARKET BY PRODUCT TYPE (USD BILLION) 2020-2029
TABLE 162 REST OF EUROPE FIBERGLASS ROVING MARKET BY PRODUCT TYPE (KILOTONS) 2020-2029
TABLE 163 REST OF EUROPE FIBERGLASS ROVING MARKET BY GLASS TYPE (USD BILLION) 2020-2029
TABLE 164 REST OF EUROPE FIBERGLASS ROVING MARKET BY GLASS TYPE (KILOTONS) 2020-2029
TABLE 165 REST OF EUROPE FIBERGLASS ROVING MARKET BY END USER (USD BILLION) 2020-2029
TABLE 166 REST OF EUROPE FIBERGLASS ROVING MARKET BY END USER (KILOTONS) 2020-2029
TABLE 167 MIDDLE EAST AND AFRICA FIBERGLASS ROVING MARKET BY COUNTRY (USD BILLION) 2020-2029
TABLE 168 MIDDLE EAST AND AFRICA FIBERGLASS ROVING MARKET BY COUNTRY (KILOTONS) 2020-2029
TABLE 169 MIDDLE EAST AND AFRICA FIBERGLASS ROVING MARKET BY PRODUCT TYPE (USD BILLION) 2020-2029
TABLE 170 MIDDLE EAST AND AFRICA FIBERGLASS ROVING MARKET BY PRODUCT TYPE (KILOTONS) 2020-2029
TABLE 171 MIDDLE EAST AND AFRICA FIBERGLASS ROVING MARKET BY GLASS TYPE (USD BILLION) 2020-2029
TABLE 172 MIDDLE EAST AND AFRICA FIBERGLASS ROVING MARKET BY GLASS TYPE (KILOTONS) 2020-2029
TABLE 173 MIDDLE EAST AND AFRICA FIBERGLASS ROVING MARKET BY END USER (USD BILLION) 2020-2029
TABLE 174 MIDDLE EAST AND AFRICA FIBERGLASS ROVING MARKET BY END USER (KILOTONS) 2020-2029
TABLE 175 UAE FIBERGLASS ROVING MARKET BY PRODUCT TYPE (USD BILLION) 2020-2029
TABLE 176 UAE FIBERGLASS ROVING MARKET BY PRODUCT TYPE (KILOTONS) 2020-2029
TABLE 177 UAE FIBERGLASS ROVING MARKET BY GLASS TYPE (USD BILLION) 2020-2029
TABLE 178 UAE FIBERGLASS ROVING MARKET BY GLASS TYPE (KILOTONS) 2020-2029
TABLE 179 UAE FIBERGLASS ROVING MARKET BY END USER (USD BILLION) 2020-2029
TABLE 180 UAE FIBERGLASS ROVING MARKET BY END USER (KILOTONS) 2020-2029
TABLE 181 SAUDI ARABIA FIBERGLASS ROVING MARKET BY PRODUCT TYPE (USD BILLION) 2020-2029
TABLE 182 SAUDI ARABIA FIBERGLASS ROVING MARKET BY PRODUCT TYPE (KILOTONS) 2020-2029
TABLE 183 SAUDI ARABIA FIBERGLASS ROVING MARKET BY GLASS TYPE (USD BILLION) 2020-2029
TABLE 184 SAUDI ARABIA FIBERGLASS ROVING MARKET BY GLASS TYPE (KILOTONS) 2020-2029
TABLE 185 SAUDI ARABIA FIBERGLASS ROVING MARKET BY END USER (USD BILLION) 2020-2029
TABLE 186 SAUDI ARABIA FIBERGLASS ROVING MARKET BY END USER (KILOTONS) 2020-2029
TABLE 187 SOUTH AFRICA FIBERGLASS ROVING MARKET BY PRODUCT TYPE (USD BILLION) 2020-2029
TABLE 188 SOUTH AFRICA FIBERGLASS ROVING MARKET BY PRODUCT TYPE (KILOTONS) 2020-2029
TABLE 189 SOUTH AFRICA FIBERGLASS ROVING MARKET BY GLASS TYPE (USD BILLION) 2020-2029
TABLE 190 SOUTH AFRICA FIBERGLASS ROVING MARKET BY GLASS TYPE (KILOTONS) 2020-2029
TABLE 191 SOUTH AFRICA FIBERGLASS ROVING MARKET BY END USER (USD BILLION) 2020-2029
TABLE 192 SOUTH AFRICA FIBERGLASS ROVING MARKET BY END USER (KILOTONS) 2020-2029
TABLE 193 REST OF MIDDLE EAST AND AFRICA FIBERGLASS ROVING MARKET BY PRODUCT TYPE (USD BILLION) 2020-2029
TABLE 194 REST OF MIDDLE EAST AND AFRICA FIBERGLASS ROVING MARKET BY PRODUCT TYPE (KILOTONS) 2020-2029
TABLE 195 REST OF MIDDLE EAST AND AFRICA FIBERGLASS ROVING MARKET BY GLASS TYPE (USD BILLION) 2020-2029
TABLE 196 REST OF MIDDLE EAST AND AFRICA FIBERGLASS ROVING MARKET BY GLASS TYPE (KILOTONS) 2020-2029
TABLE 197 REST OF MIDDLE EAST AND AFRICA FIBERGLASS ROVING MARKET BY END USER (USD BILLION) 2020-2029
TABLE 198 REST OF MIDDLE EAST AND AFRICA FIBERGLASS ROVING MARKET BY END USER (KILOTONS) 2020-2029
LIST OF FIGURES
FIGURE 1 MARKET DYNAMICS
FIGURE 2 MARKET SEGMENTATION
FIGURE 3 REPORT TIMELINES: YEARS CONSIDERED
FIGURE 4 DATA TRIANGULATION
FIGURE 5 BOTTOM-UP APPROACH
FIGURE 6 TOP-DOWN APPROACH
FIGURE 7 RESEARCH FLOW
FIGURE 8 GLOBAL FIBERGLASS ROVING MARKET BY PRODUCT TYPE, USD BILLION, 2020-2029
FIGURE 9 GLOBAL FIBERGLASS ROVING MARKET BY GLASS TYPE, USD BILLION, 2020-2029
FIGURE 10 GLOBAL FIBERGLASS ROVING MARKET BY END USER, USD BILLION, 2020-2029
FIGURE 11 GLOBAL FIBERGLASS ROVING MARKET BY REGION, USD BILLION, 2020-2029
FIGURE 12 PORTER’S FIVE FORCES MODEL
FIGURE 13 GLOBAL FIBERGLASS ROVING MARKET BY PRODUCT TYPE, USD BILLION, 2021
FIGURE 14 GLOBAL FIBERGLASS ROVING MARKET BY GLASS TYPE, USD BILLION, 2021
FIGURE 15 GLOBAL FIBERGLASS ROVING MARKET BY END USER, USD BILLION, 2021
FIGURE 16 GLOBAL FIBERGLASS ROVING MARKET BY REGION, USD BILLION, 2021
FIGURE 17 NORTH AMERICA FIBERGLASS ROVING MARKET SNAPSHOT
FIGURE 18 EUROPE FIBERGLASS ROVING MARKET SNAPSHOT
FIGURE 19 SOUTH AMERICA FIBERGLASS ROVING MARKET SNAPSHOT
FIGURE 20 ASIA PACIFIC FIBERGLASS ROVING MARKET SNAPSHOT
FIGURE 21 MIDDLE EAST ASIA AND AFRICA FIBERGLASS ROVING MARKET SNAPSHOT
FIGURE 22 MARKET SHARE ANALYSIS
FIGURE 23 TAIWAN GLASS INDUSTRY CORP.: COMPANY SNAPSHOT
FIGURE 24 OWENS CORNING: COMPANY SNAPSHOT
FIGURE 25 CHINA BEIHAI FIBERGLASS CO. LTD.: COMPANY SNAPSHOT
FIGURE 26 SAINT-GOBAIN S.A.: COMPANY SNAPSHOT
FIGURE 27 AGY HOLDINGS CORP: COMPANY SNAPSHOT
FIGURE 28 BINANI INDUSTRIES LTD.: COMPANY SNAPSHOT
FIGURE 29 NIPPON ELECTRICAL GLASS CO. LTD.: COMPANY SNAPSHOT
FIGURE 30 TAISHAN FIBERGLASS INC.: COMPANY SNAPSHOT
FIGURE 31 JUSHI INDIA FIBERGLASS (P) LTD.: COMPANY SNAPSHOT
FIGURE 32 JOHNS MANVILLE: COMPANY SNAPSHOT
DOWNLOAD FREE SAMPLE REPORT
License Type
SPEAK WITH OUR ANALYST
Want to know more about the report or any specific requirement?
WANT TO CUSTOMIZE THE REPORT?
Our Clients Speak
We asked them to research ‘ Equipment market’ all over the world, and their whole arrangement was helpful to us. thehealthanalytics.com insightful analysis and reports contributed to our current analysis and in creating a future strategy. Besides, the te
Yosuke Mitsui
Senior Associate Construction Equipment Sales & Marketing
We asked them to research ‘Equipment market’ all over the world, and their whole arrangement was helpful to us. thehealthanalytics.com insightful analysis and reports contributed to our current analysis and in creating a future strategy. Besides, the te


