

Base Year Value ()
x.x %
x.x %
CAGR ()
x.x %
x.x %
Forecast Year Value ()
x.x %
x.x %
Historical Data Period
Largest Region
Forecast Period
Mercado de vidrio electrocrómico por aplicación (ventanas, espejos y pantallas), por usuario final (construcción, automoción, aeroespacial) y región, tendencias globales y pronóstico de 2022 a 2029
Instant access to hundreds of data points and trends
- Market estimates from 2014-2029
- Competitive analysis, industry segmentation, financial benchmarks
- Incorporates SWOT, Porter's Five Forces and risk management frameworks
- PDF report or online database with Word, Excel and PowerPoint export options
- 100% money back guarantee
Descripción general del mercado del vidrio electrocrómico
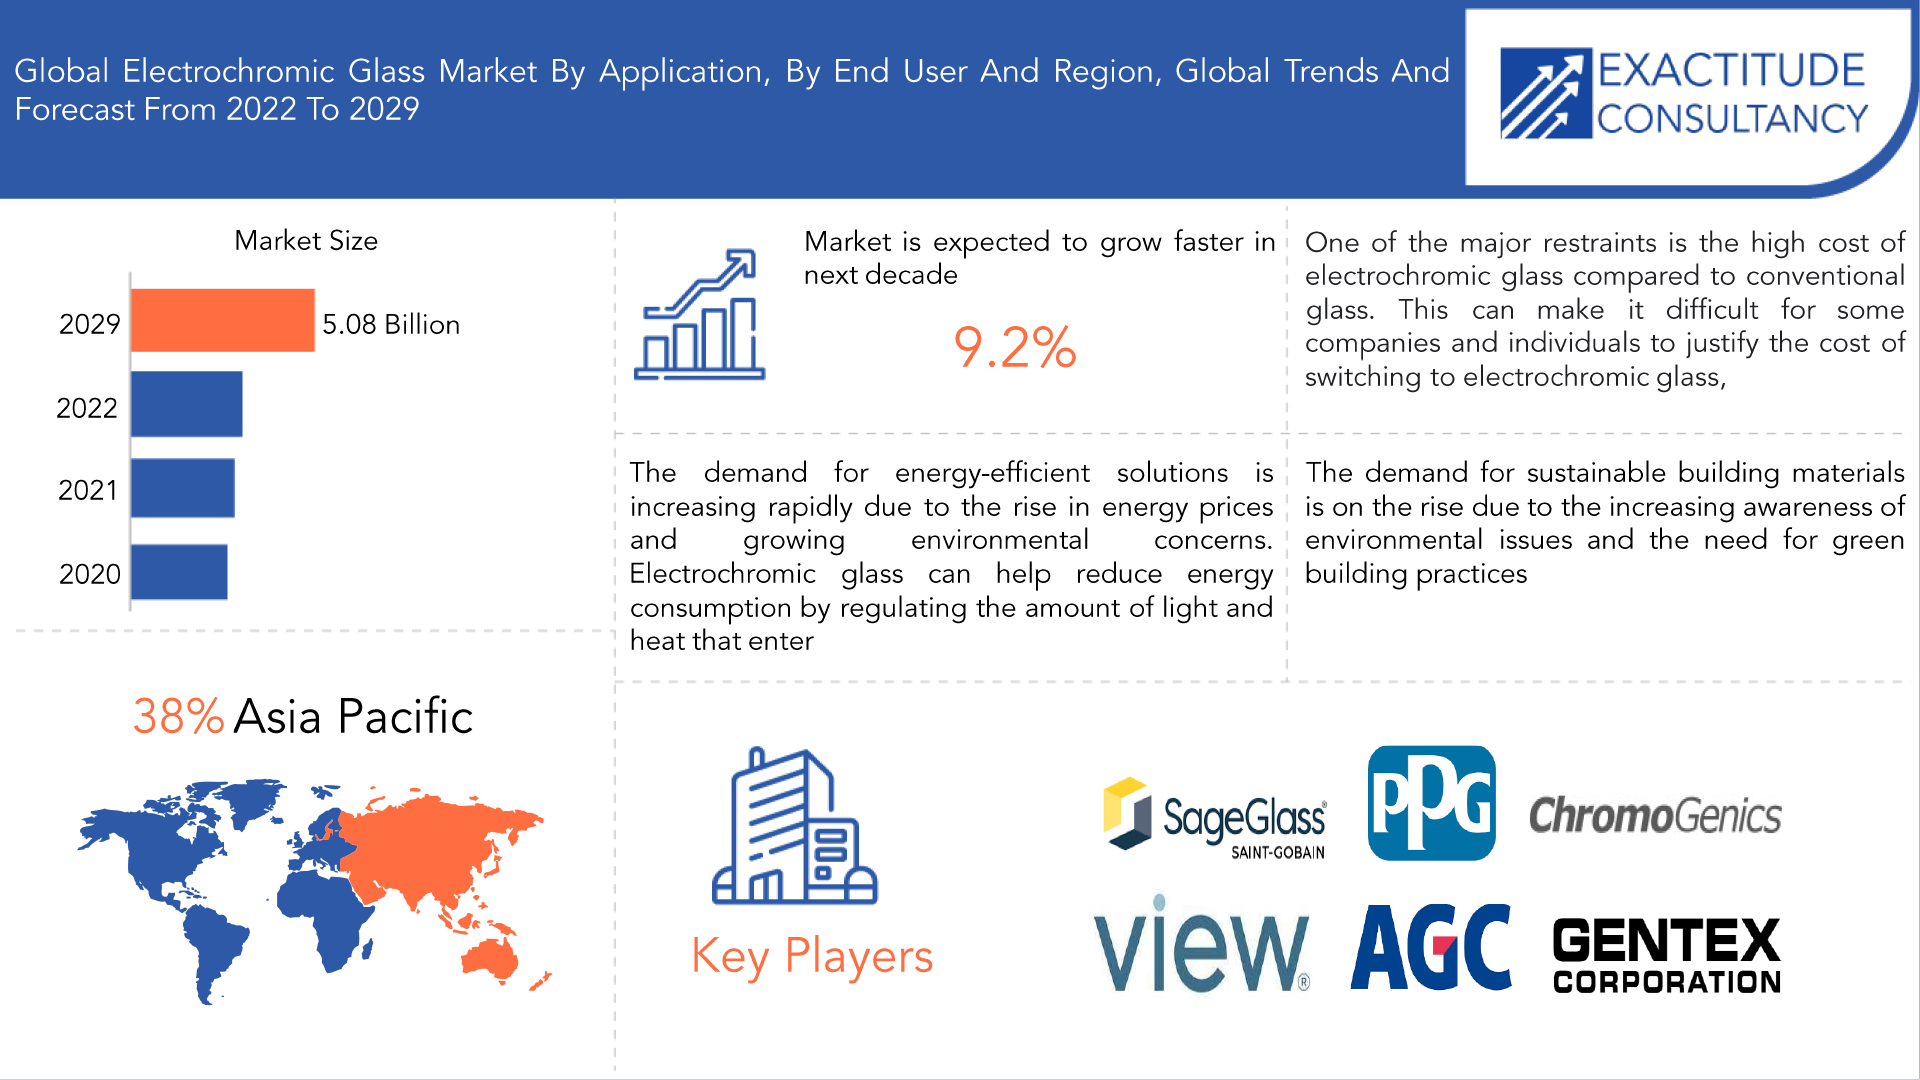
Se espera que el mercado mundial de vidrio electrocrómico crezca a una tasa compuesta anual del 9,20 % entre 2020 y 2029. Se espera que alcance más de 5080 millones de dólares en 2029 desde 2300 millones de dólares en 2020.
El vidrio electrocrómico es un tipo de vidrio inteligente que cambia su transparencia cuando se le aplica un voltaje. Dependiendo del voltaje que se le suministre al vidrio, su transparencia cambia de opaca a transparente. Este vidrio electrocrómico se utiliza en estructuras no residenciales, como lugares de trabajo, hospitales y hoteles en todo el mundo. Es particularmente eficaz en términos de conservación de energía y no deja que entre calor adicional en una habitación, lo que mantiene el espacio más fresco durante el verano y reduce el gasto de aire acondicionado. Esto se logra reflejando la luz que cae sobre el vidrio, lo que mantiene las habitaciones más frías.
La creciente demanda de soluciones energéticamente eficientes es un factor importante en el mercado del vidrio electrocrómico. A medida que aumentan los precios de la energía y aumentan las preocupaciones ambientales, existe una creciente necesidad de soluciones que puedan ayudar a reducir el consumo de energía y promover la sostenibilidad. El vidrio electrocrómico puede ayudar a reducir el consumo de energía al regular la cantidad de luz y calor que ingresa a un edificio, automóvil o avión. Esto puede ayudar a reducir la necesidad de iluminación artificial y aire acondicionado, que son fuentes importantes de consumo de energía. Al reducir el consumo de energía, el vidrio electrocrómico puede ayudar a reducir las facturas de energía, reducir las emisiones de gases de efecto invernadero y promover la eficiencia energética.
El complejo proceso de fabricación que requiere el vidrio electrocrómico es una limitación importante que podría limitar el crecimiento del mercado del vidrio electrocrómico. El proceso de fabricación del vidrio electrocrómico implica el uso de equipos y conocimientos especializados. El proceso implica depositar múltiples capas de materiales sobre un sustrato, que puede ser vidrio o plástico. A continuación, las capas se recocen y se cortan en el tamaño y la forma deseados. El proceso requiere un control estricto de la temperatura, la presión y otras condiciones para garantizar el rendimiento y la durabilidad deseados del vidrio electrocrómico.
| ATRIBUTO | DETALLES |
| Periodo de estudio | 2020-2029 |
| Año base | 2022 |
| Año estimado | 2022 |
| Año pronosticado | 2022-2029 |
| Periodo histórico | 2018-2020 |
| Unidad | Valor (miles de millones de USD), (Miles de unidades) |
| Segmentación | Por aplicación, usuario final y región. |
| Por aplicación |
|
| Por el usuario final |
|
| Por región |
|
La creciente adopción del vidrio electrocrómico en la industria automotriz es una de las oportunidades significativas del mercado del vidrio electrocrómico. El vidrio electrocrómico tiene muchas aplicaciones en la industria automotriz, incluidos los techos corredizos, los espejos retrovisores y los espejos laterales. Una de las principales ventajas del vidrio electrocrómico en la industria automotriz es su capacidad para regular la cantidad de luz y calor que ingresa a un automóvil. Esto puede mejorar la comodidad de los pasajeros y reducir la necesidad de aire acondicionado, lo que puede ahorrar energía y reducir el consumo de combustible. Además, el vidrio electrocrómico puede mejorar la seguridad de los automóviles al reducir el deslumbramiento del sol y de los faros de otros automóviles. Esto puede mejorar la visibilidad y reducir el riesgo de accidentes, particularmente de noche o en condiciones climáticas adversas.
Casi todas las industrias se vieron afectadas por la COVID-19, un desastre de salud pública mundial sin precedentes. La pandemia también ha alterado la cadena de suministro y la producción de vidrio electrocrómico. Muchas plantas de fabricación tuvieron que cerrar o reducir su capacidad de producción debido a los confinamientos y las restricciones, lo que provocó interrupciones en la cadena de suministro y retrasos en la entrega de los productos. Además, la pandemia ha provocado una desaceleración en la industria de la construcción, especialmente en las primeras etapas de la pandemia, cuando muchos proyectos de construcción se suspendieron. Esto ha afectado a la demanda de vidrio electrocrómico en la industria de la construcción. La pandemia también ha provocado una reducción de la demanda de productos automotrices, incluido el vidrio electrocrómico, ya que muchas personas trabajan desde casa y viajan menos. Esto ha provocado una reducción en la producción de automóviles y una desaceleración en la industria automotriz.
[título id="attachment_19276" align="aligncenter" width="1920"]
Frequently Asked Questions
• What is the worth of the Global Electrochromic Glass Market?
The Global Electrochromic Glass Market is expected to grow at 9.20 % CAGR from 2020 to 2029. It is expected to reach above USD 5.08 Billion by 2029 from USD 2.30 Billion in 2020.
• What is the size of the Asia Pacific Electrochromic Glass Market?
Asia Pacific held more than 38% of the Electrochromic Glass Market revenue share in 2020 and will witness tremendous expansion during the forecast period.
• What are some of the market's driving forces?
The demand for sustainable building materials is on the rise due to the increasing awareness of environmental issues and the need for green building practices. Electrochromic glass is considered a sustainable building material as it reduces energy consumption and promotes energy efficiency.
• Which are the top companies to hold the market share in the Electrochromic Glass Market?
The Electrochromic Glass Market key players include SAGE Electrochromics Inc., ChromoGenics AB, RavenBrick LLC, Asahi Glass Company, Gentex Corporation, EControl-Glas, Magna Glass & Window Inc., Guardian Industries, PPG Industries, View Inc.
• What is the leading Application of the Electrochromic Glass Market?
The construction sector is major sector where the application of Electrochromic Glass has seen more.
• Which is the largest regional market for Electrochromic Glass Market?
The Markets largest share is in the Asia Pacific region.
Electrochromic Glass Market Segment Analysis
Windows are expected to be the largest segment of the electrochromic glass market. This is due to electrochromic glass windows have widespread applications in the construction industry, including commercial and residential buildings. Electrochromic glass windows offer several advantages over traditional windows, including energy efficiency, improved indoor comfort, and reduced glare. They can also help to reduce the need for artificial lighting and air conditioning, which can lead to significant cost savings and environmental benefits.
The construction industry is expected to be the largest application segment of the electrochromic glass market. This is due to electrochromic glass has a wide range of applications in the construction industry, including windows, doors, skylights, facades, and partitions. Electrochromic glass is particularly useful in the construction industry due to it offers several advantages over traditional building materials. For example, electrochromic glass can help to reduce the energy consumption of buildings by regulating the amount of sunlight and heat that enters the building, which can lead to significant cost savings and environmental benefits.
[caption id="attachment_19285" align="aligncenter" width="1920"]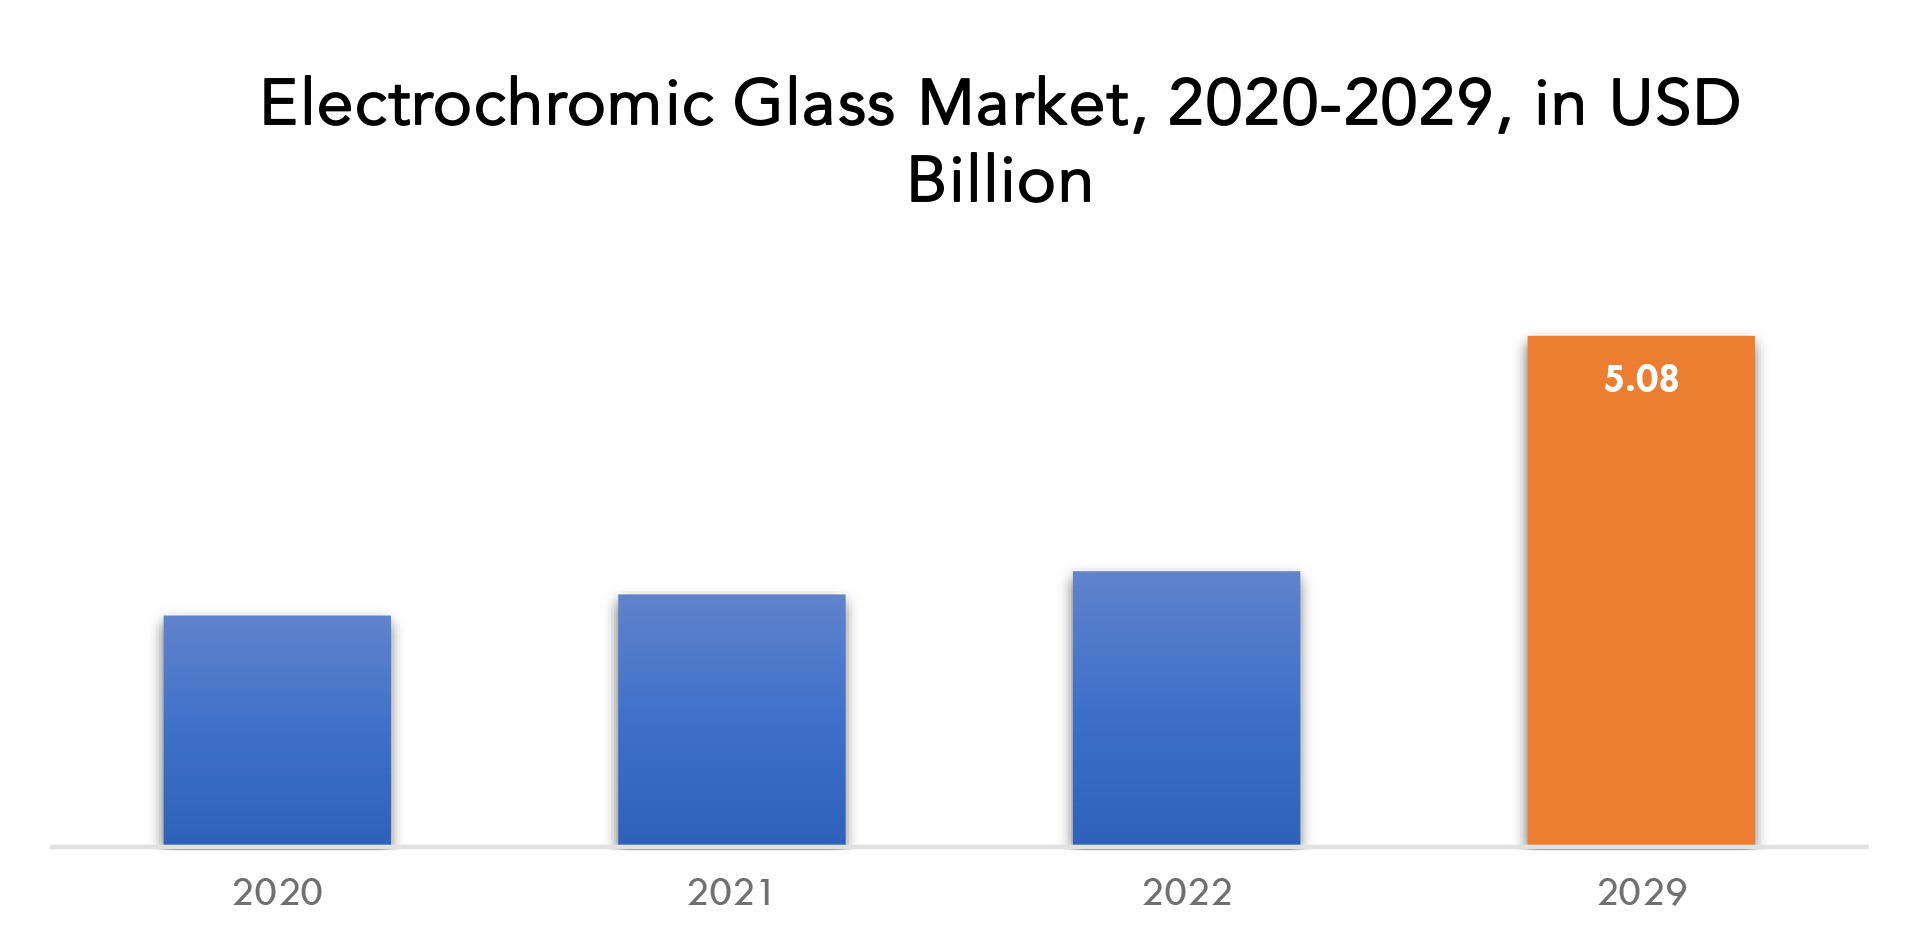
Electrochromic Glass Market Players
The Electrochromic Glass Market key players include SAGE Electrochromics Inc., ChromoGenics AB, RavenBrick LLC, Asahi Glass Company, Gentex Corporation, EControl-Glas, Magna Glass & Window Inc., Guardian Industries, PPG Industries, View Inc. For corporate expansion, these key leaders are implementing strategic formulations such as new product development and commercialization, commercial expansion, and distribution agreements. Moreover, these participants are substantially spending on product development, which is fueling revenue generation. Recent Developments: Feb 2023 - ChromoGenics was applying to patent its ConverLight® Interlayer that enabled the glazing industry to manufacture smart dynamic glass without the need to invest in new equipment. ConverLight® Interlayer was accelerating the implementation of ChromoGenic’s partner strategy by simplifying partner production of ConverLight® Dynamic glass. The innovation increases the scalability of this business and is expected to contribute to increased sales, improved cashflow, and a reduction in tied-up capital. May 2022 - AGC (AGC, Inc.; Headquarters: Tokyo; President: Yoshinori Hirai), a world-leading manufacturer of glass, chemicals and high-tech materials, had developed a light-control panoramic roof with Low-E coating, which had adopted for the LEXUS RZ, a dedicated BEV*1 model to be launched by TOYOTA MOTOR CORPORATION in the second half of 2022. The use of Low-E glass*2 with high solar control and heat insulating performance allows the panoramic roof to provide both an open cabin environment and a comfortable cabin temperature, while the elimination of a sunshade contributes to a lighter body.Who Should Buy? Or Key stakeholders
- Investors
- Raw Materials Manufacturer
- Supplier and Distributor
- Construction Companies
- Automobile Manufacturer
- Aerospace Sector
- Research Organizations
- Regulatory Authorities
- Institutional & retail players
- Others
Electrochromic Glass Market Regional Analysis
The electrochromic glass market by region includes North America, Asia-Pacific (APAC), Europe, South America, and Middle East & Africa (MEA).
- North America: includes the US, Canada, Mexico
- Asia Pacific: includes China, Japan, South Korea, India, Australia, ASEAN, and Rest of APAC
- Europe: includes the UK, Germany, France, Italy, Spain, Russia, and the Rest of Europe
- South America: includes Brazil, Argentina, and Rest of South America
- Middle East & Africa: includes Turkey, UAE, Saudi Arabia, South Africa, and the Rest of MEA
Asia Pacific is expected to be the largest market for electrochromic glass. This is due to several factors, including the growing construction industry, increasing adoption of energy-efficient solutions, and rising disposable incomes in the region. The construction industry in Asia Pacific is growing rapidly, driven by increasing urbanization and population growth. This is expected to drive the demand for energy-efficient solutions, including electrochromic glass, which can help to reduce energy consumption and improve indoor comfort in buildings. In addition, governments in the region are increasingly implementing energy efficiency standards and regulations for buildings, which is expected to further boost the demand for electrochromic glass.
The North American market for electrochromic glass is expected to grow steadily due to the increasing adoption of energy-efficient building materials and the presence of key players in the region. The United States is expected to be the largest market in the region due to the high demand for energy-efficient solutions in the construction industry.
[caption id="attachment_19294" align="aligncenter" width="1920"]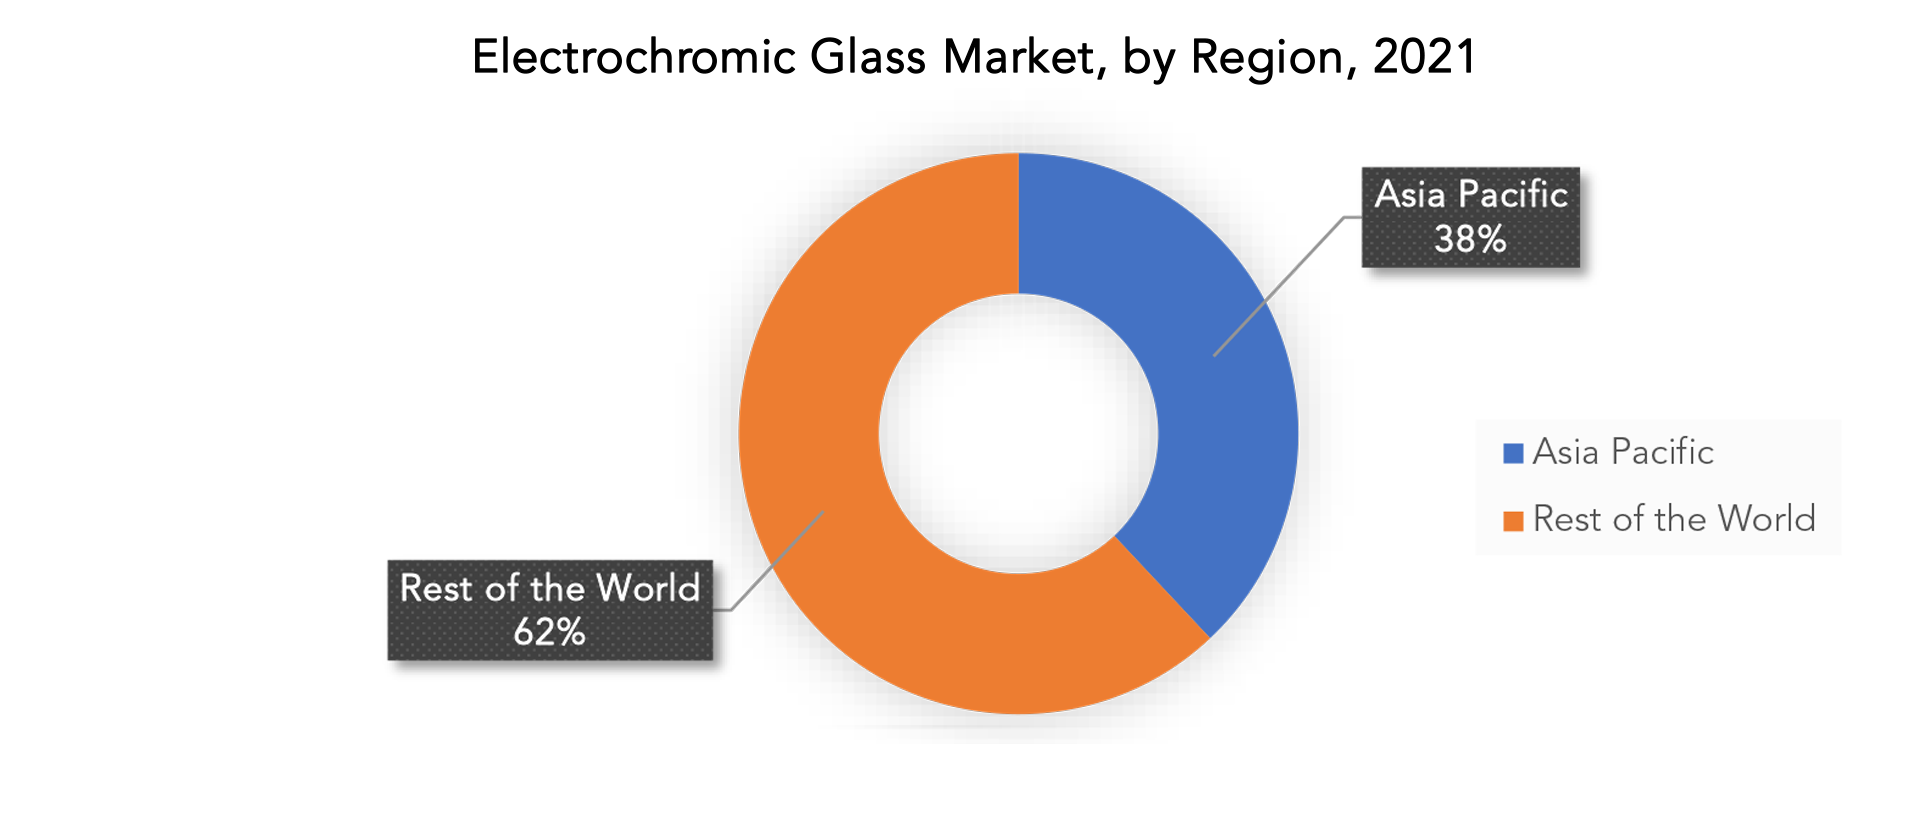
Key Market Segments: Electrochromic Glass Market
Electrochromic Glass Market By Application, 2020-2029, (USD Billion), (Thousand Units)- Windows
- Mirror
- Display
- Construction
- Automotive
- Aerospace
- North America
- Asia Pacific
- Europe
- South America
- Middle East And Africa
Exactitude Consultancy Services Key Objectives:
- Increasing sales and market share
- Developing new technology
- Improving profitability
- Entering new markets
- Enhancing brand reputation
Key Question Answered
- What is the expected growth rate of the electrochromic glass market over the next 7 years?
- Who are the major players in the electrochromic glass market and what is their market share?
- What are the end-user industries driving demand for market and what is their outlook?
- What are the opportunities for growth in emerging markets such as Asia-pacific, middle east, and Africa?
- How is the economic environment affecting the electrochromic glass market, including factors such as interest rates, inflation, and exchange rates?
- What is the expected impact of government policies and regulations on the electrochromic glass market?
- What is the current and forecasted size and growth rate of the global electrochromic glass market?
- What are the key drivers of growth in the electrochromic glass market?
- What are the distribution channels and supply chain dynamics in the electrochromic glass market?
- What are the technological advancements and innovations in the electrochromic glass market and their impact on product development and growth?
- What are the regulatory considerations and their impact on the market?
- What are the challenges faced by players in the electrochromic glass market and how are they addressing these challenges?
- What are the opportunities for growth and expansion in the electrochromic glass market?
- What are the product offerings and specifications of leading players in the market?
- What is the pricing trend of electrochromic glass in the market and what is the impact of raw material prices on the price trend?
- INTRODUCCIÓN
- DEFINICIÓN DE MERCADO
- SEGMENTACIÓN DEL MERCADO
- CRONOGRAMAS DE INVESTIGACIÓN
- SUPUESTOS Y LIMITACIONES
- METODOLOGÍA DE LA INVESTIGACIÓN
- MINERÍA DE DATOS
- INVESTIGACIÓN SECUNDARIA
- INVESTIGACIÓN PRIMARIA
- ASESORAMIENTO DE EXPERTOS EN LA MATERIA
- CONTROLES DE CALIDAD
- REVISIÓN FINAL
- TRIANGULACIÓN DE DATOS
- ENFOQUE DE ABAJO HACIA ARRIBA
- ENFOQUE DE ARRIBA HACIA ABAJO
- FLUJO DE INVESTIGACIÓN
- FUENTES DE DATOS
- MINERÍA DE DATOS
- RESUMEN EJECUTIVO
- PANORAMA DEL MERCADO
- PERSPECTIVAS DEL MERCADO MUNDIAL DEL VIDRIO ELECTROCROMICO
- IMPULSORES DEL MERCADO
- RESTRICCIONES DEL MERCADO
- OPORTUNIDADES DE MERCADO
- IMPACTO DEL COVID-19 EN EL MERCADO DEL VIDRIO ELECTROCROMICO
- MODELO DE LAS CINCO FUERZAS DE PORTER
- AMENAZA DE NUEVOS INGRESANTES
- AMENAZA DE SUSTITUTOS
- PODER DE NEGOCIACIÓN DE LOS PROVEEDORES
- PODER DE NEGOCIACIÓN DE LOS CLIENTES
- GRADO DE COMPETENCIA
- ANÁLISIS DE LA CADENA DE VALOR DE LA INDUSTRIA
- PERSPECTIVAS DEL MERCADO MUNDIAL DEL VIDRIO ELECTROCROMICO
- MERCADO GLOBAL DE VIDRIO ELECTROCROMICO POR USUARIO FINAL, 2020-2029, (MILES DE MILLONES DE USD), (MILES DE UNIDADES)
- VENTANAS
- ESPEJO
- MOSTRAR
- MERCADO GLOBAL DE VIDRIO ELECTROCROMICO POR USUARIO FINAL, 2020-2029, (MILES DE MILLONES DE USD), (MILES DE UNIDADES)
- CONSTRUCCIÓN
- AUTOMOTOR
- AEROESPACIAL
- MERCADO GLOBAL DE VIDRIO ELECTROCROMICO POR REGIÓN, 2020-2029, (MILES DE MILLONES DE USD), (MILES DE UNIDADES)
- AMÉRICA DEL NORTE
- A NOSOTROS
- CANADÁ
- MÉXICO
- SUDAMERICA
- BRASIL
- ARGENTINA
- COLOMBIA
- RESTO DE SUDAMÉRICA
- EUROPA
- ALEMANIA
- Reino Unido
- FRANCIA
- ITALIA
- ESPAÑA
- RUSIA
- RESTO DE EUROPA
- ASIA PACÍFICO
- INDIA
- PORCELANA
- JAPÓN
- SOUTH KOREA
- AUSTRALIA
- SOUTH-EAST ASIA
- REST OF ASIA PACIFIC
- MIDDLE EAST AND AFRICA
- UAE
- SAUDI ARABIA
- SOUTH AFRICA
- REST OF MIDDLE EAST AND AFRICA
- AMÉRICA DEL NORTE
- COMPANY PROFILES* (BUSINESS OVERVIEW, COMPANY SNAPSHOT, PRODUCTS OFFERED, RECENT DEVELOPMENTS)
- SAGE ELECTROCHROMICS INC.
- CHROMOGENICS AB
- RAVENBRICK LLC
- ASAHI GLASS COMPANY
- GENTEX CORPORATION
- ECONTROL-GLASS
- MAGNA GLASS & WINDOW INC.
- GUARDIAN INDUSTRIES
- PPG INDUSTRIES
- VIEW INC. *THE COMPANY LIST IS INDICATIVE
LIST OF TABLES
TABLE 1 GLOBAL ELECTROCHROMIC GLASS MARKET BY APPLICATION (USD BILLION), 2020-2029
TABLE 2 GLOBAL ELECTROCHROMIC GLASS MARKET BY APPLICATION (THOUSAND UNITS), 2020-2029
TABLE 3 GLOBAL ELECTROCHROMIC GLASS MARKET BY END USER (USD BILLION), 2020-2029
TABLE 4 GLOBAL ELECTROCHROMIC GLASS MARKET BY END USER (THOUSAND UNITS), 2020-2029
TABLE 5 GLOBAL ELECTROCHROMIC GLASS MARKET BY REGION (USD BILLION), 2020-2029
TABLE 6 GLOBAL ELECTROCHROMIC GLASS MARKET BY REGION (THOUSAND UNITS), 2020-2029
TABLE 7 NORTH AMERICA ELECTROCHROMIC GLASS MARKET BY APPLICATION (USD BILLION), 2020-2029
TABLE 8 NORTH AMERICA ELECTROCHROMIC GLASS MARKET BY APPLICATION (THOUSAND UNITS), 2020-2029
TABLE 9 NORTH AMERICA ELECTROCHROMIC GLASS MARKET BY END USER (USD BILLION), 2020-2029
TABLE 10 NORTH AMERICA ELECTROCHROMIC GLASS MARKET BY END USER (THOUSAND UNITS), 2020-2029
TABLE 11 NORTH AMERICA ELECTROCHROMIC GLASS MARKET BY COUNTRY (USD BILLION), 2020-2029
TABLE 12 NORTH AMERICA ELECTROCHROMIC GLASS MARKET BY COUNTRY (THOUSAND UNITS), 2020-2029
TABLE 13 US ELECTROCHROMIC GLASS MARKET BY APPLICATION (USD BILLION), 2020-2029
TABLE 14 US ELECTROCHROMIC GLASS MARKET BY APPLICATION (THOUSAND UNITS), 2020-2029
TABLE 15 US ELECTROCHROMIC GLASS MARKET BY END USER (USD BILLION), 2020-2029
TABLE 16 US ELECTROCHROMIC GLASS MARKET BY END USER (THOUSAND UNITS), 2020-2029
TABLE 17 CANADA ELECTROCHROMIC GLASS MARKET BY APPLICATION (USD BILLION), 2020-2029
TABLE 18 CANADA ELECTROCHROMIC GLASS MARKET BY APPLICATION (THOUSAND UNITS), 2020-2029
TABLE 19 CANADA ELECTROCHROMIC GLASS MARKET BY END USER (USD BILLION), 2020-2029
TABLE 20 CANADA ELECTROCHROMIC GLASS MARKET BY END USER (THOUSAND UNITS), 2020-2029
TABLE 21 MEXICO ELECTROCHROMIC GLASS MARKET BY APPLICATION (USD BILLION), 2020-2029
TABLE 22 MEXICO ELECTROCHROMIC GLASS MARKET BY APPLICATION (THOUSAND UNITS), 2020-2029
TABLE 23 MEXICO ELECTROCHROMIC GLASS MARKET BY END USER (USD BILLION), 2020-2029
TABLE 24 MEXICO ELECTROCHROMIC GLASS MARKET BY END USER (THOUSAND UNITS), 2020-2029
TABLE 25 SOUTH AMERICA ELECTROCHROMIC GLASS MARKET BY APPLICATION (USD BILLION), 2020-2029
TABLE 26 SOUTH AMERICA ELECTROCHROMIC GLASS MARKET BY APPLICATION (THOUSAND UNITS), 2020-2029
TABLE 27 SOUTH AMERICA ELECTROCHROMIC GLASS MARKET BY END USER (USD BILLION), 2020-2029
TABLE 28 SOUTH AMERICA ELECTROCHROMIC GLASS MARKET BY END USER (THOUSAND UNITS), 2020-2029
TABLE 29 BRAZIL ELECTROCHROMIC GLASS MARKET BY APPLICATION (USD BILLION), 2020-2029
TABLE 30 BRAZIL ELECTROCHROMIC GLASS MARKET BY APPLICATION (THOUSAND UNITS), 2020-2029
TABLE 31 BRAZIL ELECTROCHROMIC GLASS MARKET BY END USER (USD BILLION), 2020-2029
TABLE 32 BRAZIL ELECTROCHROMIC GLASS MARKET BY END USER (THOUSAND UNITS), 2020-2029
TABLE 33 ARGENTINA ELECTROCHROMIC GLASS MARKET BY APPLICATION (USD BILLION), 2020-2029
TABLE 34 ARGENTINA ELECTROCHROMIC GLASS MARKET BY APPLICATION (THOUSAND UNITS), 2020-2029
TABLE 35 ARGENTINA ELECTROCHROMIC GLASS MARKET BY END USER (USD BILLION), 2020-2029
TABLE 36 ARGENTINA ELECTROCHROMIC GLASS MARKET BY END USER (THOUSAND UNITS), 2020-2029
TABLE 37 COLOMBIA ELECTROCHROMIC GLASS MARKET BY APPLICATION (USD BILLION), 2020-2029
TABLE 38 COLOMBIA ELECTROCHROMIC GLASS MARKET BY APPLICATION (THOUSAND UNITS), 2020-2029
TABLE 39 COLOMBIA ELECTROCHROMIC GLASS MARKET BY END USER (USD BILLION), 2020-2029
TABLE 40 COLOMBIA ELECTROCHROMIC GLASS MARKET BY END USER (THOUSAND UNITS), 2020-2029
TABLE 41 REST OF SOUTH AMERICA ELECTROCHROMIC GLASS MARKET BY APPLICATION (USD BILLION), 2020-2029
TABLE 42 REST OF SOUTH AMERICA ELECTROCHROMIC GLASS MARKET BY APPLICATION (THOUSAND UNITS), 2020-2029
TABLE 43 REST OF SOUTH AMERICA ELECTROCHROMIC GLASS MARKET BY END USER (USD BILLION), 2020-2029
TABLE 44 REST OF SOUTH AMERICA ELECTROCHROMIC GLASS MARKET BY END USER (THOUSAND UNITS), 2020-2029
TABLE 45 ASIA-PACIFIC ELECTROCHROMIC GLASS MARKET BY APPLICATION (USD BILLION), 2020-2029
TABLE 46 ASIA-PACIFIC ELECTROCHROMIC GLASS MARKET BY APPLICATION (THOUSAND UNITS), 2020-2029
TABLE 47 ASIA-PACIFIC ELECTROCHROMIC GLASS MARKET BY END USER (USD BILLION), 2020-2029
TABLE 48 ASIA-PACIFIC ELECTROCHROMIC GLASS MARKET BY END USER (THOUSAND UNITS), 2020-2029
TABLE 49 ASIA-PACIFIC ELECTROCHROMIC GLASS MARKET BY COUNTRY (USD BILLION), 2020-2029
TABLE 50 ASIA-PACIFIC ELECTROCHROMIC GLASS MARKET BY COUNTRY (THOUSAND UNITS), 2020-2029
TABLE 51 INDIA ELECTROCHROMIC GLASS MARKET BY APPLICATION (USD BILLION), 2020-2029
TABLE 52 INDIA ELECTROCHROMIC GLASS MARKET BY APPLICATION (THOUSAND UNITS), 2020-2029
TABLE 53 INDIA ELECTROCHROMIC GLASS MARKET BY END USER (USD BILLION), 2020-2029
TABLE 54 INDIA ELECTROCHROMIC GLASS MARKET BY END USER (THOUSAND UNITS), 2020-2029
TABLE 55 CHINA ELECTROCHROMIC GLASS MARKET BY APPLICATION (USD BILLION), 2020-2029
TABLE 56 CHINA ELECTROCHROMIC GLASS MARKET BY APPLICATION (THOUSAND UNITS), 2020-2029
TABLE 57 CHINA ELECTROCHROMIC GLASS MARKET BY END USER (USD BILLION), 2020-2029
TABLE 58 CHINA ELECTROCHROMIC GLASS MARKET BY END USER (THOUSAND UNITS), 2020-2029
TABLE 59 JAPAN ELECTROCHROMIC GLASS MARKET BY APPLICATION (USD BILLION), 2020-2029
TABLE 60 JAPAN ELECTROCHROMIC GLASS MARKET BY APPLICATION (THOUSAND UNITS), 2020-2029
TABLE 61 JAPAN ELECTROCHROMIC GLASS MARKET BY END USER (USD BILLION), 2020-2029
TABLE 62 JAPAN ELECTROCHROMIC GLASS MARKET BY END USER (THOUSAND UNITS), 2020-2029
TABLE 63 SOUTH KOREA ELECTROCHROMIC GLASS MARKET BY APPLICATION (USD BILLION), 2020-2029
TABLE 64 SOUTH KOREA ELECTROCHROMIC GLASS MARKET BY APPLICATION (THOUSAND UNITS), 2020-2029
TABLE 65 SOUTH KOREA ELECTROCHROMIC GLASS MARKET BY END USER (USD BILLION), 2020-2029
TABLE 66 SOUTH KOREA ELECTROCHROMIC GLASS MARKET BY END USER (THOUSAND UNITS), 2020-2029
TABLE 67 AUSTRALIA ELECTROCHROMIC GLASS MARKET BY APPLICATION (USD BILLION), 2020-2029
TABLE 68 AUSTRALIA ELECTROCHROMIC GLASS MARKET BY APPLICATION (THOUSAND UNITS), 2020-2029
TABLE 69 AUSTRALIA ELECTROCHROMIC GLASS MARKET BY END USER (USD BILLION), 2020-2029
TABLE 70 AUSTRALIA ELECTROCHROMIC GLASS MARKET BY END USER (THOUSAND UNITS), 2020-2029
TABLE 71 SOUTH EAST ASIA ELECTROCHROMIC GLASS MARKET BY APPLICATION (USD BILLION), 2020-2029
TABLE 72 SOUTH EAST ASIA ELECTROCHROMIC GLASS MARKET BY APPLICATION (THOUSAND UNITS), 2020-2029
TABLE 73 SOUTH EAST ASIA ELECTROCHROMIC GLASS MARKET BY END USER (USD BILLION), 2020-2029
TABLE 74 SOUTH EAST ASIA ELECTROCHROMIC GLASS MARKET BY END USER (THOUSAND UNITS), 2020-2029
TABLE 75 REST OF ASIA PACIFIC ELECTROCHROMIC GLASS MARKET BY APPLICATION (USD BILLION), 2020-2029
TABLE 76 REST OF ASIA PACIFIC ELECTROCHROMIC GLASS MARKET BY APPLICATION (THOUSAND UNITS), 2020-2029
TABLE 77 REST OF ASIA PACIFIC ELECTROCHROMIC GLASS MARKET BY END USER (USD BILLION), 2020-2029
TABLE 78 REST OF ASIA PACIFIC ELECTROCHROMIC GLASS MARKET BY END USER (THOUSAND UNITS), 2020-2029
TABLE 79 EUROPE ELECTROCHROMIC GLASS MARKET BY APPLICATION (USD BILLION), 2020-2029
TABLE 80 EUROPE ELECTROCHROMIC GLASS MARKET BY APPLICATION (THOUSAND UNITS), 2020-2029
TABLE 81 EUROPE ELECTROCHROMIC GLASS MARKET BY END USER (USD BILLION), 2020-2029
TABLE 82 EUROPE ELECTROCHROMIC GLASS MARKET BY END USER (THOUSAND UNITS), 2020-2029
TABLE 83 EUROPE ELECTROCHROMIC GLASS MARKET BY COUNTRY (USD BILLION), 2020-2029
TABLE 84 EUROPE ELECTROCHROMIC GLASS MARKET BY COUNTRY (THOUSAND UNITS), 2020-2029
TABLE 85 GERMANY ELECTROCHROMIC GLASS MARKET BY APPLICATION (USD BILLION), 2020-2029
TABLE 86 GERMANY ELECTROCHROMIC GLASS MARKET BY APPLICATION (THOUSAND UNITS), 2020-2029
TABLE 87 GERMANY ELECTROCHROMIC GLASS MARKET BY END USER (USD BILLION), 2020-2029
TABLE 88 GERMANY ELECTROCHROMIC GLASS MARKET BY END USER (THOUSAND UNITS), 2020-2029
TABLE 89 UK ELECTROCHROMIC GLASS MARKET BY APPLICATION (USD BILLION), 2020-2029
TABLE 90 UK ELECTROCHROMIC GLASS MARKET BY APPLICATION (THOUSAND UNITS), 2020-2029
TABLE 91 UK ELECTROCHROMIC GLASS MARKET BY END USER (USD BILLION), 2020-2029
TABLE 92 UK ELECTROCHROMIC GLASS MARKET BY END USER (THOUSAND UNITS), 2020-2029
TABLE 93 FRANCE ELECTROCHROMIC GLASS MARKET BY APPLICATION (USD BILLION), 2020-2029
TABLE 94 FRANCE ELECTROCHROMIC GLASS MARKET BY APPLICATION (THOUSAND UNITS), 2020-2029
TABLE 95 FRANCE ELECTROCHROMIC GLASS MARKET BY END USER (USD BILLION), 2020-2029
TABLE 96 FRANCE ELECTROCHROMIC GLASS MARKET BY END USER (THOUSAND UNITS), 2020-2029
TABLE 97 ITALY ELECTROCHROMIC GLASS MARKET BY APPLICATION (USD BILLION), 2020-2029
TABLE 98 ITALY ELECTROCHROMIC GLASS MARKET BY APPLICATION (THOUSAND UNITS), 2020-2029
TABLE 99 ITALY ELECTROCHROMIC GLASS MARKET BY END USER (USD BILLION), 2020-2029
TABLE 100 ITALY ELECTROCHROMIC GLASS MARKET BY END USER (THOUSAND UNITS), 2020-2029
TABLE 101 SPAIN ELECTROCHROMIC GLASS MARKET BY APPLICATION (USD BILLION), 2020-2029
TABLE 102 SPAIN ELECTROCHROMIC GLASS MARKET BY APPLICATION (THOUSAND UNITS), 2020-2029
TABLE 103 SPAIN ELECTROCHROMIC GLASS MARKET BY END USER (USD BILLION), 2020-2029
TABLE 104 SPAIN ELECTROCHROMIC GLASS MARKET BY END USER (THOUSAND UNITS), 2020-2029
TABLE 105 RUSSIA ELECTROCHROMIC GLASS MARKET BY APPLICATION (USD BILLION), 2020-2029
TABLE 106 RUSSIA ELECTROCHROMIC GLASS MARKET BY APPLICATION (THOUSAND UNITS), 2020-2029
TABLE 107 RUSSIA ELECTROCHROMIC GLASS MARKET BY END USER (USD BILLION), 2020-2029
TABLE 108 RUSSIA ELECTROCHROMIC GLASS MARKET BY END USER (THOUSAND UNITS), 2020-2029
TABLE 109 REST OF EUROPE ELECTROCHROMIC GLASS MARKET BY APPLICATION (USD BILLION), 2020-2029
TABLE 110 REST OF EUROPE ELECTROCHROMIC GLASS MARKET BY APPLICATION (THOUSAND UNITS), 2020-2029
TABLE 111 REST OF EUROPE ELECTROCHROMIC GLASS MARKET BY END USER (USD BILLION), 2020-2029
TABLE 112 REST OF EUROPE ELECTROCHROMIC GLASS MARKET BY END USER (THOUSAND UNITS), 2020-2029
TABLE 113 MIDDLE EAST AND AFRICA ELECTROCHROMIC GLASS MARKET BY APPLICATION (USD BILLION), 2020-2029
TABLE 114 MIDDLE EAST AND AFRICA ELECTROCHROMIC GLASS MARKET BY APPLICATION (THOUSAND UNITS), 2020-2029
TABLE 115 MIDDLE EAST AND AFRICA ELECTROCHROMIC GLASS MARKET BY END USER (USD BILLION), 2020-2029
TABLE 116 MIDDLE EAST AND AFRICA ELECTROCHROMIC GLASS MARKET BY END USER (THOUSAND UNITS), 2020-2029
TABLE 117 MIDDLE EAST AND AFRICA ELECTROCHROMIC GLASS MARKET BY COUNTRY (USD BILLION), 2020-2029
TABLE 118 MIDDLE EAST AND AFRICA ELECTROCHROMIC GLASS MARKET BY COUNTRY (THOUSAND UNITS), 2020-2029
TABLE 119 UAE ELECTROCHROMIC GLASS MARKET BY APPLICATION (USD BILLION), 2020-2029
TABLE 120 UAE ELECTROCHROMIC GLASS MARKET BY APPLICATION (THOUSAND UNITS), 2020-2029
TABLE 121 UAE ELECTROCHROMIC GLASS MARKET BY END USER (USD BILLION), 2020-2029
TABLE 122 UAE ELECTROCHROMIC GLASS MARKET BY END USER (THOUSAND UNITS), 2020-2029
TABLE 123 SAUDI ARABIA ELECTROCHROMIC GLASS MARKET BY APPLICATION (USD BILLION), 2020-2029
TABLE 124 SAUDI ARABIA ELECTROCHROMIC GLASS MARKET BY APPLICATION (THOUSAND UNITS), 2020-2029
TABLE 125 SAUDI ARABIA ELECTROCHROMIC GLASS MARKET BY END USER (USD BILLION), 2020-2029
TABLE 126 SAUDI ARABIA ELECTROCHROMIC GLASS MARKET BY END USER (THOUSAND UNITS), 2020-2029
TABLE 127 SOUTH AFRICA ELECTROCHROMIC GLASS MARKET BY APPLICATION (USD BILLION), 2020-2029
TABLE 128 SOUTH AFRICA ELECTROCHROMIC GLASS MARKET BY APPLICATION (THOUSAND UNITS), 2020-2029
TABLE 129 SOUTH AFRICA ELECTROCHROMIC GLASS MARKET BY END USER (USD BILLION), 2020-2029
TABLE 130 SOUTH AFRICA ELECTROCHROMIC GLASS MARKET BY END USER (THOUSAND UNITS), 2020-2029
TABLE 131 REST OF MIDDLE EAST AND AFRICA ELECTROCHROMIC GLASS MARKET BY APPLICATION (USD BILLION), 2020-2029
TABLE 132 REST OF MIDDLE EAST AND AFRICA ELECTROCHROMIC GLASS MARKET BY APPLICATION (THOUSAND UNITS), 2020-2029
TABLE 133 REST OF MIDDLE EAST AND AFRICA ELECTROCHROMIC GLASS MARKET BY END USER (USD BILLION), 2020-2029
TABLE 134 REST OF MIDDLE EAST AND AFRICA ELECTROCHROMIC GLASS MARKET BY END USER (THOUSAND UNITS), 2020-2029
LIST OF FIGURES
FIGURE 1 MARKET DYNAMICS
FIGURE 2 MARKET SEGMENTATION
FIGURE 3 REPORT TIMELINES: YEARS CONSIDERED
FIGURE 4 DATA TRIANGULATION
FIGURE 5 BOTTOM-UP APPROACH
FIGURE 6 TOP-DOWN APPROACH
FIGURE 7 RESEARCH FLOW
FIGURE 8 GLOBAL ELECTROCHROMIC GLASS MARKET BY APPLICATION, USD BILLION, 2020-2029
FIGURE 9 GLOBAL ELECTROCHROMIC GLASS MARKET BY END USER, USD BILLION, 2020-2029
FIGURE 10 GLOBAL ELECTROCHROMIC GLASS MARKET BY REGION, USD BILLION, 2020-2029
FIGURE 11 PORTER’S FIVE FORCES MODEL
FIGURE 12 GLOBAL ELECTROCHROMIC GLASS MARKET BY APPLICATION, USD BILLION, 2021
FIGURE 13 GLOBAL ELECTROCHROMIC GLASS MARKET BY END USER, USD BILLION, 2021
FIGURE 14 GLOBAL ELECTROCHROMIC GLASS MARKET BY REGION, USD BILLION, 2021
FIGURE 15 MARKET SHARE ANALYSIS
FIGURE 16 SAGE ELECTROCHROMICS INC.: COMPANY SNAPSHOT
FIGURE 17 CHROMOGENICS AB: COMPANY SNAPSHOT
FIGURE 18 RAVENBRICK LLC: COMPANY SNAPSHOT
FIGURE 19 ASAHI GLASS COMPANY: COMPANY SNAPSHOT
FIGURE 20 GENTEX CORPORATION: COMPANY SNAPSHOT
FIGURE 21 ECONTROL-GLASS: COMPANY SNAPSHOT
FIGURE 22 MAGNA GLASS & WINDOW INC.: COMPANY SNAPSHOT
FIGURE 23 GUARDIAN INDUSTRIES: COMPANY SNAPSHOT
FIGURE 24 PPG INDUSTRIES: COMPANY SNAPSHOT
FIGURE 25 VIEW INC.: COMPANY SNAPSHOT
DOWNLOAD FREE SAMPLE REPORT
License Type
SPEAK WITH OUR ANALYST
Want to know more about the report or any specific requirement?
WANT TO CUSTOMIZE THE REPORT?
Our Clients Speak
We asked them to research ‘ Equipment market’ all over the world, and their whole arrangement was helpful to us. thehealthanalytics.com insightful analysis and reports contributed to our current analysis and in creating a future strategy. Besides, the te
Yosuke Mitsui
Senior Associate Construction Equipment Sales & Marketing
We asked them to research ‘Equipment market’ all over the world, and their whole arrangement was helpful to us. thehealthanalytics.com insightful analysis and reports contributed to our current analysis and in creating a future strategy. Besides, the te


