

Base Year Value ()
x.x %
x.x %
CAGR ()
x.x %
x.x %
Forecast Year Value ()
x.x %
x.x %
Historical Data Period
Largest Region
Forecast Period
Mercato dei biocompositi per fibra (fibra di legno e fibra non di legno), tipo di polimero (sintetico e naturale), utente finale (edilizia e costruzioni, automotive, beni di consumo) e per regione (Nord America, America Latina, Europa, Asia Pacifico e Medio Oriente e Africa), tendenze globali e previsioni dal 2022 al 2029
Instant access to hundreds of data points and trends
- Market estimates from 2014-2029
- Competitive analysis, industry segmentation, financial benchmarks
- Incorporates SWOT, Porter's Five Forces and risk management frameworks
- PDF report or online database with Word, Excel and PowerPoint export options
- 100% money back guarantee
Panoramica del mercato dei biocompositi
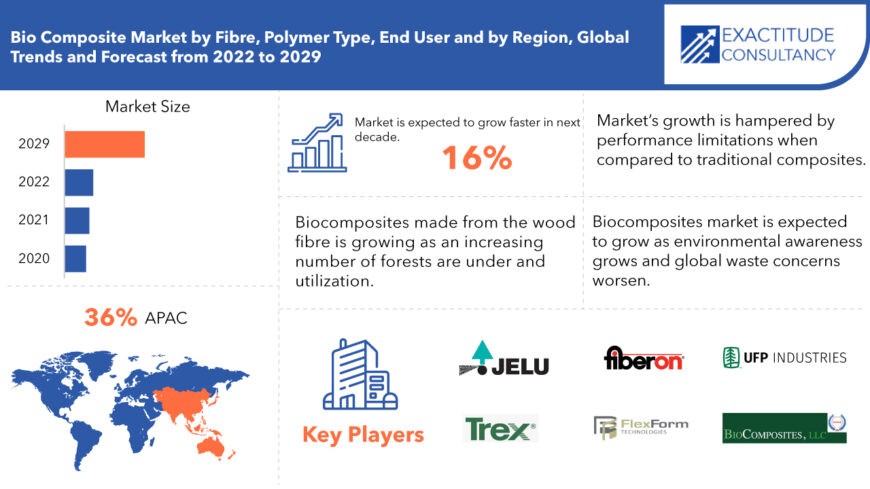
Le dimensioni del mercato dei biocompositi sono state stimate in 23,8 miliardi di USD nel 2020 e si prevede che raggiungeranno i 90,79 miliardi di USD entro il 2029, con una crescita a un CAGR del 16% dal 2022 al 2029.
Le nazioni sviluppate come Germania, Stati Uniti e Giappone stanno dando sempre più priorità all'adozione di alternative ecologiche rispetto ai prodotti a base di petrolio . Tra questi paesi, l'Unione Europea (UE) si distingue per il suo impegno particolarmente forte nell'utilizzare tali alternative rispetto ai governi degli Stati Uniti e del Giappone. L'UE sostiene l'uso di materiali di origine biologica, incoraggia la riciclabilità dei componenti dei veicoli e impone responsabilità ai produttori di automobili per lo smaltimento a fine vita. Al contrario, i requisiti normativi in Nord America, in particolare per i produttori di automobili, sono relativamente meno rigorosi rispetto a quelli di altri mercati globali. Ad esempio, il governo giapponese si è prefissato l'obiettivo di sostituire il 25% del consumo di plastica con prodotti rinnovabili entro il 2030. Secondo la Commissione UE, il settore automobilistico europeo consuma annualmente 80.000 tonnellate di fibre vegetali e di legno per rinforzare prodotti compositi al posto delle fibre sintetiche. Inoltre, l'UE sottolinea l'adozione di materiali riciclabili e biodegradabili per i componenti interni delle automobili, prevedendo un aumento nell'utilizzo di biocompositi nelle applicazioni di trasporto durante il periodo previsto. Si prevede che tali normative stimoleranno la domanda di biocompositi in vari settori, tra cui trasporti, edilizia ed elettronica.
| ATTRIBUTO | DETTAGLI |
| Periodo di studio | 2020-2029 |
| Anno base | 2021 |
| Anno stimato | 2022 |
| Anno previsto | 2022-2029 |
| Periodo storico | 2018-2020 |
| Unità | Valore (miliardi di USD) Volume (chilotoni) |
| Segmentazione | Per fibra, per tipo di polimero, per utente finale, per regione |
| Per fibra |
|
| Per tipo di polimero |
|
| Per utente finale |
|
| Per regione |
|
L'energia necessaria per produrre biocompositi è significativamente inferiore rispetto a quella richiesta per la produzione di compositi in fibra di vetro e di carbonio . Tuttavia, i biocompositi hanno un costo iniziale più elevato rispetto ai compositi in fibra di vetro. Tuttavia, esiste il potenziale per una riduzione dei prezzi grazie alle economie di scala e alle aree di applicazione più ampie. I paesi in via di sviluppo come India e Cina, benedetti da abbondanti materie prime come lino, iuta, kenaf e canapa , potrebbero produrre biocompositi a costi inferiori, contribuendo così all'accessibilità complessiva dei biocompositi a base di fibre naturali. Inoltre, con il progresso tecnologico e l'aumento della scala di produzione, si prevede che il costo dei biocompositi diminuirà nel lungo termine.
[caption id="allegato_6543" align="aligncenter" width="870"]
Frequently Asked Questions
• What is the worth of global Bio-Composites s market?
The Bio-Composites s market size had crossed USD 23.8 billion in 2020 and will observe a CAGR of more than 16% up to USD 90.79 billion in 2029 driven by the growing awareness of the need to prevent global warming, environmental harm, and pollution, scientists are focusing their efforts on inventing ecologically friendly and biodegradable materials.
• What is the size of the Asia pacific Bio-Composites s industry?
Asia Pacific held more than 36% of the Bio-Composites s market revenue share in 2021 and will witness market expansion owing to the encouraging eco-friendly material start-ups attract more foreign direct investment (FDI) from western countries in this region.
• What are the upcoming trends of Bio-Composites s market, globally?
Scientists are concentrating their efforts on developing environmentally friendly and biodegradable materials in response to a growing awareness of the need to reduce global warming, environmental destruction, and pollution.
• Which are the top companies to hold the market share in Bio-Composites s market?
Alpas SRL, Jelu-Werk Josef Ehrler GmbH, MCG Bio-Composites s, UFP Industries (previously Universal Forest Products), Trex Company, Meshlin Composites, UPM, Tecnaro, Fiberon (Fortune Brands Home), and FlexForm Technologies are among the major companies dominating the market.
Bio-Composites Market Segment Analysis
The market is broadly classified into fibre type, polymer type, end user and region. A prominent trend driving the worldwide Bio-Composites s market share is the increasing use of natural fibres as a biodegradable reinforcing material and a substitute for carbon fibres, glass fibres, and inorganic fillers. Natural fiber-based Bio-Composites s will continue to gain popularity in automotive, aerospace, and other industrial applications because to its non-corrosive nature, high specific strength, and low costs, among other benefits. Wood fibres are taken from trees with enough vascular bundles to impart a hard property; as a result, these fibres are well known for their rigidity and are used in a variety of applications. The viscose technique can extract cellulose from wood for use in other applications. Wood is made up of 50% cellulose. Over a century ago, the viscose technique was developed and introduced to the globe to extract cellulose for the production of fine wood fibres.
On the basis of end user, the global Bio-Composites s market has been segmented into building & construction, automotive, consumer goods, others. Automotive held the biggest market share over the forecast period. Automobiles, which include cars, buses, trains, aircraft, and ships, are the most common mode of transport. Bio-composites are characterised by strength, stiffness, toughness, and longevity, and have a wide range of uses in the transportation and vehicle industries. Bio-composites can be utilised to make a variety of automobile components, including tyres, belts, and hoses. Other sections of autos, such as interior and exterior body panels of automobile bodywork, are made with these components. Despite their stiffness and strength, bio-composites are lighter than other materials utilised in automotive design and development.
[caption id="attachment_6530" align="alignleft" width="680"]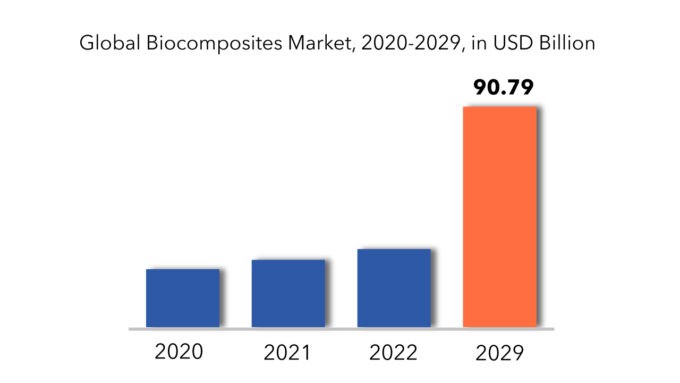
Bio-Composites Market Players
Alpas SRL, Jelu-Werk Josef Ehrler GmbH, MCG Bio-Composites s, UFP Industries (previously Universal Forest Products), Trex Company, Meshlin Composites, UPM, Tecnaro, Fiberon (Fortune Brands Home), and FlexForm Technologies are among the major companies in the Bio-Composites s market. Innovative product releases, collaborations, and acquisitions are just a few of the important measures these companies are pursuing to improve their worldwide market position.
- ALPAS specializes in customized Resins, Adhesives, Sealants and Composites.
- JELU-WERK is a manufacturer of cellulose and plant fibres. The company delivers its products to locations all over the world and supplies all types of industries: food, animal breeding and technical industry.
- MCG Bio-Composites s, LLC, provides innovative Bio-Composites solutions for a wide range of agricultural, lawn and garden and industrial applications.
Who Should Buy? Or Key Stakeholders
- Construction Industry
- Chemical Industry
- Fibre Industry
- Scientific Research and Development
- Investors
- Manufacturing companies
- End user companies
- Others
Key Takeaways:
- Bio-Composites market size is projected to reach growing at a CAGR of 16%.
- Based on polymer type, the market is dominated by natural
- Based on fiber, the market is dominated by wooden fiber.
- On the basis of end user, automotive held the biggest market share over the forecast period.
- Asia Pacific has the largest market share and is expected to grow at the fastest rate over the forecast period.
- The growing demand for sustainable materials is driving the bio-composites market towards significant expansion.
Bio-Composites Market Regional Analysis
The global Bio-Composites market by region includes North America, Asia-Pacific (APAC), Europe, South America, and Middle East & Africa (MEA).
- North America: includes the US, Canada, Mexico
- Asia Pacific: includes China, Japan, South Korea, India, Australia, ASEAN and Rest of APAC
- Europe: includes UK, Germany, France, Italy, Spain, Russia, and Rest of Europe
- South America: includes Brazil, Argentina and Rest of South America
- Middle East & Africa: includes Turkey, UAE, Saudi Arabia, South Africa, and Rest of MEA
Asia Pacific has the largest market share and is expected to grow at the fastest rate over the forecast period. The leading Bio-Composites s material manufacturers are relocating their operations to the Asia Pacific region. Furthermore, government policies in Asia Pacific countries encouraging eco-friendly material start-ups attract more foreign direct investment (FDI) from western countries. The increasing demand from the building and construction and transportation end-use sectors is a key element contributing to its rise.
[caption id="attachment_6531" align="alignleft" width="680"]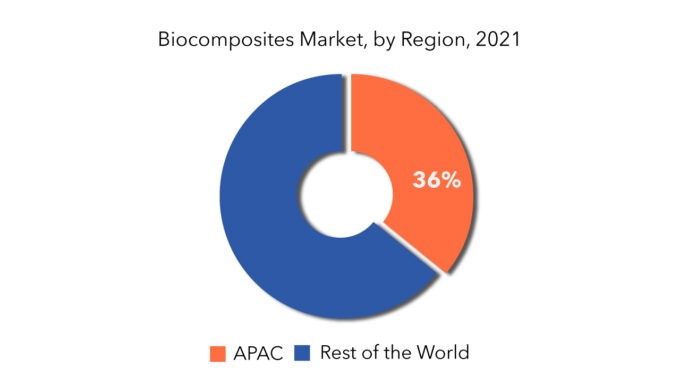
Key Market Segments: Bio-Composites Market
Bio-Composites Market by Fibre, 2020-2029, (USD Million) (Kilotons)- Wooden Fiber
- Non-Wood Fiber
- Synthetic
- Natural
- Building & Construction
- Automotive
- Consumer Goods
- North America
- Europe
- Asia Pacific
- South America
- Middle East And Africa
Key Question Answered
- What are the growth opportunities related to the adoption of Bio-Composites across major regions in the future?
- What are the new trends and advancements in the Bio-Composites market?
- Which product categories are expected to have highest growth rate in the Bio-Composites market?
- Which are the key factors driving the Bio-Composites market?
- What will the market growth rate, growth momentum or acceleration the market carries during the forecast period?
- Introduzione
- Definizione di mercato
- Segmentazione del mercato
- Cronologie della ricerca
- Presupposti e limitazioni
- Metodologia di ricerca
- Estrazione dei dati
- Ricerca secondaria
- Ricerca primaria
- Consigli degli esperti in materia
- Controlli di qualità
- Revisione finale
- Triangolazione dei dati
- Approccio dal basso verso l'alto
- Approccio dall'alto verso il basso
- Flusso di ricerca
- Fonti dei dati
- Estrazione dei dati
- Sintesi
- Panoramica del mercato
- Prospettive del mercato globale dei biocompositi
- Fattori trainanti del mercato
- Limitazioni di mercato
- Opportunità di mercato
- Impatto del Covid-19 sul mercato dei biocompositi
- Modello delle cinque forze di Porter
- Minaccia da parte dei nuovi entranti
- Minaccia da sostituti
- Potere contrattuale dei fornitori
- Potere contrattuale dei clienti
- Grado di concorrenza
- Analisi della catena del valore del settore
- Prospettive del mercato globale dei biocompositi
- Mercato globale dei biocompositi per fibra (milioni di USD) (chilotoni)
- Fibra di legno
- Fibra non legnosa
- Mercato globale dei biocompositi per tipo di polimero (milioni di USD) (kilotoni)
- Sintetico
- Naturale
- Mercato globale dei biocompositi per utente finale (milioni di USD) (chilotoni)
- Edilizia e costruzioni
- Automobilistico
- Beni di consumo
- Mercato globale dei biocompositi per regione (milioni di USD) (chilotoni)
- America del Nord
- NOI
- Canada
- Messico
- Sud America
- Brasile
- Argentina
- Colombia
- Resto del Sud America
- Europa
- Germania
- Regno Unito
- Francia
- Italia
- Spagna
- Russia
- Resto d'Europa
- Asia Pacifico
- India
- Cina
- Giappone
- Corea del Sud
- Australia
- Asia sud-orientale
- Resto dell'Asia Pacifica
- Medio Oriente e Africa
- Emirati Arabi Uniti
- Arabia Saudita
- Sudafrica
- Resto del Medio Oriente e Africa
- America del Nord
- Profili aziendali* (panoramica aziendale, istantanea aziendale, prodotti offerti, sviluppi recenti)
- Alpas SRL
- Azienda Jelu-Werk Josef Ehrler GmbH
- MCG Biocompositi
- Industrie UFP
- Azienda Trex
- Compositi Meshlin
- UPM
- Tecnaro
- Fibra
- Tecnologie FlexForm
- Altri *L'elenco delle aziende è indicativo
ELENCO DELLE TABELLE
TABLE 1 GLOBAL BIOCOMPOSITE MARKET BY FIBRE (USD MILLIONS) 2020-2029
TABLE 2 GLOBAL BIOCOMPOSITE MARKET BY FIBRE (KILOTONS) 2020-2029
TABLE 3 GLOBAL BIOCOMPOSITE MARKET BY POLYMER TYPE (USD MILLIONS) 2020-2029
TABLE 4 GLOBAL BIOCOMPOSITE MARKET BY POLYMER TYPE (KILOTONS) 2020-2029
TABLE 5 GLOBAL BIOCOMPOSITE MARKET BY END USER (USD MILLIONS) 2020-2029
TABLE 6 GLOBAL BIOCOMPOSITE MARKET BY END USER (KILOTONS) 2020-2029
TABLE 7 GLOBAL BIOCOMPOSITE MARKET BY REGION (USD MILLIONS) 2020-2029
TABLE 8 GLOBAL BIOCOMPOSITE MARKET BY REGION (KILOTONS) 2020-2029
TABLE 9 US BIOCOMPOSITE MARKET BY FIBRE (USD MILLIONS) 2020-2029
TABLE 10 US BIOCOMPOSITE MARKET BY FIBRE (KILOTONS) 2020-2029
TABLE 11 US BIOCOMPOSITE MARKET BY POLYMER TYPE (USD MILLIONS) 2020-2029
TABLE 12 US BIOCOMPOSITE MARKET BY POLYMER TYPE (KILOTONS) 2020-2029
TABLE 13 US BIOCOMPOSITE MARKET BY END USER (USD MILLIONS) 2020-2029
TABLE 14 US BIOCOMPOSITE MARKET BY END USER (KILOTONS) 2020-2029
TABLE 15 CANADA BIOCOMPOSITE MARKET BY FIBRE (USD MILLIONS) 2020-2029
TABLE 16 CANADA BIOCOMPOSITE MARKET BY FIBRE (KILOTONS) 2020-2029
TABLE 17 CANADA BIOCOMPOSITE MARKET BY POLYMER TYPE (USD MILLIONS) 2020-2029
TABLE 18 CANADA BIOCOMPOSITE MARKET BY POLYMER TYPE (KILOTONS) 2020-2029
TABLE 19 CANADA BIOCOMPOSITE MARKET BY END USER (USD MILLIONS) 2020-2029
TABLE 20 CANADA BIOCOMPOSITE MARKET BY END USER (KILOTONS) 2020-2029
TABLE 21 MEXICO BIOCOMPOSITE MARKET BY FIBRE (USD MILLIONS) 2020-2029
TABLE 22 MEXICO BIOCOMPOSITE MARKET BY FIBRE (KILOTONS) 2020-2029
TABLE 23 MEXICO BIOCOMPOSITE MARKET BY POLYMER TYPE (USD MILLIONS) 2020-2029
TABLE 24 MEXICO BIOCOMPOSITE MARKET BY POLYMER TYPE (KILOTONS) 2020-2029
TABLE 25 MEXICO BIOCOMPOSITE MARKET BY END USER (USD MILLIONS) 2020-2029
TABLE 26 MEXICO BIOCOMPOSITE MARKET BY END USER (KILOTONS) 2020-2029
TABLE 27 BRAZIL BIOCOMPOSITE MARKET BY FIBRE (USD MILLIONS) 2020-2029
TABLE 28 BRAZIL BIOCOMPOSITE MARKET BY FIBRE (KILOTONS) 2020-2029
TABLE 29 BRAZIL BIOCOMPOSITE MARKET BY POLYMER TYPE (USD MILLIONS) 2020-2029
TABLE 30 BRAZIL BIOCOMPOSITE MARKET BY POLYMER TYPE (KILOTONS) 2020-2029
TABLE 31 BRAZIL BIOCOMPOSITE MARKET BY END USER (USD MILLIONS) 2020-2029
TABLE 32 BRAZIL BIOCOMPOSITE MARKET BY END USER (KILOTONS) 2020-2029
TABLE 33 ARGENTINA BIOCOMPOSITE MARKET BY FIBRE (USD MILLIONS) 2020-2029
TABLE 34 ARGENTINA BIOCOMPOSITE MARKET BY FIBRE (KILOTONS) 2020-2029
TABLE 35 ARGENTINA BIOCOMPOSITE MARKET BY POLYMER TYPE (USD MILLIONS) 2020-2029
TABLE 36 ARGENTINA BIOCOMPOSITE MARKET BY POLYMER TYPE (KILOTONS) 2020-2029
TABLE 37 ARGENTINA BIOCOMPOSITE MARKET BY END USER (USD MILLIONS) 2020-2029
TABLE 38 ARGENTINA BIOCOMPOSITE MARKET BY END USER (KILOTONS) 2020-2029
TABLE 39 COLOMBIA BIOCOMPOSITE MARKET BY FIBRE (USD MILLIONS) 2020-2029
TABLE 40 COLOMBIA BIOCOMPOSITE MARKET BY FIBRE (KILOTONS) 2020-2029
TABLE 41 COLOMBIA BIOCOMPOSITE MARKET BY POLYMER TYPE (USD MILLIONS) 2020-2029
TABLE 42 COLOMBIA BIOCOMPOSITE MARKET BY POLYMER TYPE (KILOTONS) 2020-2029
TABLE 43 COLOMBIA BIOCOMPOSITE MARKET BY END USER (USD MILLIONS) 2020-2029
TABLE 44 COLOMBIA BIOCOMPOSITE MARKET BY END USER (KILOTONS) 2020-2029
TABLE 45 REST OF SOUTH AMERICA BIOCOMPOSITE MARKET BY FIBRE (USD MILLIONS) 2020-2029
TABLE 46 REST OF SOUTH AMERICA BIOCOMPOSITE MARKET BY FIBRE (KILOTONS) 2020-2029
TABLE 47 REST OF SOUTH AMERICA BIOCOMPOSITE MARKET BY POLYMER TYPE (USD MILLIONS) 2020-2029
TABLE 48 REST OF SOUTH AMERICA BIOCOMPOSITE MARKET BY POLYMER TYPE (KILOTONS) 2020-2029
TABLE 49 REST OF SOUTH AMERICA BIOCOMPOSITE MARKET BY END USER (USD MILLIONS) 2020-2029
TABLE 50 REST OF SOUTH AMERICA BIOCOMPOSITE MARKET BY END USER (KILOTONS) 2020-2029
TABLE 51 INDIA BIOCOMPOSITE MARKET BY FIBRE (USD MILLIONS) 2020-2029
TABLE 52 INDIA BIOCOMPOSITE MARKET BY FIBRE (KILOTONS) 2020-2029
TABLE 53 INDIA BIOCOMPOSITE MARKET BY POLYMER TYPE (USD MILLIONS) 2020-2029
TABLE 54 INDIA BIOCOMPOSITE MARKET BY POLYMER TYPE (KILOTONS) 2020-2029
TABLE 55 INDIA BIOCOMPOSITE MARKET BY END USER (USD MILLIONS) 2020-2029
TABLE 56 INDIA BIOCOMPOSITE MARKET BY END USER (KILOTONS) 2020-2029
TABLE 57 CHINA BIOCOMPOSITE MARKET BY FIBRE (USD MILLIONS) 2020-2029
TABLE 58 CHINA BIOCOMPOSITE MARKET BY FIBRE (KILOTONS) 2020-2029
TABLE 59 CHINA BIOCOMPOSITE MARKET BY POLYMER TYPE (USD MILLIONS) 2020-2029
TABLE 60 CHINA BIOCOMPOSITE MARKET BY POLYMER TYPE (KILOTONS) 2020-2029
TABLE 61 CHINA BIOCOMPOSITE MARKET BY END USER (USD MILLIONS) 2020-2029
TABLE 62 CHINA BIOCOMPOSITE MARKET BY END USER (KILOTONS) 2020-2029
TABLE 63 JAPAN BIOCOMPOSITE MARKET BY FIBRE (USD MILLIONS) 2020-2029
TABLE 64 JAPAN BIOCOMPOSITE MARKET BY FIBRE (KILOTONS) 2020-2029
TABLE 65 JAPAN BIOCOMPOSITE MARKET BY POLYMER TYPE (USD MILLIONS) 2020-2029
TABLE 66 JAPAN BIOCOMPOSITE MARKET BY POLYMER TYPE (KILOTONS) 2020-2029
TABLE 67 JAPAN BIOCOMPOSITE MARKET BY END USER (USD MILLIONS) 2020-2029
TABLE 68 JAPAN BIOCOMPOSITE MARKET BY END USER (KILOTONS) 2020-2029
TABLE 69 SOUTH KOREA BIOCOMPOSITE MARKET BY FIBRE (USD MILLIONS) 2020-2029
TABLE 70 SOUTH KOREA BIOCOMPOSITE MARKET BY FIBRE (KILOTONS) 2020-2029
TABLE 71 SOUTH KOREA BIOCOMPOSITE MARKET BY POLYMER TYPE (USD MILLIONS) 2020-2029
TABLE 72 SOUTH KOREA BIOCOMPOSITE MARKET BY POLYMER TYPE (KILOTONS) 2020-2029
TABLE 73 SOUTH KOREA BIOCOMPOSITE MARKET BY END USER (USD MILLIONS) 2020-2029
TABLE 74 SOUTH KOREA BIOCOMPOSITE MARKET BY END USER (KILOTONS) 2020-2029
TABLE 75 AUSTRALIA BIOCOMPOSITE MARKET BY FIBRE (USD MILLIONS) 2020-2029
TABLE 76 AUSTRALIA BIOCOMPOSITE MARKET BY FIBRE (KILOTONS) 2020-2029
TABLE 77 AUSTRALIA BIOCOMPOSITE MARKET BY POLYMER TYPE (USD MILLIONS) 2020-2029
TABLE 78 AUSTRALIA BIOCOMPOSITE MARKET BY POLYMER TYPE (KILOTONS) 2020-2029
TABLE 79 AUSTRALIA BIOCOMPOSITE MARKET BY END USER (USD MILLIONS) 2020-2029
TABLE 80 AUSTRALIA BIOCOMPOSITE MARKET BY END USER (KILOTONS) 2020-2029
TABLE 81 SOUTH-EAST ASIA BIOCOMPOSITE MARKET BY FIBRE (USD MILLIONS) 2020-2029
TABLE 82 SOUTH-EAST ASIA BIOCOMPOSITE MARKET BY FIBRE (KILOTONS) 2020-2029
TABLE 83 SOUTH-EAST ASIA BIOCOMPOSITE MARKET BY POLYMER TYPE (USD MILLIONS) 2020-2029
TABLE 84 SOUTH-EAST ASIA BIOCOMPOSITE MARKET BY POLYMER TYPE (KILOTONS) 2020-2029
TABLE 85 SOUTH-EAST ASIA BIOCOMPOSITE MARKET BY END USER (USD MILLIONS) 2020-2029
TABLE 86 SOUTH-EAST ASIA BIOCOMPOSITE MARKET BY END USER (KILOTONS) 2020-2029
TABLE 87 REST OF ASIA PACIFIC BIOCOMPOSITE MARKET BY FIBRE (USD MILLIONS) 2020-2029
TABLE 88 REST OF ASIA PACIFIC BIOCOMPOSITE MARKET BY FIBRE (KILOTONS) 2020-2029
TABLE 89 REST OF ASIA PACIFIC BIOCOMPOSITE MARKET BY POLYMER TYPE (USD MILLIONS) 2020-2029
TABLE 90 REST OF ASIA PACIFIC BIOCOMPOSITE MARKET BY POLYMER TYPE (KILOTONS) 2020-2029
TABLE 91 REST OF ASIA PACIFIC BIOCOMPOSITE MARKET BY END USER (USD MILLIONS) 2020-2029
TABLE 92 REST OF ASIA PACIFIC BIOCOMPOSITE MARKET BY END USER (KILOTONS) 2020-2029
TABLE 93 GERMANY BIOCOMPOSITE MARKET BY FIBRE (USD MILLIONS) 2020-2029
TABLE 94 GERMANY BIOCOMPOSITE MARKET BY FIBRE (KILOTONS) 2020-2029
TABLE 95 GERMANY BIOCOMPOSITE MARKET BY POLYMER TYPE (USD MILLIONS) 2020-2029
TABLE 96 GERMANY BIOCOMPOSITE MARKET BY POLYMER TYPE (KILOTONS) 2020-2029
TABLE 97 GERMANY BIOCOMPOSITE MARKET BY END USER (USD MILLIONS) 2020-2029
TABLE 98 GERMANY BIOCOMPOSITE MARKET BY END USER (KILOTONS) 2020-2029
TABLE 99 UK BIOCOMPOSITE MARKET BY FIBRE (USD MILLIONS) 2020-2029
TABLE 100 UK BIOCOMPOSITE MARKET BY FIBRE (KILOTONS) 2020-2029
TABLE 101 UK BIOCOMPOSITE MARKET BY POLYMER TYPE (USD MILLIONS) 2020-2029
TABLE 102 UK BIOCOMPOSITE MARKET BY POLYMER TYPE (KILOTONS) 2020-2029
TABLE 103 UK BIOCOMPOSITE MARKET BY END USER (USD MILLIONS) 2020-2029
TABLE 104 UK BIOCOMPOSITE MARKET BY END USER (KILOTONS) 2020-2029
TABLE 105 FRANCE BIOCOMPOSITE MARKET BY FIBRE (USD MILLIONS) 2020-2029
TABLE 106 FRANCE BIOCOMPOSITE MARKET BY FIBRE (KILOTONS) 2020-2029
TABLE 107 FRANCE BIOCOMPOSITE MARKET BY POLYMER TYPE (USD MILLIONS) 2020-2029
TABLE 108 FRANCE BIOCOMPOSITE MARKET BY POLYMER TYPE (KILOTONS) 2020-2029
TABLE 109 FRANCE BIOCOMPOSITE MARKET BY END USER (USD MILLIONS) 2020-2029
TABLE 110 FRANCE BIOCOMPOSITE MARKET BY END USER (KILOTONS) 2020-2029
TABLE 111 ITALY BIOCOMPOSITE MARKET BY FIBRE (USD MILLIONS) 2020-2029
TABLE 112 ITALY BIOCOMPOSITE MARKET BY FIBRE (KILOTONS) 2020-2029
TABLE 113 ITALY BIOCOMPOSITE MARKET BY POLYMER TYPE (USD MILLIONS) 2020-2029
TABLE 114 ITALY BIOCOMPOSITE MARKET BY POLYMER TYPE (KILOTONS) 2020-2029
TABLE 115 ITALY BIOCOMPOSITE MARKET BY END USER (USD MILLIONS) 2020-2029
TABLE 116 ITALY BIOCOMPOSITE MARKET BY END USER (KILOTONS) 2020-2029
TABLE 117 SPAIN BIOCOMPOSITE MARKET BY FIBRE (USD MILLIONS) 2020-2029
TABLE 118 SPAIN BIOCOMPOSITE MARKET BY FIBRE (KILOTONS) 2020-2029
TABLE 119 SPAIN BIOCOMPOSITE MARKET BY POLYMER TYPE (USD MILLIONS) 2020-2029
TABLE 120 SPAIN BIOCOMPOSITE MARKET BY POLYMER TYPE (KILOTONS) 2020-2029
TABLE 121 SPAIN BIOCOMPOSITE MARKET BY END USER (USD MILLIONS) 2020-2029
TABLE 122 SPAIN BIOCOMPOSITE MARKET BY END USER (KILOTONS) 2020-2029
TABLE 123 RUSSIA BIOCOMPOSITE MARKET BY FIBRE (USD MILLIONS) 2020-2029
TABLE 124 RUSSIA BIOCOMPOSITE MARKET BY FIBRE (KILOTONS) 2020-2029
TABLE 125 RUSSIA BIOCOMPOSITE MARKET BY POLYMER TYPE (USD MILLIONS) 2020-2029
TABLE 126 RUSSIA BIOCOMPOSITE MARKET BY POLYMER TYPE (KILOTONS) 2020-2029
TABLE 127 RUSSIA BIOCOMPOSITE MARKET BY END USER (USD MILLIONS) 2020-2029
TABLE 128 RUSSIA BIOCOMPOSITE MARKET BY END USER (KILOTONS) 2020-2029
TABLE 129 REST OF EUROPE BIOCOMPOSITE MARKET BY FIBRE (USD MILLIONS) 2020-2029
TABLE 130 REST OF EUROPE BIOCOMPOSITE MARKET BY FIBRE (KILOTONS) 2020-2029
TABLE 131 REST OF EUROPE BIOCOMPOSITE MARKET BY POLYMER TYPE (USD MILLIONS) 2020-2029
TABLE 132 REST OF EUROPE BIOCOMPOSITE MARKET BY POLYMER TYPE (KILOTONS) 2020-2029
TABLE 133 REST OF EUROPE BIOCOMPOSITE MARKET BY END USER (USD MILLIONS) 2020-2029
TABLE 134 REST OF EUROPE BIOCOMPOSITE MARKET BY END USER (KILOTONS) 2020-2029
TABLE 135 UAE BIOCOMPOSITE MARKET BY FIBRE (USD MILLIONS) 2020-2029
TABLE 136 UAE BIOCOMPOSITE MARKET BY FIBRE (KILOTONS) 2020-2029
TABLE 137 UAE BIOCOMPOSITE MARKET BY POLYMER TYPE (USD MILLIONS) 2020-2029
TABLE 138 UAE BIOCOMPOSITE MARKET BY POLYMER TYPE (KILOTONS) 2020-2029
TABLE 139 UAE BIOCOMPOSITE MARKET BY END USER (USD MILLIONS) 2020-2029
TABLE 140 UAE BIOCOMPOSITE MARKET BY END USER (KILOTONS) 2020-2029
TABLE 141 SAUDI ARABIA BIOCOMPOSITE MARKET BY FIBRE (USD MILLIONS) 2020-2029
TABLE 142 SAUDI ARABIA BIOCOMPOSITE MARKET BY FIBRE (KILOTONS) 2020-2029
TABLE 143 SAUDI ARABIA BIOCOMPOSITE MARKET BY POLYMER TYPE (USD MILLIONS) 2020-2029
TABLE 144 SAUDI ARABIA BIOCOMPOSITE MARKET BY POLYMER TYPE (KILOTONS) 2020-2029
TABLE 145 SAUDI ARABIA BIOCOMPOSITE MARKET BY END USER (USD MILLIONS) 2020-2029
TABLE 146 SAUDI ARABIA BIOCOMPOSITE MARKET BY END USER (KILOTONS) 2020-2029
TABLE 147 SOUTH AFRICA BIOCOMPOSITE MARKET BY FIBRE (USD MILLIONS) 2020-2029
TABLE 148 SOUTH AFRICA BIOCOMPOSITE MARKET BY FIBRE (KILOTONS) 2020-2029
TABLE 149 SOUTH AFRICA BIOCOMPOSITE MARKET BY POLYMER TYPE (USD MILLIONS) 2020-2029
TABLE 150 SOUTH AFRICA BIOCOMPOSITE MARKET BY POLYMER TYPE (KILOTONS) 2020-2029
TABLE 151 SOUTH AFRICA BIOCOMPOSITE MARKET BY END USER (USD MILLIONS) 2020-2029
TABLE 152 SOUTH AFRICA BIOCOMPOSITE MARKET BY END USER (KILOTONS) 2020-2029
TABLE 153 REST OF MIDDLE EAST AND AFRICA BIOCOMPOSITE MARKET BY FIBRE (USD MILLIONS) 2020-2029
TABLE 154 REST OF MIDDLE EAST AND AFRICA BIOCOMPOSITE MARKET BY FIBRE (KILOTONS) 2020-2029
TABLE 155 REST OF MIDDLE EAST AND AFRICA BIOCOMPOSITE MARKET BY POLYMER TYPE (USD MILLIONS) 2020-2029
TABLE 156 REST OF MIDDLE EAST AND AFRICA BIOCOMPOSITE MARKET BY POLYMER TYPE (KILOTONS) 2020-2029
TABLE 157 REST OF MIDDLE EAST AND AFRICA BIOCOMPOSITE MARKET BY END USER (USD MILLIONS) 2020-2029
TABLE 158 REST OF MIDDLE EAST AND AFRICA BIOCOMPOSITE MARKET BY END USER (KILOTONS) 2020-2029
LIST OF FIGURES
FIGURE 1 MARKET DYNAMICS
FIGURE 2 MARKET SEGMENTATION
FIGURE 3 REPORT TIMELINES: YEARS CONSIDERED
FIGURE 4 DATA TRIANGULATION
FIGURE 5 BOTTOM-UP APPROACH
FIGURE 6 TOP-DOWN APPROACH
FIGURE 7 RESEARCH FLOW
FIGURE 8 GLOBAL BIOCOMPOSITE MARKET BY FIBRE, USD MILLION, 2020-2029
FIGURE 9 GLOBAL BIOCOMPOSITE MARKET BY POLYMER TYPE, USD MILLION, 2020-2029
FIGURE 10 GLOBAL BIOCOMPOSITE MARKET BY END USER, USD MILLION, 2020-2029
FIGURE 11 GLOBAL BIOCOMPOSITE MARKET BY REGION, USD MILLION, 2020-2029
FIGURE 12 PORTER’S FIVE FORCES MODEL
FIGURE 13 NORTH AMERICA BIOCOMPOSITE MARKET SNAPSHOT
FIGURE 14 EUROPE BIOCOMPOSITE MARKET SNAPSHOT
FIGURE 15 ASIA PACIFIC BIOCOMPOSITE MARKET SNAPSHOT
FIGURE 16 SOUTH AMERICA BIOCOMPOSITE MARKET SNAPSHOT
FIGURE 17 MIDDLE EAST & AFRICA BIOCOMPOSITE MARKET SNAPSHOT
FIGURE 18 ALPAS SRL: COMPANY SNAPSHOT
FIGURE 19 JELU-WERK JOSEF EHRLER GMBH: COMPANY SNAPSHOT
FIGURE 20 MCG BIOCOMPOSITES: COMPANY SNAPSHOT
FIGURE 21 UFP INDUSTRIES: COMPANY SNAPSHOT
FIGURE 22 TREX COMPANY: COMPANY SNAPSHOT
FIGURE 23 MESHLIN COMPOSITES: COMPANY SNAPSHOT
FIGURE 24 UPM: COMPANY SNAPSHOT
FIGURE 25 TECNARO: COMPANY SNAPSHOT
FIGURE 26 FIBERON: COMPANY SNAPSHOT
FIGURE 27 FLEXFORM TECHNOLOGIES: COMPANY SNAPSHOT
DOWNLOAD FREE SAMPLE REPORT
License Type
SPEAK WITH OUR ANALYST
Want to know more about the report or any specific requirement?
WANT TO CUSTOMIZE THE REPORT?
Our Clients Speak
We asked them to research ‘ Equipment market’ all over the world, and their whole arrangement was helpful to us. thehealthanalytics.com insightful analysis and reports contributed to our current analysis and in creating a future strategy. Besides, the te
Yosuke Mitsui
Senior Associate Construction Equipment Sales & Marketing
We asked them to research ‘Equipment market’ all over the world, and their whole arrangement was helpful to us. thehealthanalytics.com insightful analysis and reports contributed to our current analysis and in creating a future strategy. Besides, the te


