

Base Year Value ()
x.x %
x.x %
CAGR ()
x.x %
x.x %
Forecast Year Value ()
x.x %
x.x %
Historical Data Period
Largest Region
Forecast Period
Atherectomy Devices Market by Product (Directional, Rotational, Laser, Orbital), by End User (Hospitals, Surgical Centers, Ambulatory Care Centers, Research Laboratories, Academic Institutes), by Application (Peripheral Vascular, Cardiovascular, Neurovascular) and Region, Global Trends and Forecast from 2022 to 2029.
Instant access to hundreds of data points and trends
- Market estimates from 2014-2029
- Competitive analysis, industry segmentation, financial benchmarks
- Incorporates SWOT, Porter's Five Forces and risk management frameworks
- PDF report or online database with Word, Excel and PowerPoint export options
- 100% money back guarantee
Atherectomy Devices Market Overview
The atherectomy devices market is expected to grow at 6.85% CAGR from 2022 to 2029. It is expected to reach above USD 1.89 Billion by 2029 from USD 1.04 Billion in 2020.
Atherectomy devices are specialized medical instruments used in minimally invasive procedures to remove or modify atherosclerotic plaque from arteries. These devices, such as catheters with cutting mechanisms, are inserted into the affected artery to mechanically cut, shave, or vaporize the plaque. Their purpose is to restore blood flow and improve circulation in conditions like peripheral artery disease (PAD) and coronary artery disease (CAD).
The increasing prevalence of cardiovascular diseases, such as peripheral artery disease (PAD) and coronary artery disease (CAD), serves as a significant driver for the atherectomy devices market. Factors such as sedentary lifestyles, unhealthy dietary habits, and an aging population contribute to the growing number of patients requiring atherectomy procedures. The rise in cardiovascular diseases creates a higher demand for effective treatment options like atherectomy, which can remove plaque buildup and restore blood flow. The need to address the escalating burden of cardiovascular diseases worldwide fuels the adoption of atherectomy devices and drives market growth in this field.
[caption id="attachment_28964" align="aligncenter" width="1920"]
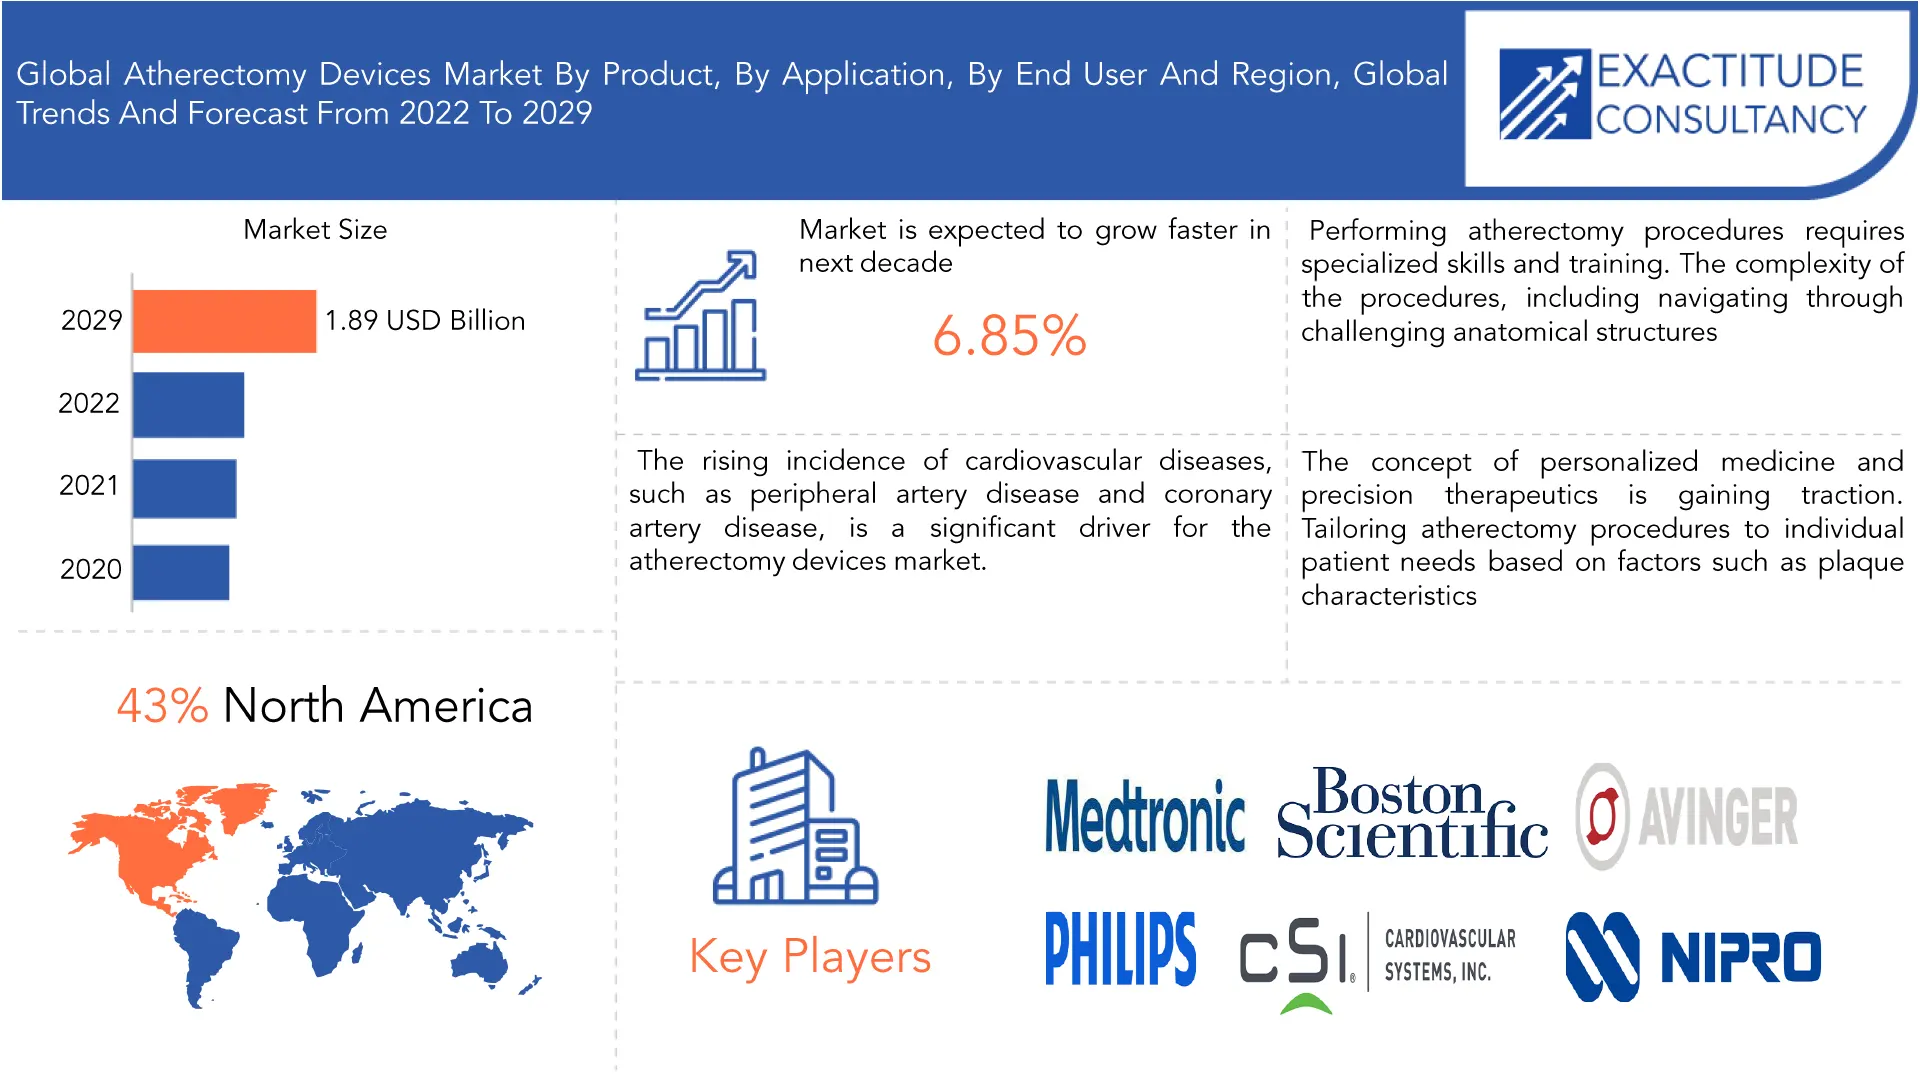
The procedural complexity and learning curve associated with atherectomy procedures act as a restraint in the market. Performing atherectomy procedures requires specialized skills and training due to the intricate nature of the procedures, including navigating complex anatomical structures and selecting appropriate devices and techniques. The learning curve for healthcare providers can be steep, potentially limiting the widespread adoption of atherectomy devices. The requirement for specialized expertise and training may create a barrier, especially in regions with limited access to training opportunities. Overcoming the procedural complexity and ensuring adequate training are crucial for broader acceptance and utilization of atherectomy devices.
The concept of personalized medicine and precision therapeutics presents an opportunity in the atherectomy devices market. Tailoring atherectomy procedures to individual patient needs based on factors like plaque characteristics, anatomy, and comorbidities can enhance treatment outcomes. Developing devices and techniques that enable personalized approaches to atherectomy opens new avenues for growth and differentiation. Advancements in imaging technologies, data analytics, and predictive modeling can assist in patient selection and treatment planning. Embracing personalized medicine allows for more precise and targeted interventions, improving patient outcomes and satisfaction. Manufacturers investing in this area can gain a competitive edge and drive market growth.
The COVID-19 pandemic had a positive impact on the atherectomy devices market in several ways. Firstly, the increased focus on minimizing hospital stays and reducing transmission risk had led to a greater demand for minimally invasive procedures like atherectomy, which performed in outpatient settings. Secondly, the pandemic had raised awareness about the importance of maintaining cardiovascular health, leading to increased proactive measures for prevention and treatment, including atherectomy procedures. Thirdly, the accelerated adoption of telehealth and digital health solutions had created opportunities for atherectomy device manufacturers to develop innovative remote guidance and training tools. Fourthly, healthcare system adaptations prioritized efficient and cost-effective procedures like atherectomy to manage cardiovascular diseases. Lastly, the pandemic had highlighted the need for continuous research and development in atherectomy devices, driving advancements and improved patient outcomes.
| ATTRIBUTE | DETAILS |
| Study period | 2020-2029 |
| Base year | 2021 |
| Estimated year | 2022 |
| Forecasted year | 2022-2029 |
| Historical period | 2018-2020 |
| Unit | Value (USD Billion), (Thousand Units). |
| Segmentation | By Product, By Application, By End User, By Region. |
| By Product |
|
| By End User |
|
| By Application |
|
| By Region |
|
Frequently Asked Questions
• What is the worth of atherectomy devices market?
The atherectomy devices market is expected to grow at 6.85% CAGR from 2022 to 2029. It is expected to reach above USD 1.89 Billion by 2029 from USD 1.04 Billion in 2020.
• What is the size of the North America atherectomy devices industry?
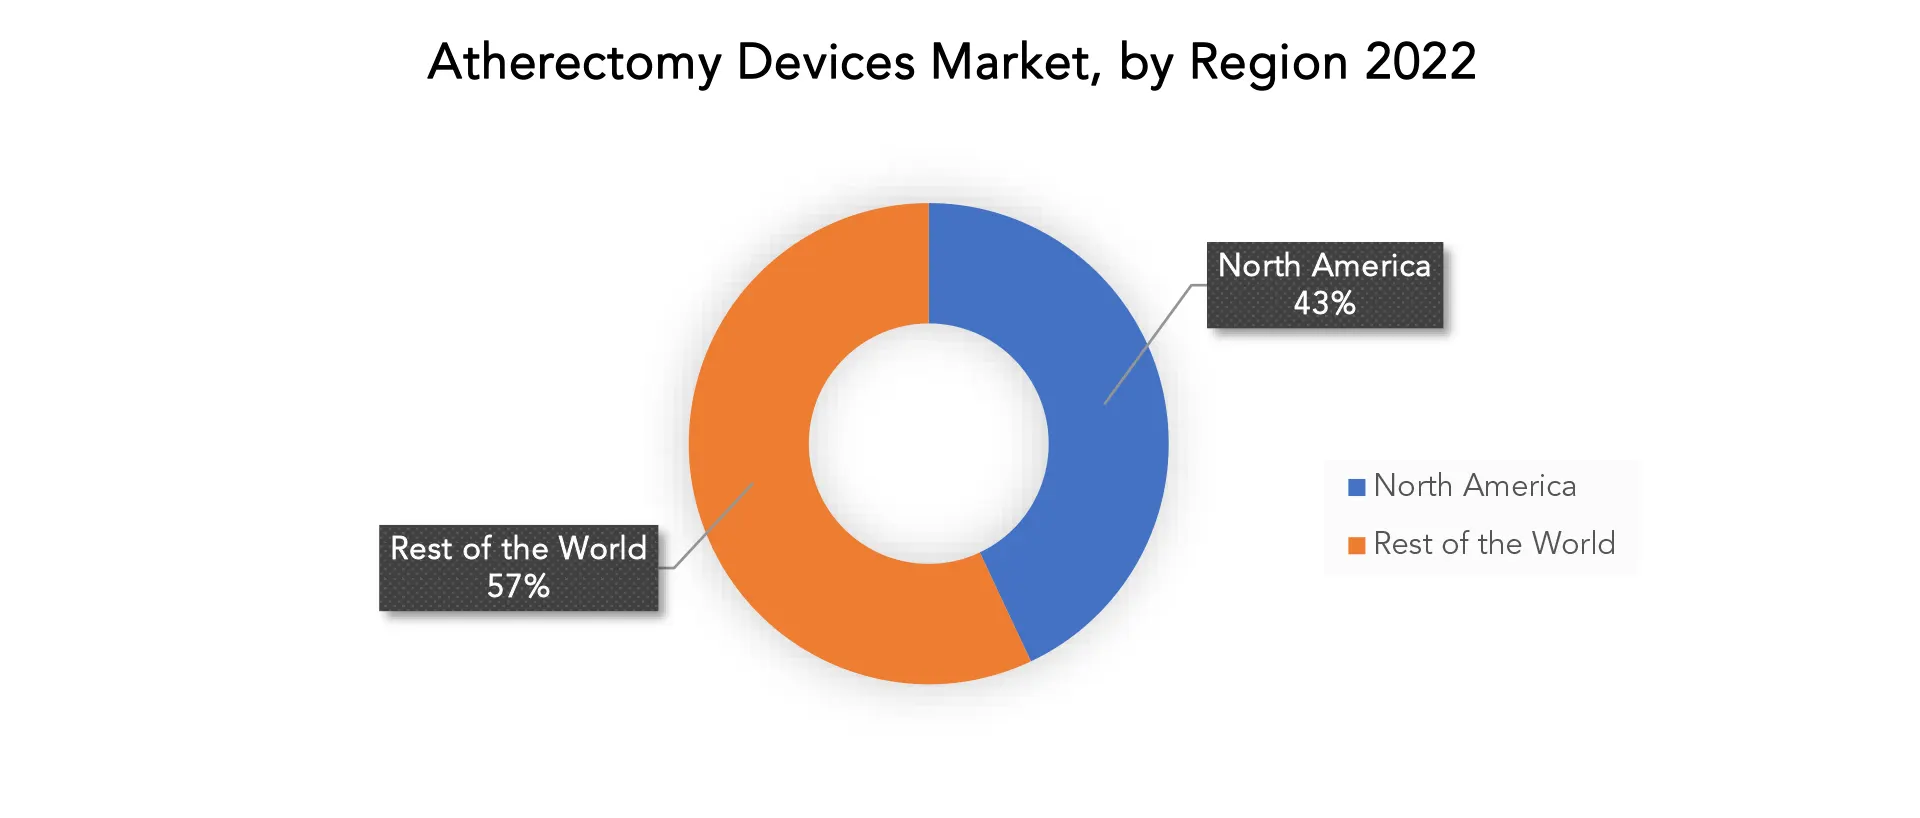
North America held more than 43% of the atherectomy devices market revenue share in 2021 and will witness expansion in the forecast period.
• What are some of the market's driving forces?
The rising incidence of cardiovascular diseases, such as peripheral artery disease (PAD) and coronary artery disease (CAD), is a significant driver for the atherectomy devices market. Factors like sedentary lifestyles, poor dietary habits, and an aging population contribute to the growing number of patients requiring atherectomy procedures.
• Which are the top companies to hold the market share in atherectomy devices market?
The atherectomy devices market key players includes Medtronic plc, Koninklijke Philips N.V., Boston Scientific Corporation, Cardiovascular Systems Inc., Becton Dickinson and Company, AngioDynamics Inc., Rex medical, Nipro Corporation, Invamed medical, Avinger Inc.
• What is the leading application of atherectomy devices market?
The healthcare is major sector where the application of atherectomy devices has seen more.
• Which is the largest regional market for atherectomy devices market?
The markets largest share is in the North America region.
Atherectomy Devices Market Segment Analysis
Rotational atherectomy devices have been the dominant segment in the atherectomy devices market Rotational atherectomy devices utilize a high-speed rotational burr to ablate and grind plaque. The burr spins rapidly, reducing plaque into tiny particles that can be easily flushed out through blood circulation. Rotational atherectomy is particularly useful for treating heavily calcified or fibrocalcific lesions. However, it requires careful operator skill and caution to prevent complications such as vessel perforation.
Hospitals are the dominant end user segment in the atherectomy devices market. Hospitals have the infrastructure, expertise, and patient flow to support atherectomy procedures. They provide a wide range of healthcare services, including specialized cardiovascular care, and attract a large number of patients with cardiovascular diseases. However, other segments such as surgical centers and ambulatory care centers are also gaining significance due to their convenience, cost-effectiveness, and ability to handle outpatient procedures efficiently. The role of research laboratories and academic institutes is primarily focused on innovation, education, and advancing the field of atherectomy devices through research and training.
Peripheral atherectomy is the dominant segment in the atherectomy devices market. Peripheral artery disease is highly prevalent, affecting millions of individuals worldwide. The growing awareness and increasing demand for effective treatment options for PAD contribute to the prominence of peripheral atherectomy devices. However, cardiovascular atherectomy also holds significant importance due to the high burden of coronary artery disease globally. Neurovascular atherectomy represents a niche application segment that addresses specific conditions related to the brain and central nervous system.
[caption id="attachment_28968" align="aligncenter" width="1920"]
Atherectomy Devices Market Player
The atherectomy devices market key players includes Medtronic plc, Koninklijke Philips N.V., Boston Scientific Corporation, Cardiovascular Systems, Inc., Becton Dickinson and Company, AngioDynamics Inc., Rex medical, Nipro Corporation, Invamed medical, Avinger Inc. August 2022: AngioDynamics, Inc. announced that the Auryon Atherectomy System has gained 510(k) clearance for an expanded indication that includes arterial thrombectomy. June 2020: BD (Becton, Dickinson and Company), announced that it has completed the acquisition of Straub Medical AG, a privately-held company that develops and sells medical atherectomy and thrombectomy devices that treat peripheral arterial disease (PAD) and venous disease. BD welcomes more than 80 new associates who add valuable experience and expertise as well as key technologies.Who Should Buy? Or Key Stakeholders
- Pharmaceutical Companies
- Hospital Organizations
- Market Research
- Research and Development Institutes
- Consulting Firms
- Venture capitalists
- Investors
- Supplier and Distributor
- Others
Atherectomy Devices Market Regional Analysis
The Atherectomy Devices market by region includes North America, Asia-Pacific (APAC), Europe, South America, and Middle East & Africa (MEA).- North America: includes the US, Canada, Mexico
- Asia Pacific: includes China, Japan, South Korea, India, Australia, ASEAN and Rest of APAC
- Europe: includes UK, Germany, France, Italy, Spain, Russia, and Rest of Europe
- South America: includes Brazil, Argentina and Rest of South America
- Middle East & Africa: includes Turkey, UAE, Saudi Arabia, South Africa, and Rest of MEA
Key Market Segments: Atherectomy Devices Market
Atherectomy Devices Market by Product, 2020-2029, (USD Billion), (Thousand Units).- Directional
- Rotational
- Laser
- Orbital
- Hospitals
- Surgical Centers
- Ambulatory Care Centers
- Research Laboratories
- Academic Institutes
- Peripheral Vascular
- Cardiovascular
- Neurovascular
- North America
- Asia Pacific
- Europe
- South America
- Middle East and Africa
Exactitude Consultancy Services Key Objectives:
- Increasing sales and market share
- Developing new technology
- Improving profitability
- Entering new markets
- Enhancing brand reputation
Key Question Answered
- What is the expected growth rate of the atherectomy devices market over the next 7 years?
- Who are the major players in the atherectomy devices market and what is their market share?
- What are the end-user industries driving demand for market and what is their outlook?
- What are the opportunities for growth in emerging markets such as Asia-pacific, middle east, and Africa?
- How is the economic environment affecting the atherectomy devices market, including factors such as interest rates, inflation, and exchange rates?
- What is the expected impact of government policies and regulations on the atherectomy devices market?
- What is the current and forecasted size and growth rate of the global atherectomy devices market?
- What are the key drivers of growth in the atherectomy devices market?
- What are the distribution channels and supply chain dynamics in the atherectomy devices market?
- What are the technological advancements and innovations in the atherectomy devices market and their impact on material development and growth?
- What are the regulatory considerations and their impact on the market?
- What are the challenges faced by players in the atherectomy devices market and how are they addressing these challenges?
- What are the opportunities for growth and expansion in the atherectomy devices market?
- What are the products offerings and specifications of leading players in the market?
- What is the pricing trend of atherectomy devices in the market and what is the impact of raw material prices on the price trend?
- INTRODUCTION
- MARKET DEFINITION
- MARKET SEGMENTATION
- RESEARCH TIMELINES
- ASSUMPTIONS AND LIMITATIONS
- RESEARCH METHODOLOGY
- DATA MINING
- SECONDARY RESEARCH
- PRIMARY RESEARCH
- SUBJECT-MATTER EXPERTS’ ADVICE
- QUALITY CHECKS
- FINAL REVIEW
- DATA TRIANGULATION
- BOTTOM-UP APPROACH
- TOP-DOWN APPROACH
- RESEARCH FLOW
- DATA SOURCES
- DATA MINING
- EXECUTIVE SUMMARY
- MARKET OVERVIEW
- GLOBAL ATHERECTOMY DEVICES MARKET OUTLOOK
- MARKET DRIVERS
- MARKET RESTRAINTS
- MARKET OPPORTUNITIES
- IMPACT OF COVID-19 ON ATHERECTOMY DEVICES MARKET
- PORTER’S FIVE FORCES MODEL
- THREAT FROM NEW ENTRANTS
- THREAT FROM SUBSTITUTES
- BARGAINING POWER OF SUPPLIERS
- BARGAINING POWER OF CUSTOMERS
- DEGREE OF COMPETITION
- INDUSTRY VALUE CHAIN ANALYSIS
- GLOBAL ATHERECTOMY DEVICES MARKET OUTLOOK
- GLOBAL ATHERECTOMY DEVICES MARKET BY PRODUCT, 2020-2029, (USD BILLION), (THOUSAND UNITS)
- DIRECTIONAL
- ROTATIONAL
- LASER
- ORBITAL
- GLOBAL ATHERECTOMY DEVICES MARKET BY END USER, 2020-2029, (USD BILLION), (THOUSAND UNITS)
- HOSPITALS
- SURGICAL CENTRES
- AMBULATORY CARE CENTRES
- RESEARCH LABORATORIES
- ACADEMIC INSTITUTES
- GLOBAL ATHERECTOMY DEVICES MARKET BY APPLICATION, 2020-2029, (USD BILLION), (THOUSAND UNITS)
- PERIPHERAL VASCULAR
- CARDIOVASCULAR
- NEUROVASCULAR
- GLOBAL ATHERECTOMY DEVICES MARKET BY REGION, 2020-2029, (USD BILLION), (THOUSAND UNITS)
- NORTH AMERICA
- US
- CANADA
- MEXICO
- SOUTH AMERICA
- BRAZIL
- ARGENTINA
- COLOMBIA
- REST OF SOUTH AMERICA
- EUROPE
- GERMANY
- UK
- FRANCE
- ITALY
- SPAIN
- RUSSIA
- REST OF EUROPE
- ASIA PACIFIC
- INDIA
- CHINA
- JAPAN
- SOUTH KOREA
- AUSTRALIA
- SOUTH-EAST ASIA
- REST OF ASIA PACIFIC
- MIDDLE EAST AND AFRICA
- UAE
- SAUDI ARABIA
- SOUTH AFRICA
- REST OF MIDDLE EAST AND AFRICA
- NORTH AMERICA
- COMPANY PROFILES*
(BUSINESS OVERVIEW, COMPANY SNAPSHOT, PRODUCTS OFFERED, RECENT DEVELOPMENTS)
- MEDTRONIC PLC
- KONINKLIJKE PHILIPS N.V.
- BOSTON SCIENTIFIC CORPORATION
- CARDIOVASCULAR SYSTEMS INC.
- BECTON DICKINSON AND COMPANY
- ANGIODYNAMICS INC.
- REX MEDICAL
- NIPRO CORPORATION
- INVAMED MEDICAL
- AVINGER INC. *THE COMPANY LIST IS INDICATIVE
LIST OF TABLES
TABLE 1 GLOBAL ATHERECTOMY DEVICES MARKET BY PRODUCT (USD BILLION) 2020-2029
TABLE 2 GLOBAL ATHERECTOMY DEVICES MARKET BY PRODUCT (THOUSAND UNITS) 2020-2029
TABLE 3 GLOBAL ATHERECTOMY DEVICES MARKET BY END USER (USD BILLION) 2020-2029
TABLE 4 GLOBAL ATHERECTOMY DEVICES MARKET BY END USER (THOUSAND UNITS) 2020-2029
TABLE 5 GLOBAL ATHERECTOMY DEVICES MARKET BY APPLICATION (USD BILLION) 2020-2029
TABLE 6 GLOBAL ATHERECTOMY DEVICES MARKET BY APPLICATION (THOUSAND UNITS) 2020-2029
TABLE 7 GLOBAL ATHERECTOMY DEVICES MARKET BY REGION (USD BILLION) 2020-2029
TABLE 8 GLOBAL ATHERECTOMY DEVICES MARKET BY REGION (THOUSAND UNITS) 2020-2029
TABLE 9 NORTH AMERICA ATHERECTOMY DEVICES MARKET BY COUNTRY (USD BILLION) 2020-2029
TABLE 10 NORTH AMERICA ATHERECTOMY DEVICES MARKET BY COUNTRY (THOUSAND UNITS) 2020-2029
TABLE 11 NORTH AMERICA ATHERECTOMY DEVICES MARKET BY PRODUCT (USD BILLION) 2020-2029
TABLE 12 NORTH AMERICA ATHERECTOMY DEVICES MARKET BY PRODUCT (THOUSAND UNITS) 2020-2029
TABLE 13 NORTH AMERICA ATHERECTOMY DEVICES MARKET BY END USER (USD BILLION) 2020-2029
TABLE 14 NORTH AMERICA ATHERECTOMY DEVICES MARKET BY END USER (THOUSAND UNITS) 2020-2029
TABLE 15 NORTH AMERICA ATHERECTOMY DEVICES MARKET BY APPLICATION (USD BILLION) 2020-2029
TABLE 16 NORTH AMERICA ATHERECTOMY DEVICES MARKET BY APPLICATION (THOUSAND UNITS) 2020-2029
TABLE 17 US ATHERECTOMY DEVICES MARKET BY PRODUCT (USD BILLION) 2020-2029
TABLE 18 US ATHERECTOMY DEVICES MARKET BY PRODUCT (THOUSAND UNITS) 2020-2029
TABLE 19 US ATHERECTOMY DEVICES MARKET BY END USER (USD BILLION) 2020-2029
TABLE 20 US ATHERECTOMY DEVICES MARKET BY END USER (THOUSAND UNITS) 2020-2029
TABLE 21 US ATHERECTOMY DEVICES MARKET BY APPLICATION (USD BILLION) 2020-2029
TABLE 22 US ATHERECTOMY DEVICES MARKET BY APPLICATION (THOUSAND UNITS) 2020-2029
TABLE 23 CANADA ATHERECTOMY DEVICES MARKET BY PRODUCT (USD BILLION) 2020-2029
TABLE 24 CANADA ATHERECTOMY DEVICES MARKET BY PRODUCT (THOUSAND UNITS) 2020-2029
TABLE 25 CANADA ATHERECTOMY DEVICES MARKET BY END USER (USD BILLION) 2020-2029
TABLE 26 CANADA ATHERECTOMY DEVICES MARKET BY END USER (THOUSAND UNITS) 2020-2029
TABLE 27 CANADA ATHERECTOMY DEVICES MARKET BY APPLICATION (USD BILLION) 2020-2029
TABLE 28 CANADA ATHERECTOMY DEVICES MARKET BY APPLICATION (THOUSAND UNITS) 2020-2029
TABLE 29 MEXICO ATHERECTOMY DEVICES MARKET BY PRODUCT (USD BILLION) 2020-2029
TABLE 30 MEXICO ATHERECTOMY DEVICES MARKET BY PRODUCT (THOUSAND UNITS) 2020-2029
TABLE 31 MEXICO ATHERECTOMY DEVICES MARKET BY END USER (USD BILLION) 2020-2029
TABLE 32 MEXICO ATHERECTOMY DEVICES MARKET BY END USER (THOUSAND UNITS) 2020-2029
TABLE 33 MEXICO ATHERECTOMY DEVICES MARKET BY APPLICATION (USD BILLION) 2020-2029
TABLE 34 MEXICO ATHERECTOMY DEVICES MARKET BY APPLICATION (THOUSAND UNITS) 2020-2029
TABLE 35 SOUTH AMERICA ATHERECTOMY DEVICES MARKET BY COUNTRY (USD BILLION) 2020-2029
TABLE 36 SOUTH AMERICA ATHERECTOMY DEVICES MARKET BY COUNTRY (THOUSAND UNITS) 2020-2029
TABLE 37 SOUTH AMERICA ATHERECTOMY DEVICES MARKET BY PRODUCT (USD BILLION) 2020-2029
TABLE 38 SOUTH AMERICA ATHERECTOMY DEVICES MARKET BY PRODUCT (THOUSAND UNITS) 2020-2029
TABLE 39 SOUTH AMERICA ATHERECTOMY DEVICES MARKET BY END USER (USD BILLION) 2020-2029
TABLE 40 SOUTH AMERICA ATHERECTOMY DEVICES MARKET BY END USER (THOUSAND UNITS) 2020-2029
TABLE 41 SOUTH AMERICA ATHERECTOMY DEVICES MARKET BY APPLICATION (USD BILLION) 2020-2029
TABLE 42 SOUTH AMERICA ATHERECTOMY DEVICES MARKET BY APPLICATION (THOUSAND UNITS) 2020-2029
TABLE 43 BRAZIL ATHERECTOMY DEVICES MARKET BY PRODUCT (USD BILLION) 2020-2029
TABLE 44 BRAZIL ATHERECTOMY DEVICES MARKET BY PRODUCT (THOUSAND UNITS) 2020-2029
TABLE 45 BRAZIL ATHERECTOMY DEVICES MARKET BY END USER (USD BILLION) 2020-2029
TABLE 46 BRAZIL ATHERECTOMY DEVICES MARKET BY END USER (THOUSAND UNITS) 2020-2029
TABLE 47 BRAZIL ATHERECTOMY DEVICES MARKET BY APPLICATION (USD BILLION) 2020-2029
TABLE 48 BRAZIL ATHERECTOMY DEVICES MARKET BY APPLICATION (THOUSAND UNITS) 2020-2029
TABLE 49 ARGENTINA ATHERECTOMY DEVICES MARKET BY PRODUCT (USD BILLION) 2020-2029
TABLE 50 ARGENTINA ATHERECTOMY DEVICES MARKET BY PRODUCT (THOUSAND UNITS) 2020-2029
TABLE 51 ARGENTINA ATHERECTOMY DEVICES MARKET BY END USER (USD BILLION) 2020-2029
TABLE 52 ARGENTINA ATHERECTOMY DEVICES MARKET BY END USER (THOUSAND UNITS) 2020-2029
TABLE 53 ARGENTINA ATHERECTOMY DEVICES MARKET BY APPLICATION (USD BILLION) 2020-2029
TABLE 54 ARGENTINA ATHERECTOMY DEVICES MARKET BY APPLICATION (THOUSAND UNITS) 2020-2029
TABLE 55 COLOMBIA ATHERECTOMY DEVICES MARKET BY PRODUCT (USD BILLION) 2020-2029
TABLE 56 COLOMBIA ATHERECTOMY DEVICES MARKET BY PRODUCT (THOUSAND UNITS) 2020-2029
TABLE 57 COLOMBIA ATHERECTOMY DEVICES MARKET BY END USER (USD BILLION) 2020-2029
TABLE 58 COLOMBIA ATHERECTOMY DEVICES MARKET BY END USER (THOUSAND UNITS) 2020-2029
TABLE 59 COLOMBIA ATHERECTOMY DEVICES MARKET BY APPLICATION (USD BILLION) 2020-2029
TABLE 60 COLOMBIA ATHERECTOMY DEVICES MARKET BY APPLICATION (THOUSAND UNITS) 2020-2029
TABLE 61 REST OF SOUTH AMERICA ATHERECTOMY DEVICES MARKET BY PRODUCT (USD BILLION) 2020-2029
TABLE 62 REST OF SOUTH AMERICA ATHERECTOMY DEVICES MARKET BY PRODUCT (THOUSAND UNITS) 2020-2029
TABLE 63 REST OF SOUTH AMERICA ATHERECTOMY DEVICES MARKET BY END USER (USD BILLION) 2020-2029
TABLE 64 REST OF SOUTH AMERICA ATHERECTOMY DEVICES MARKET BY END USER (THOUSAND UNITS) 2020-2029
TABLE 65 REST OF SOUTH AMERICA ATHERECTOMY DEVICES MARKET BY APPLICATION (USD BILLION) 2020-2029
TABLE 66 REST OF SOUTH AMERICA ATHERECTOMY DEVICES MARKET BY APPLICATION (THOUSAND UNITS) 2020-2029
TABLE 67 ASIA-PACIFIC ATHERECTOMY DEVICES MARKET BY COUNTRY (USD BILLION) 2020-2029
TABLE 68 ASIA-PACIFIC ATHERECTOMY DEVICES MARKET BY COUNTRY (THOUSAND UNITS) 2020-2029
TABLE 69 ASIA-PACIFIC ATHERECTOMY DEVICES MARKET BY PRODUCT (USD BILLION) 2020-2029
TABLE 70 ASIA-PACIFIC ATHERECTOMY DEVICES MARKET BY PRODUCT (THOUSAND UNITS) 2020-2029
TABLE 71 ASIA-PACIFIC ATHERECTOMY DEVICES MARKET BY END USER (USD BILLION) 2020-2029
TABLE 72 ASIA-PACIFIC ATHERECTOMY DEVICES MARKET BY END USER (THOUSAND UNITS) 2020-2029
TABLE 73 ASIA-PACIFIC ATHERECTOMY DEVICES MARKET BY APPLICATION (USD BILLION) 2020-2029
TABLE 74 ASIA-PACIFIC ATHERECTOMY DEVICES MARKET BY APPLICATION (THOUSAND UNITS) 2020-2029
TABLE 75 INDIA ATHERECTOMY DEVICES MARKET BY PRODUCT (USD BILLION) 2020-2029
TABLE 76 INDIA ATHERECTOMY DEVICES MARKET BY PRODUCT (THOUSAND UNITS) 2020-2029
TABLE 77 INDIA ATHERECTOMY DEVICES MARKET BY END USER (USD BILLION) 2020-2029
TABLE 78 INDIA ATHERECTOMY DEVICES MARKET BY END USER (THOUSAND UNITS) 2020-2029
TABLE 79 INDIA ATHERECTOMY DEVICES MARKET BY APPLICATION (USD BILLION) 2020-2029
TABLE 80 INDIA ATHERECTOMY DEVICES MARKET BY APPLICATION (THOUSAND UNITS) 2020-2029
TABLE 81 CHINA ATHERECTOMY DEVICES MARKET BY PRODUCT (USD BILLION) 2020-2029
TABLE 82 CHINA ATHERECTOMY DEVICES MARKET BY PRODUCT (THOUSAND UNITS) 2020-2029
TABLE 83 CHINA ATHERECTOMY DEVICES MARKET BY END USER (USD BILLION) 2020-2029
TABLE 84 CHINA ATHERECTOMY DEVICES MARKET BY END USER (THOUSAND UNITS) 2020-2029
TABLE 85 CHINA ATHERECTOMY DEVICES MARKET BY APPLICATION (USD BILLION) 2020-2029
TABLE 86 CHINA ATHERECTOMY DEVICES MARKET BY APPLICATION (THOUSAND UNITS) 2020-2029
TABLE 87 JAPAN ATHERECTOMY DEVICES MARKET BY PRODUCT (USD BILLION) 2020-2029
TABLE 88 JAPAN ATHERECTOMY DEVICES MARKET BY PRODUCT (THOUSAND UNITS) 2020-2029
TABLE 89 JAPAN ATHERECTOMY DEVICES MARKET BY END USER (USD BILLION) 2020-2029
TABLE 90 JAPAN ATHERECTOMY DEVICES MARKET BY END USER (THOUSAND UNITS) 2020-2029
TABLE 91 JAPAN ATHERECTOMY DEVICES MARKET BY APPLICATION (USD BILLION) 2020-2029
TABLE 92 JAPAN ATHERECTOMY DEVICES MARKET BY APPLICATION (THOUSAND UNITS) 2020-2029
TABLE 93 SOUTH KOREA ATHERECTOMY DEVICES MARKET BY PRODUCT (USD BILLION) 2020-2029
TABLE 94 SOUTH KOREA ATHERECTOMY DEVICES MARKET BY PRODUCT (THOUSAND UNITS) 2020-2029
TABLE 95 SOUTH KOREA ATHERECTOMY DEVICES MARKET BY END USER (USD BILLION) 2020-2029
TABLE 96 SOUTH KOREA ATHERECTOMY DEVICES MARKET BY END USER (THOUSAND UNITS) 2020-2029
TABLE 97 SOUTH KOREA ATHERECTOMY DEVICES MARKET BY APPLICATION (USD BILLION) 2020-2029
TABLE 98 SOUTH KOREA ATHERECTOMY DEVICES MARKET BY APPLICATION (THOUSAND UNITS) 2020-2029
TABLE 99 AUSTRALIA ATHERECTOMY DEVICES MARKET BY PRODUCT (USD BILLION) 2020-2029
TABLE 100 AUSTRALIA ATHERECTOMY DEVICES MARKET BY PRODUCT (THOUSAND UNITS) 2020-2029
TABLE 101 AUSTRALIA ATHERECTOMY DEVICES MARKET BY END USER (USD BILLION) 2020-2029
TABLE 102 AUSTRALIA ATHERECTOMY DEVICES MARKET BY END USER (THOUSAND UNITS) 2020-2029
TABLE 103 AUSTRALIA ATHERECTOMY DEVICES MARKET BY APPLICATION (USD BILLION) 2020-2029
TABLE 104 AUSTRALIA ATHERECTOMY DEVICES MARKET BY APPLICATION (THOUSAND UNITS) 2020-2029
TABLE 105 SOUTH-EAST ASIA ATHERECTOMY DEVICES MARKET BY PRODUCT (USD BILLION) 2020-2029
TABLE 106 SOUTH-EAST ASIA ATHERECTOMY DEVICES MARKET BY PRODUCT (THOUSAND UNITS) 2020-2029
TABLE 107 SOUTH-EAST ASIA ATHERECTOMY DEVICES MARKET BY END USER (USD BILLION) 2020-2029
TABLE 108 SOUTH-EAST ASIA ATHERECTOMY DEVICES MARKET BY END USER (THOUSAND UNITS) 2020-2029
TABLE 109 SOUTH-EAST ASIA ATHERECTOMY DEVICES MARKET BY APPLICATION (USD BILLION) 2020-2029
TABLE 110 SOUTH-EAST ASIA ATHERECTOMY DEVICES MARKET BY APPLICATION (THOUSAND UNITS) 2020-2029
TABLE 111 REST OF ASIA PACIFIC ATHERECTOMY DEVICES MARKET BY PRODUCT (USD BILLION) 2020-2029
TABLE 112 REST OF ASIA PACIFIC ATHERECTOMY DEVICES MARKET BY PRODUCT (THOUSAND UNITS) 2020-2029
TABLE 113 REST OF ASIA PACIFIC ATHERECTOMY DEVICES MARKET BY END USER (USD BILLION) 2020-2029
TABLE 114 REST OF ASIA PACIFIC ATHERECTOMY DEVICES MARKET BY END USER (THOUSAND UNITS) 2020-2029
TABLE 115 REST OF ASIA PACIFIC ATHERECTOMY DEVICES MARKET BY APPLICATION (USD BILLION) 2020-2029
TABLE 116 REST OF ASIA PACIFIC ATHERECTOMY DEVICES MARKET BY APPLICATION (THOUSAND UNITS) 2020-2029
TABLE 117 EUROPE ATHERECTOMY DEVICES MARKET BY COUNTRY (USD BILLION) 2020-2029
TABLE 118 EUROPE ATHERECTOMY DEVICES MARKET BY COUNTRY (THOUSAND UNITS) 2020-2029
TABLE 119 EUROPE ATHERECTOMY DEVICES MARKET BY PRODUCT (USD BILLION) 2020-2029
TABLE 120 EUROPE ATHERECTOMY DEVICES MARKET BY PRODUCT (THOUSAND UNITS) 2020-2029
TABLE 121 EUROPE ATHERECTOMY DEVICES MARKET BY END USER (USD BILLION) 2020-2029
TABLE 122 EUROPE ATHERECTOMY DEVICES MARKET BY END USER (THOUSAND UNITS) 2020-2029
TABLE 123 EUROPE ATHERECTOMY DEVICES MARKET BY APPLICATION (USD BILLION) 2020-2029
TABLE 124 EUROPE ATHERECTOMY DEVICES MARKET BY APPLICATION (THOUSAND UNITS) 2020-2029
TABLE 125 GERMANY ATHERECTOMY DEVICES MARKET BY PRODUCT (USD BILLION) 2020-2029
TABLE 126 GERMANY ATHERECTOMY DEVICES MARKET BY PRODUCT (THOUSAND UNITS) 2020-2029
TABLE 127 GERMANY ATHERECTOMY DEVICES MARKET BY END USER (USD BILLION) 2020-2029
TABLE 128 GERMANY ATHERECTOMY DEVICES MARKET BY END USER (THOUSAND UNITS) 2020-2029
TABLE 129 GERMANY ATHERECTOMY DEVICES MARKET BY APPLICATION (USD BILLION) 2020-2029
TABLE 130 GERMANY ATHERECTOMY DEVICES MARKET BY APPLICATION (THOUSAND UNITS) 2020-2029
TABLE 131 UK ATHERECTOMY DEVICES MARKET BY PRODUCT (USD BILLION) 2020-2029
TABLE 132 UK ATHERECTOMY DEVICES MARKET BY PRODUCT (THOUSAND UNITS) 2020-2029
TABLE 133 UK ATHERECTOMY DEVICES MARKET BY END USER (USD BILLION) 2020-2029
TABLE 134 UK ATHERECTOMY DEVICES MARKET BY END USER (THOUSAND UNITS) 2020-2029
TABLE 135 UK ATHERECTOMY DEVICES MARKET BY APPLICATION (USD BILLION) 2020-2029
TABLE 136 UK ATHERECTOMY DEVICES MARKET BY APPLICATION (THOUSAND UNITS) 2020-2029
TABLE 137 FRANCE ATHERECTOMY DEVICES MARKET BY PRODUCT (USD BILLION) 2020-2029
TABLE 138 FRANCE ATHERECTOMY DEVICES MARKET BY PRODUCT (THOUSAND UNITS) 2020-2029
TABLE 139 FRANCE ATHERECTOMY DEVICES MARKET BY END USER (USD BILLION) 2020-2029
TABLE 140 FRANCE ATHERECTOMY DEVICES MARKET BY END USER (THOUSAND UNITS) 2020-2029
TABLE 141 FRANCE ATHERECTOMY DEVICES MARKET BY APPLICATION (USD BILLION) 2020-2029
TABLE 142 FRANCE ATHERECTOMY DEVICES MARKET BY APPLICATION (THOUSAND UNITS) 2020-2029
TABLE 143 ITALY ATHERECTOMY DEVICES MARKET BY PRODUCT (USD BILLION) 2020-2029
TABLE 144 ITALY ATHERECTOMY DEVICES MARKET BY PRODUCT (THOUSAND UNITS) 2020-2029
TABLE 145 ITALY ATHERECTOMY DEVICES MARKET BY END USER (USD BILLION) 2020-2029
TABLE 146 ITALY ATHERECTOMY DEVICES MARKET BY END USER (THOUSAND UNITS) 2020-2029
TABLE 147 ITALY ATHERECTOMY DEVICES MARKET BY APPLICATION (USD BILLION) 2020-2029
TABLE 148 ITALY ATHERECTOMY DEVICES MARKET BY APPLICATION (THOUSAND UNITS) 2020-2029
TABLE 149 SPAIN ATHERECTOMY DEVICES MARKET BY PRODUCT (USD BILLION) 2020-2029
TABLE 150 SPAIN ATHERECTOMY DEVICES MARKET BY PRODUCT (THOUSAND UNITS) 2020-2029
TABLE 151 SPAIN ATHERECTOMY DEVICES MARKET BY END USER (USD BILLION) 2020-2029
TABLE 152 SPAIN ATHERECTOMY DEVICES MARKET BY END USER (THOUSAND UNITS) 2020-2029
TABLE 153 SPAIN ATHERECTOMY DEVICES MARKET BY APPLICATION (USD BILLION) 2020-2029
TABLE 154 SPAIN ATHERECTOMY DEVICES MARKET BY APPLICATION (THOUSAND UNITS) 2020-2029
TABLE 155 RUSSIA ATHERECTOMY DEVICES MARKET BY PRODUCT (USD BILLION) 2020-2029
TABLE 156 RUSSIA ATHERECTOMY DEVICES MARKET BY PRODUCT (THOUSAND UNITS) 2020-2029
TABLE 157 RUSSIA ATHERECTOMY DEVICES MARKET BY END USER (USD BILLION) 2020-2029
TABLE 158 RUSSIA ATHERECTOMY DEVICES MARKET BY END USER (THOUSAND UNITS) 2020-2029
TABLE 159 RUSSIA ATHERECTOMY DEVICES MARKET BY APPLICATION (USD BILLION) 2020-2029
TABLE 160 RUSSIA ATHERECTOMY DEVICES MARKET BY APPLICATION (THOUSAND UNITS) 2020-2029
TABLE 161 REST OF EUROPE ATHERECTOMY DEVICES MARKET BY PRODUCT (USD BILLION) 2020-2029
TABLE 162 REST OF EUROPE ATHERECTOMY DEVICES MARKET BY PRODUCT (THOUSAND UNITS) 2020-2029
TABLE 163 REST OF EUROPE ATHERECTOMY DEVICES MARKET BY END USER (USD BILLION) 2020-2029
TABLE 164 REST OF EUROPE ATHERECTOMY DEVICES MARKET BY END USER (THOUSAND UNITS) 2020-2029
TABLE 165 REST OF EUROPE ATHERECTOMY DEVICES MARKET BY APPLICATION (USD BILLION) 2020-2029
TABLE 166 REST OF EUROPE ATHERECTOMY DEVICES MARKET BY APPLICATION (THOUSAND UNITS) 2020-2029
TABLE 167 MIDDLE EAST AND AFRICA ATHERECTOMY DEVICES MARKET BY COUNTRY (USD BILLION) 2020-2029
TABLE 168 MIDDLE EAST AND AFRICA ATHERECTOMY DEVICES MARKET BY COUNTRY (THOUSAND UNITS) 2020-2029
TABLE 169 MIDDLE EAST AND AFRICA ATHERECTOMY DEVICES MARKET BY PRODUCT (USD BILLION) 2020-2029
TABLE 170 MIDDLE EAST AND AFRICA ATHERECTOMY DEVICES MARKET BY PRODUCT (THOUSAND UNITS) 2020-2029
TABLE 171 MIDDLE EAST AND AFRICA ATHERECTOMY DEVICES MARKET BY END USER (USD BILLION) 2020-2029
TABLE 172 MIDDLE EAST AND AFRICA ATHERECTOMY DEVICES MARKET BY END USER (THOUSAND UNITS) 2020-2029
TABLE 173 MIDDLE EAST AND AFRICA ATHERECTOMY DEVICES MARKET BY APPLICATION (USD BILLION) 2020-2029
TABLE 174 MIDDLE EAST AND AFRICA ATHERECTOMY DEVICES MARKET BY APPLICATION (THOUSAND UNITS) 2020-2029
TABLE 175 UAE ATHERECTOMY DEVICES MARKET BY PRODUCT (USD BILLION) 2020-2029
TABLE 176 UAE ATHERECTOMY DEVICES MARKET BY PRODUCT (THOUSAND UNITS) 2020-2029
TABLE 177 UAE ATHERECTOMY DEVICES MARKET BY END USER (USD BILLION) 2020-2029
TABLE 178 UAE ATHERECTOMY DEVICES MARKET BY END USER (THOUSAND UNITS) 2020-2029
TABLE 179 UAE ATHERECTOMY DEVICES MARKET BY APPLICATION (USD BILLION) 2020-2029
TABLE 180 UAE ATHERECTOMY DEVICES MARKET BY APPLICATION (THOUSAND UNITS) 2020-2029
TABLE 181 SAUDI ARABIA ATHERECTOMY DEVICES MARKET BY PRODUCT (USD BILLION) 2020-2029
TABLE 182 SAUDI ARABIA ATHERECTOMY DEVICES MARKET BY PRODUCT (THOUSAND UNITS) 2020-2029
TABLE 183 SAUDI ARABIA ATHERECTOMY DEVICES MARKET BY END USER (USD BILLION) 2020-2029
TABLE 184 SAUDI ARABIA ATHERECTOMY DEVICES MARKET BY END USER (THOUSAND UNITS) 2020-2029
TABLE 185 SAUDI ARABIA ATHERECTOMY DEVICES MARKET BY APPLICATION (USD BILLION) 2020-2029
TABLE 186 SAUDI ARABIA ATHERECTOMY DEVICES MARKET BY APPLICATION (THOUSAND UNITS) 2020-2029
TABLE 187 SOUTH AFRICA ATHERECTOMY DEVICES MARKET BY PRODUCT (USD BILLION) 2020-2029
TABLE 188 SOUTH AFRICA ATHERECTOMY DEVICES MARKET BY PRODUCT (THOUSAND UNITS) 2020-2029
TABLE 189 SOUTH AFRICA ATHERECTOMY DEVICES MARKET BY END USER (USD BILLION) 2020-2029
TABLE 190 SOUTH AFRICA ATHERECTOMY DEVICES MARKET BY END USER (THOUSAND UNITS) 2020-2029
TABLE 191 SOUTH AFRICA ATHERECTOMY DEVICES MARKET BY APPLICATION (USD BILLION) 2020-2029
TABLE 192 SOUTH AFRICA ATHERECTOMY DEVICES MARKET BY APPLICATION (THOUSAND UNITS) 2020-2029
TABLE 193 REST OF MIDDLE EAST AND AFRICA ATHERECTOMY DEVICES MARKET BY PRODUCT (USD BILLION) 2020-2029
TABLE 194 REST OF MIDDLE EAST AND AFRICA ATHERECTOMY DEVICES MARKET BY PRODUCT (THOUSAND UNITS) 2020-2029
TABLE 195 REST OF MIDDLE EAST AND AFRICA ATHERECTOMY DEVICES MARKET BY END USER (USD BILLION) 2020-2029
TABLE 196 REST OF MIDDLE EAST AND AFRICA ATHERECTOMY DEVICES MARKET BY END USER (THOUSAND UNITS) 2020-2029
TABLE 197 REST OF MIDDLE EAST AND AFRICA ATHERECTOMY DEVICES MARKET BY APPLICATION (USD BILLION) 2020-2029
TABLE 198 REST OF MIDDLE EAST AND AFRICA ATHERECTOMY DEVICES MARKET BY APPLICATION (THOUSAND UNITS) 2020-2029
LIST OF FIGURES
FIGURE 1 MARKET DYNAMICS
FIGURE 2 MARKET SEGMENTATION
FIGURE 3 REPORT TIMELINES: YEARS CONSIDERED
FIGURE 4 DATA TRIANGULATION
FIGURE 5 BOTTOM-UP APPROACH
FIGURE 6 TOP-DOWN APPROACH
FIGURE 7 RESEARCH FLOW
FIGURE 8 GLOBAL ATHERECTOMY DEVICES MARKET BY PRODUCT, USD BILLION, 2020-2029
FIGURE 9 GLOBAL ATHERECTOMY DEVICES MARKET BY END USER, USD BILLION, 2020-2029
FIGURE 10 GLOBAL ATHERECTOMY DEVICES MARKET BY APPLICATION, USD BILLION, 2020-2029
FIGURE 11 GLOBAL ATHERECTOMY DEVICES MARKET BY REGION, USD BILLION, 2020-2029
FIGURE 12 PORTER’S FIVE FORCES MODEL
FIGURE 13 GLOBAL ATHERECTOMY DEVICES MARKET BY PRODUCT, USD BILLION, 2021
FIGURE 14 GLOBAL ATHERECTOMY DEVICES MARKET BY END USER, USD BILLION, 2021
FIGURE 15 GLOBAL ATHERECTOMY DEVICES MARKET BY APPLICATION, USD BILLION, 2021
FIGURE 16 GLOBAL ATHERECTOMY DEVICES MARKET BY REGION, USD BILLION, 2021
FIGURE 17 NORTH AMERICA ATHERECTOMY DEVICES MARKET SNAPSHOT
FIGURE 18 EUROPE ATHERECTOMY DEVICES MARKET SNAPSHOT
FIGURE 19 SOUTH AMERICA ATHERECTOMY DEVICES MARKET SNAPSHOT
FIGURE 20 ASIA PACIFIC ATHERECTOMY DEVICES MARKET SNAPSHOT
FIGURE 21 MIDDLE EAST ASIA AND AFRICA ATHERECTOMY DEVICES MARKET SNAPSHOT
FIGURE 22 MARKET SHARE ANALYSIS
FIGURE 23 MEDTRONIC PLC: COMPANY SNAPSHOT
FIGURE 24 KONINKLIJKE PHILIPS N.V.: COMPANY SNAPSHOT
FIGURE 25 BOSTON SCIENTIFIC CORPORATION: COMPANY SNAPSHOT
FIGURE 26 CARDIOVASCULAR SYSTEMS INC.: COMPANY SNAPSHOT
FIGURE 27 BECTON DICKINSON AND COMPANY: COMPANY SNAPSHOT
FIGURE 28 ANGIODYNAMICS INC.: COMPANY SNAPSHOT
FIGURE 29 REX MEDICAL: COMPANY SNAPSHOT
FIGURE 30 NIPRO CORPORATION: COMPANY SNAPSHOT
FIGURE 31 INVAMED MEDICAL: COMPANY SNAPSHOT
FIGURE 32 AVINGER INC.: COMPANY SNAPSHOT
DOWNLOAD FREE SAMPLE REPORT
License Type
SPEAK WITH OUR ANALYST
Want to know more about the report or any specific requirement?
WANT TO CUSTOMIZE THE REPORT?
Our Clients Speak
We asked them to research ‘ Equipment market’ all over the world, and their whole arrangement was helpful to us. thehealthanalytics.com insightful analysis and reports contributed to our current analysis and in creating a future strategy. Besides, the te
Yosuke Mitsui
Senior Associate Construction Equipment Sales & Marketing
We asked them to research ‘Equipment market’ all over the world, and their whole arrangement was helpful to us. thehealthanalytics.com insightful analysis and reports contributed to our current analysis and in creating a future strategy. Besides, the te


