REPORT OUTLOOK
| Market Size | CAGR | Dominating Region |
|---|---|---|
| USD 7.79 billion by 2030 | 12.36% | North America |
| by Component | by Delivery Mode | by Solution |
|---|---|---|
|
|
|
SCOPE OF THE REPORT
Operating Room Management Market Overview
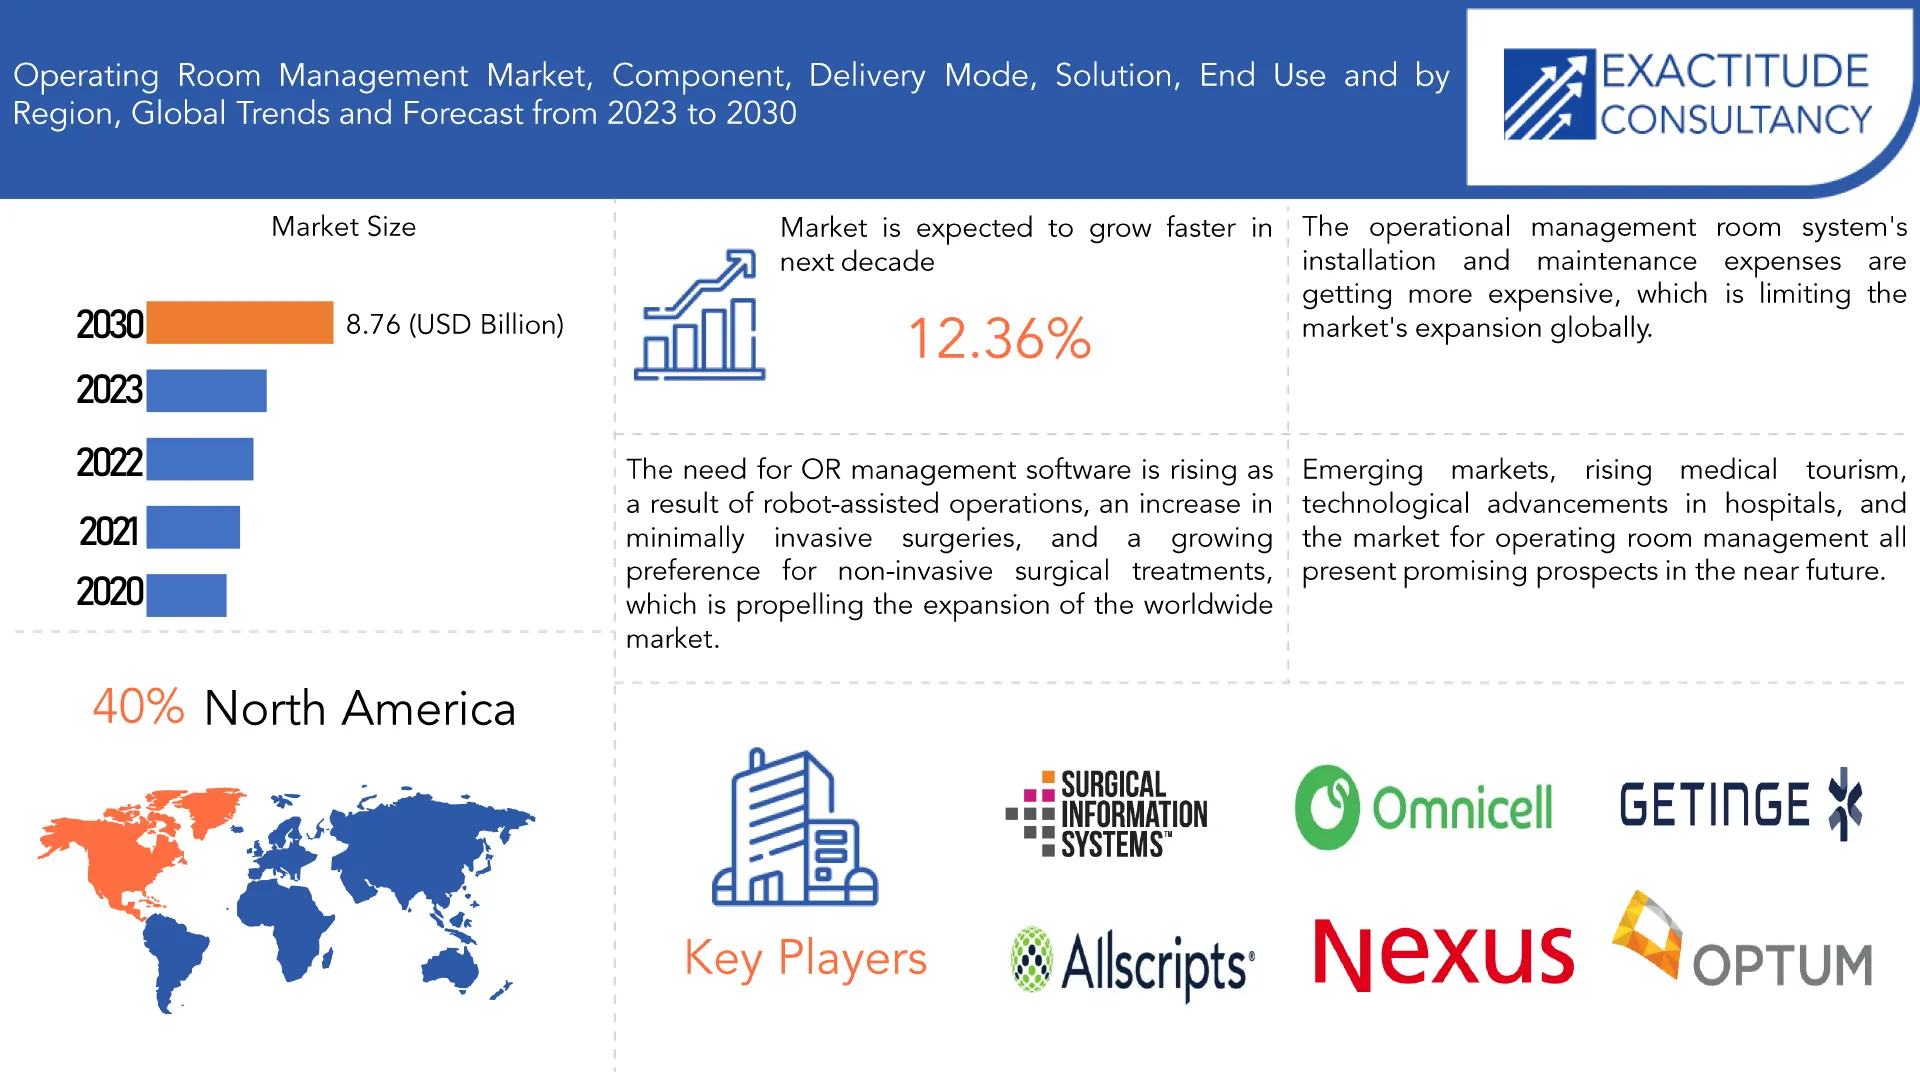
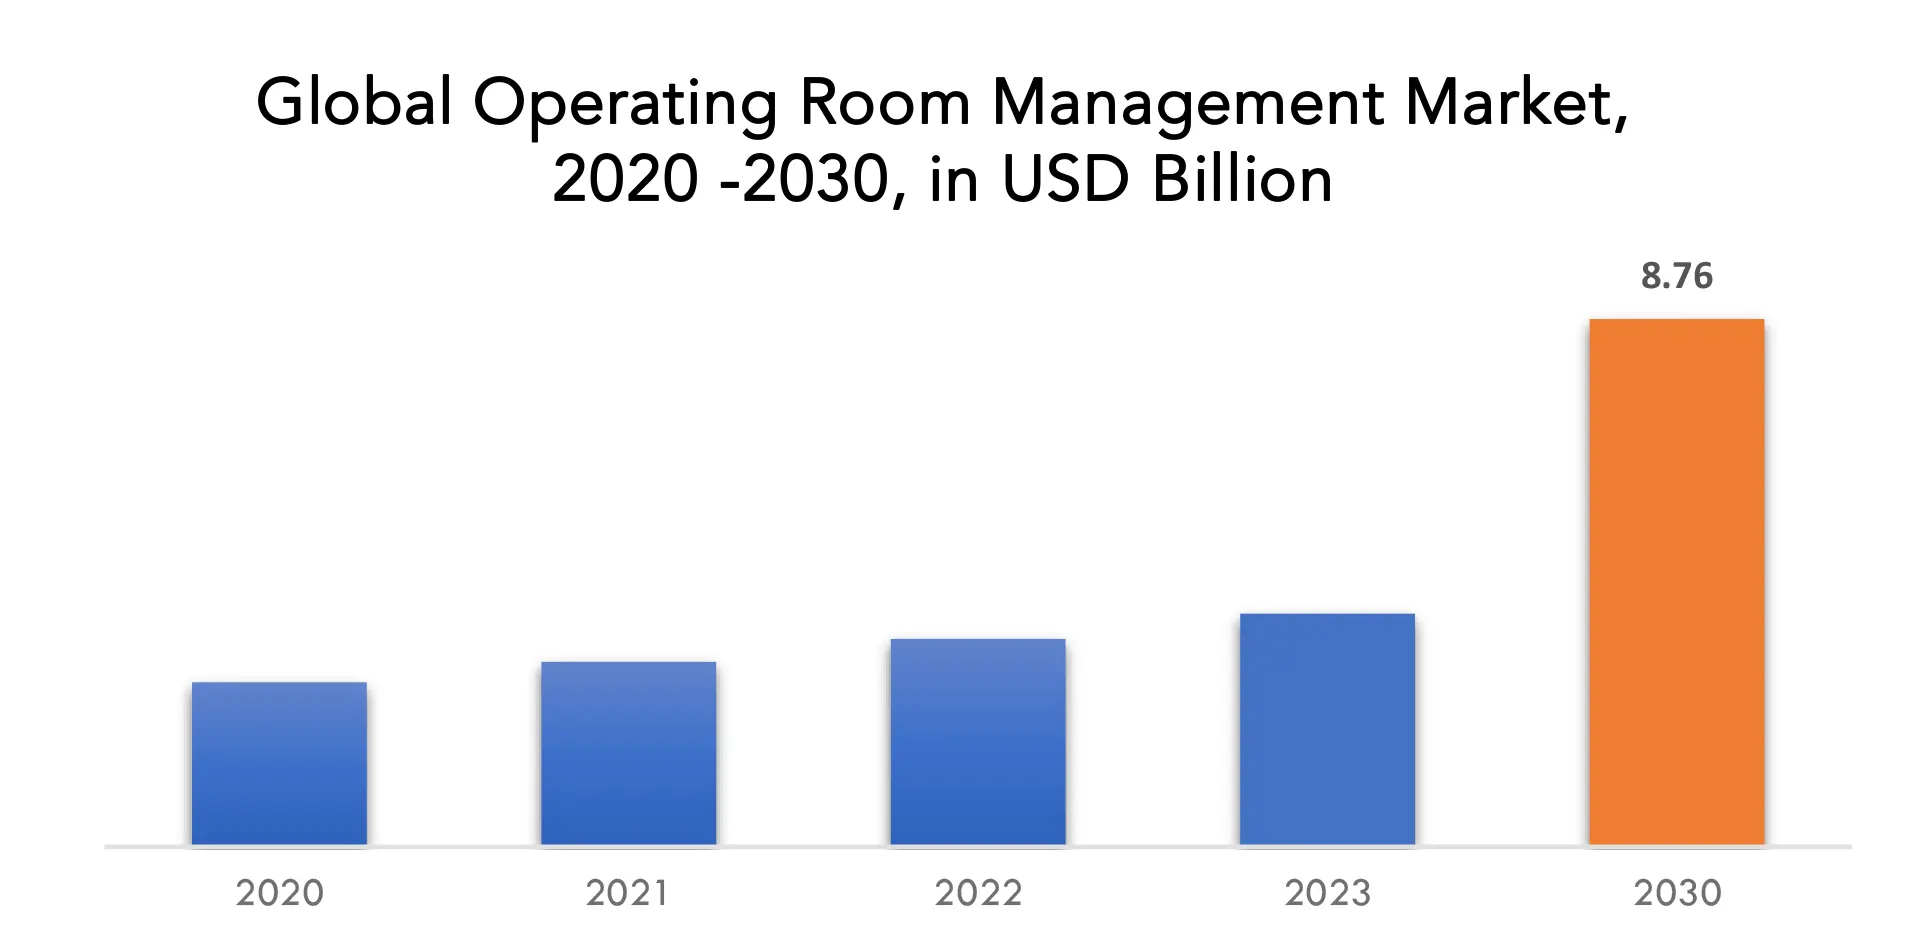
The global operating room management market size was valued at USD 2.73 billion in 2023, and projected to reach USD 7.79 billion by 2030, with a CAGR of 12.36% from 2023 to 2030.
The operating room (OR) of a hospital is a sterile environment in which surgical operations are performed. The operating room requires good management, which is accomplished by resident surgeon training, efficient scheduling, reducing the length of the medical case through parallel processing, selecting the best aesthetic techniques, and overseeing the operating room’s overall operation. To guarantee effective and secure patient care, the operating room must be well managed. Before the operation day, OR managers often prepare and carry out a lot of the decision-making, including personnel assignments, time allocation for the OR, and case length prediction. Operating room management, which involves completing numerous surgical operations with limited resources, can increase operational efficiency.
Products and services that are used to oversee and maximize the usage of operating rooms (ORs) are included in the operating room management market. The coordination of actions among several stakeholders, such as surgeons, anesthesiologists, nurses, and support personnel, constitutes the complicated process known as OR management. The number of surgical operations performed, the number of hospitals and ambulatory surgery centers (ASCs), and the number of ORs per institution are all contributing to the growth of the OR management industry. Additionally, it is anticipated that an increase in the prevalence of chronic disorders that need for surgery would be brought on by the ageing population.
Increasing health insurance premiums, growing demand for high-quality medical treatment, an ageing population, and an increase in the incidence of chronic illnesses are the main causes of the huge rise in the total cost of delivering healthcare. Many governments and healthcare systems throughout the world are increasingly focusing on containing rising healthcare costs by lowering the number of patient readmissions, medical mistakes, and administrative costs through the efficient use of various healthcare IT technologies. Therefore, it is projected that hospitals’ increased focus on cost reduction and efficiency improvement would boost the rise of this market in the future year.
The expensive installation and upkeep of ORM systems has specifically hindered their adoption. Once it has been installed, the expense of upgrading ORM software on a regular basis to take into account user wants and software improvements is ongoing. In addition, the cost of maintaining complex IT-enabled systems is usually greater than the price of the product itself. Therefore, it is reasonable to assume that the high costs related to the purchase, installation, maintenance, and updating of ORM software and solutions would negatively affect end users’ perceptions of these products, thereby restricting market development to some extent.
The increased prevalence of cancer, improvements in healthcare infrastructure, a laxer regulatory environment, and an increase in medical tourism are encouraging operating room management market companies to increase their presence in emerging countries. Due to an increase in patients, emerging nations will certainly have more hospitals and surgical facilities in the next years. Furthermore, the governments of these countries are now implementing plans to improve and expand each of their own healthcare systems.
One of the biggest challenges for operating room management systems is the mix of healthcare providers. The number of independent healthcare providers has decreased as a result of the majority of healthcare providers opting to mergers, acquisitions, and partnerships in addition to operating as part of a health system. Lack of consumers may cause the market to become oligopolistic, providing consumers more negotiating power and perhaps decreasing the profit margins of operating room management system suppliers.
- RD Table
| ATTRIBUTE | DETAILS |
| Study period | 2020-2030 |
| Base year | 2022 |
| Estimated year | 2023 |
| Forecasted year | 2023-2030 |
| Historical period | 2019-2021 |
| Unit | Value (USD Billion) |
| Segmentation | By Component, By Delivery Mode, By Solution, By End User, By Region. |
| By Component
|
|
| By Delivery Mode |
|
| By Solution |
|
| By End Use |
|
| By Region |
|
Operating Room Management Market Segment Analysis
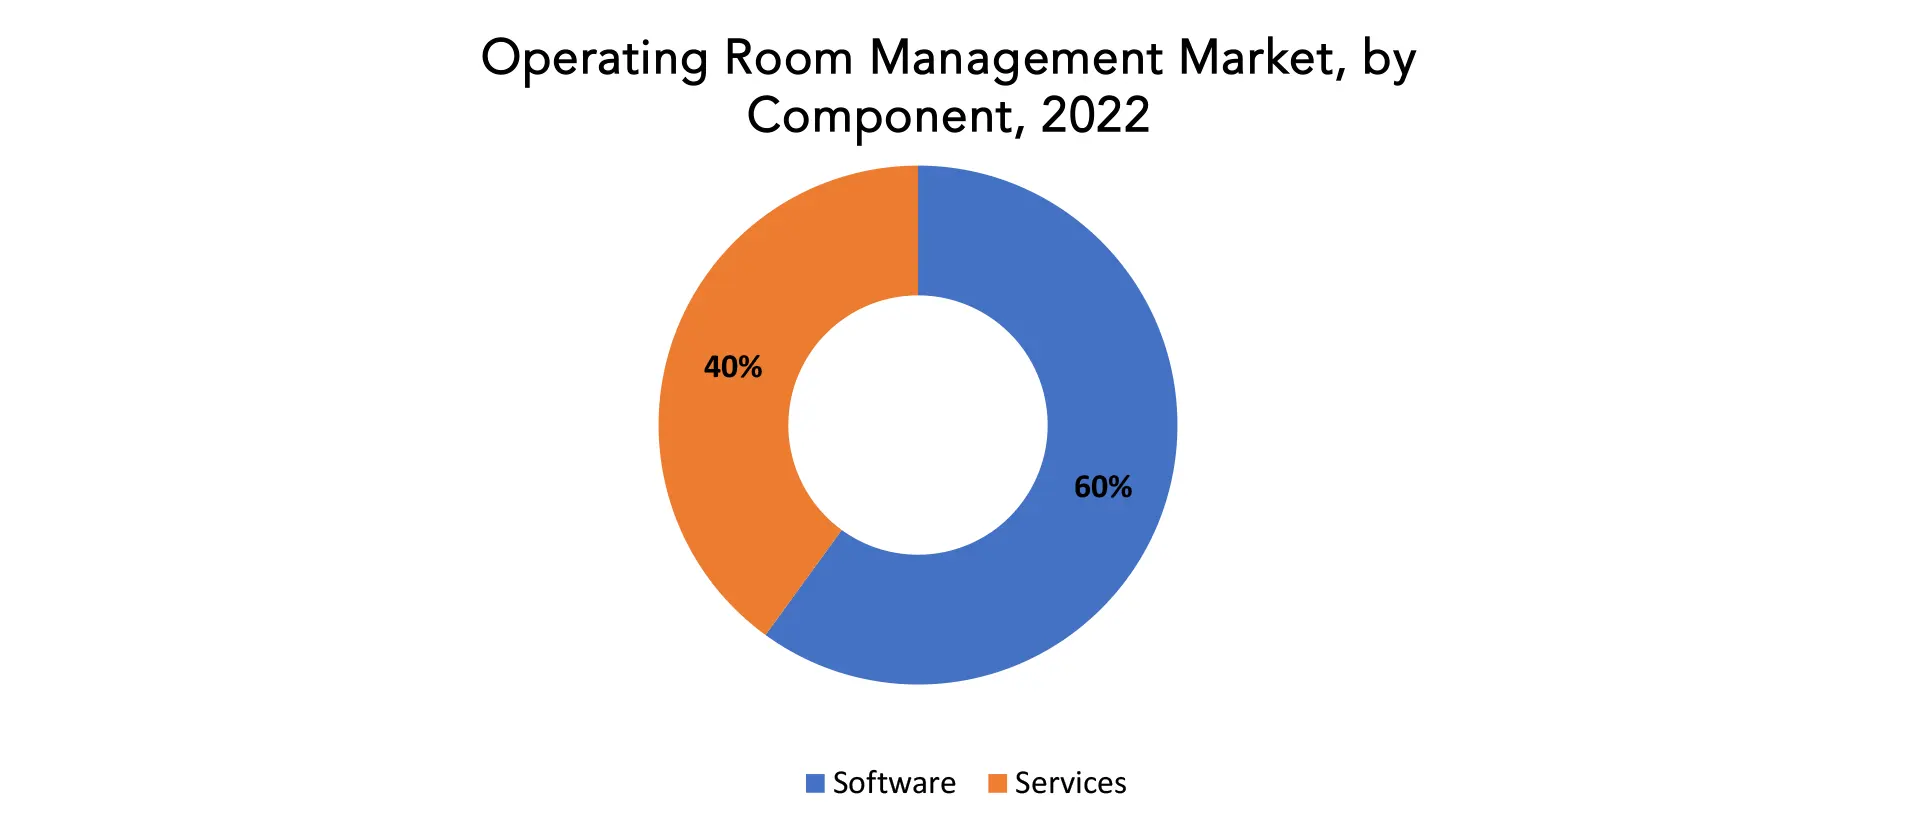
In 2022, the software market contributed a sizeable portion of total income. Since operating rooms are a major resource bottleneck and a significant source of revenue for hospitals, they must be utilized effectively. The administration of operating rooms is incredibly complex and calls for constant process analysis, the use of decision support systems, and a growing desire for technology that may simplify the process. Additionally, anesthesia and surgery management software, as well as operating room and patient management software, usually improve operating room performance by offering solutions that aid in improving financial, clinical, and operational outcomes.
Due to benefits like easy patient status sharing all through perioperative care phases, observing schedule regulation, and sharing mediums and case-related information among various operating rooms and other hospital departments, the data control and interaction solution segment made up for a sizeable revenue share in 2022. Additionally, by giving access to evidence-based tools for improved decision support about a patient’s treatment plan, the use of Electronic Health Records (EHR) has assisted in automating and streamlining the workflow in a medical environment. AI-driven EHR solutions provide a range of features and simplify integration.
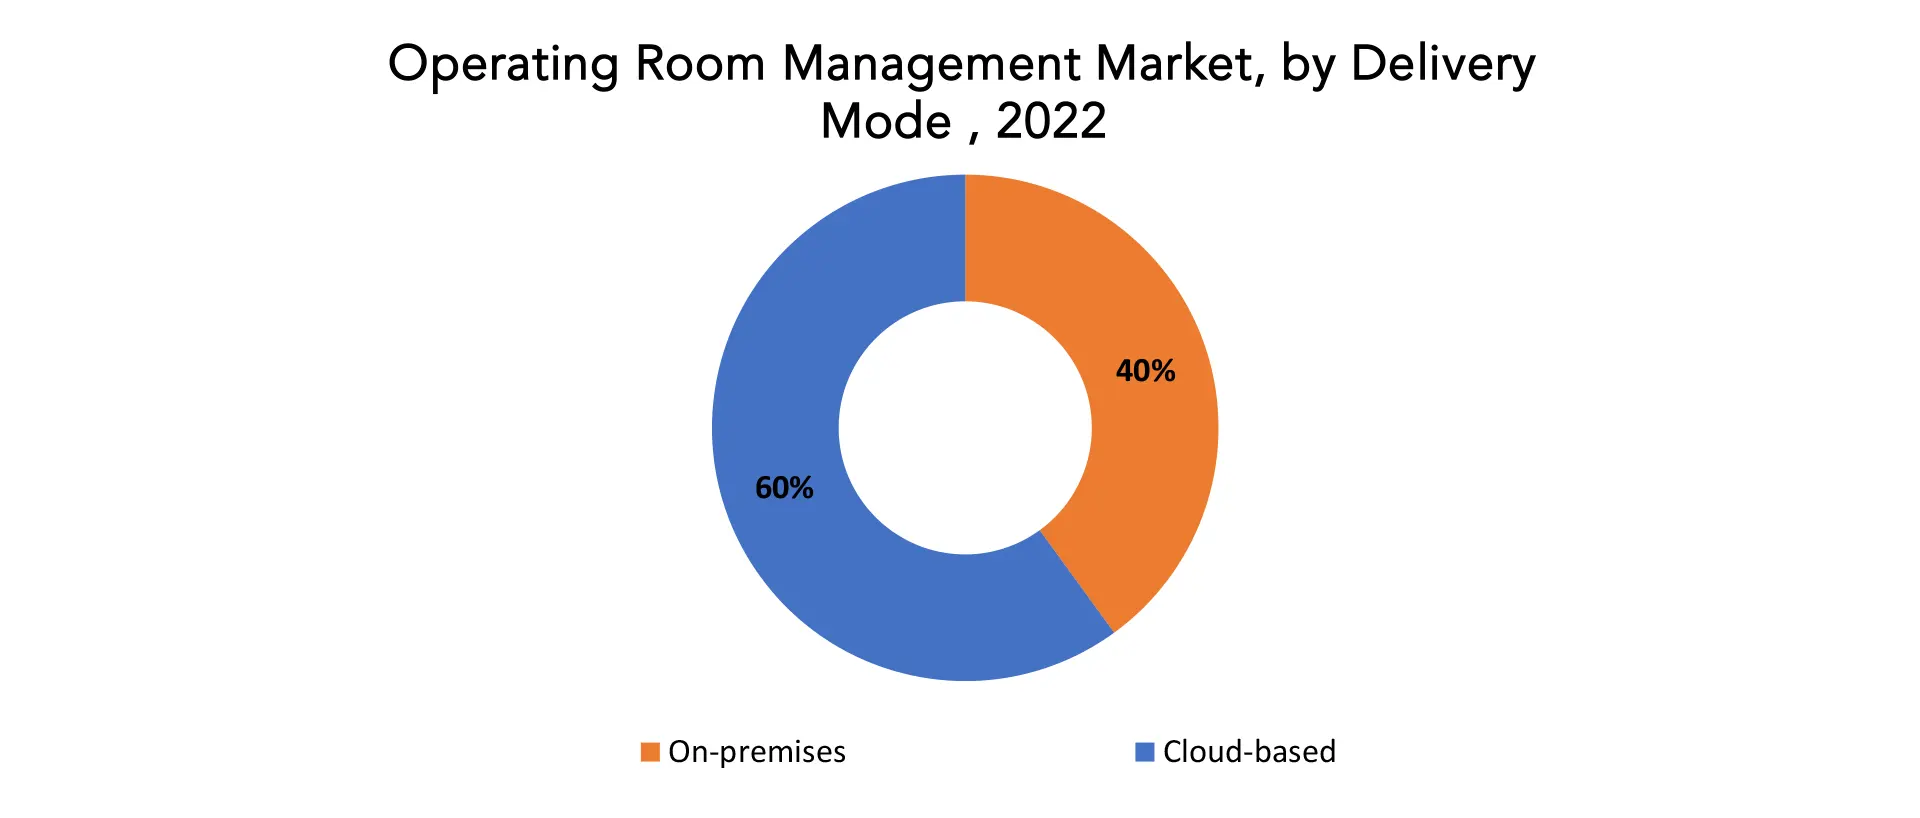
In 2022, the cloud-based market accounted for a sizeable portion of sales. This is mostly due to its improved efficacy and data accessibility across several platforms. Cloud computing is gradually becoming necessary in the medical sector. To store and retrieve their digital information, more healthcare providers are working with companies that offer cloud computing solutions. For both large and small service organizations, the ability to securely store information off-site is seen as a huge advantage. Additionally, scalable and robust IT computing solutions are paving the way for the rising need for these cutting-edge technologies.
A sizable portion of revenue was generated by the hospitals segment in 2022 as a result of an increase in surgical operations. Surgical units in hospitals are frequently the most expensive and least utilized. Optimized operating room scheduling is necessary to guarantee higher surgical unit utilization rates. Additionally, inaccurate or inefficient operating room scheduling results in costly surgical cancellations or delays for both the patient and the institution.
Operating Room Management Market Players
The global market is fragmented in nature with the presence of various key players such as GE Healthcare, Dickinson and Company, Surgical Information Systems, Optum, Meditech, Picis Clinical Solutions, Getinge AB, Steris Plc, Allscripts Healthcare solutions, Nexus AG, Medical Information Technology Inc., Altera Digital Health Inc., Omnicell along with medium and small-scale regional players operating in different parts of the world. Major companies in the market compete in terms of application development capability, product launches, and development of new technologies for product formulation.
April 28, 2023 – The primary goal of Getinge’s collaboration with the Indian Institute of Technology (IIT) in Mumbai was to develop a system that would allow understaffed intensive care units (ICUs) identify the patients who needed urgent treatment the most.
April 11, 2023 – A brand-new, simple-to-use sophisticated ultrasound gadget with a specialised probe was introduced by BD, a pioneer in the field of medical technology, to help professionals put IVs correctly.
Who Should Buy? Or Key stakeholders
- Healthcare providers
- Hospital administrators
- Ambulatory surgery center owners
- Surgery center managers
- Clinical directors
- Surgical teams
- Medical device manufacturers
Operating Room Management Market Regional Analysis
Geographically, the operating room management market is segmented into North America, South America, Europe, APAC and MEA.
- North America: includes the US, Canada, Mexico
- Europe: includes UK, Germany, France, Italy, Spain, Russia, and Rest of Europe
- Asia Pacific: includes China, Japan, South Korea, India, Australia, ASEAN and Rest of APAC
- South America: includes Brazil, Argentina and Rest of South America
- Middle East & Africa: includes Turkey, UAE, Saudi Arabia, South Africa, and Rest of MEA
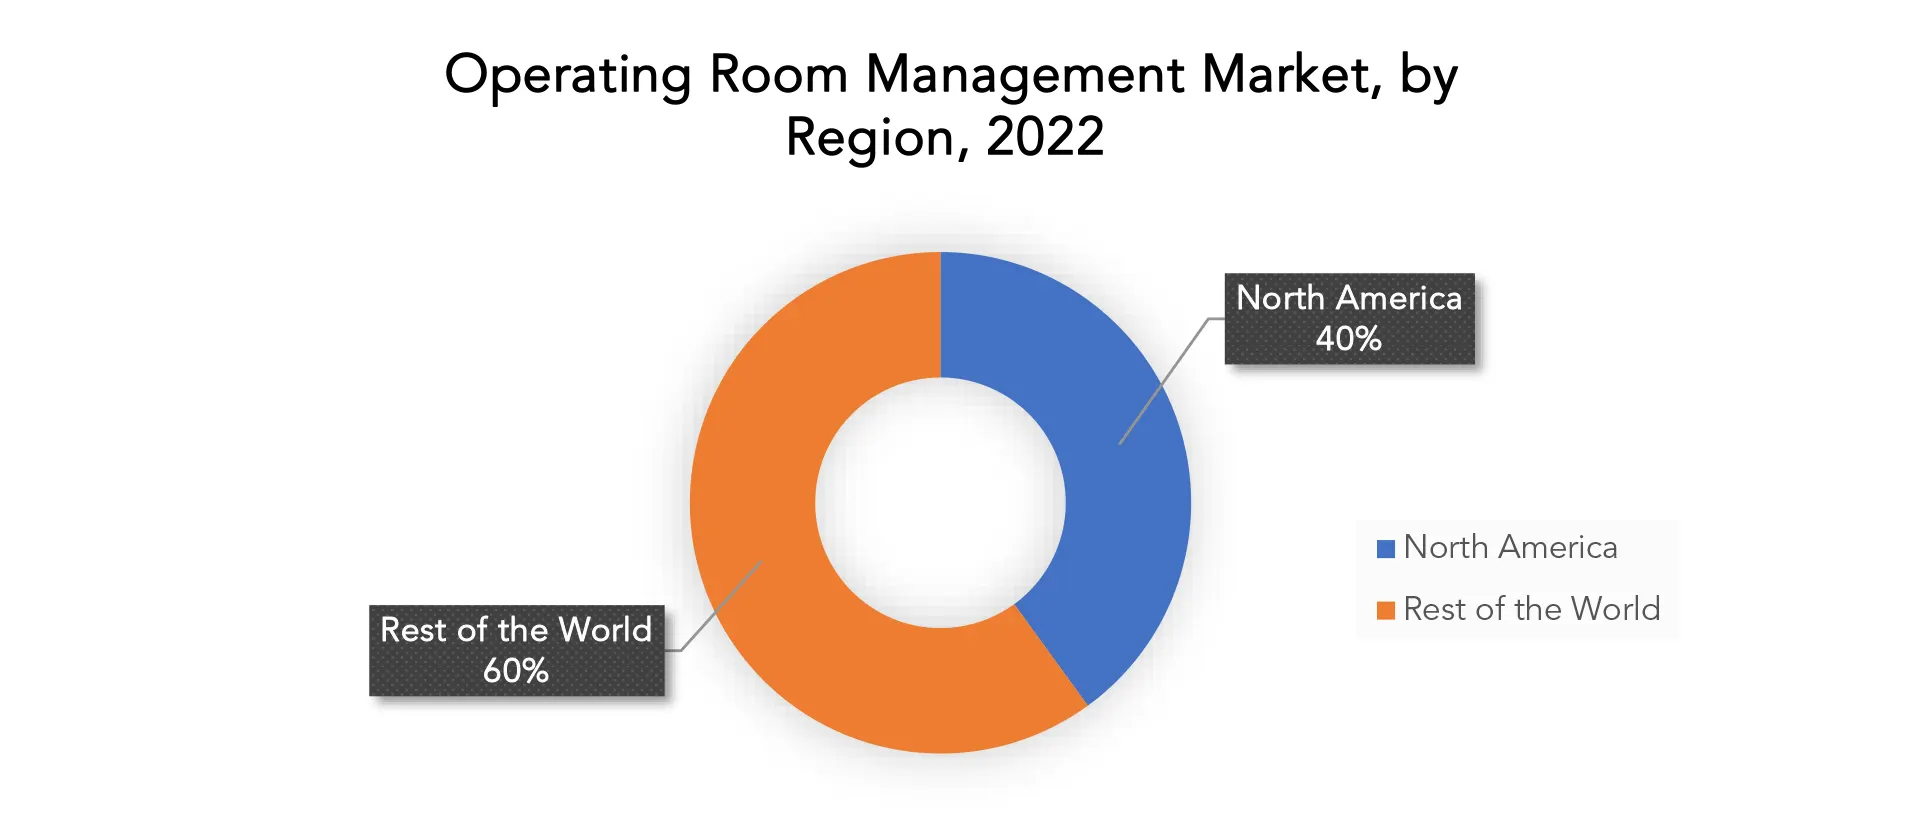
North America’s market will contribute for 40% of total sales in 2022. The existence of established industry players is one of the primary variables affecting the rise in market revenue. Furthermore, the increasing utilization of robotic surgery in this field is fueling market revenue growth. The effective implementation of EHR records by healthcare organizations has a significant impact on market revenue growth in this area. The United States market accounted for the largest revenue share due to the increasing prevalence of chronic disorders. The country’s leading market players are releasing new goods and spending a lot of money to enhance their market positions, causing the market to grow in terms of revenue.
Key Market Segments: Operating Room Management Market
Operating Room Management Market by Component, 2020-2030, (USD Billion)
- Software
- Services
Operating Room Management Market by Delivery Mode, 2020-2030, (USD Billion)
- On-premises
- Cloud-based
Operating Room Management Market by Solution, 2020-2030, (USD Billion)
- Data Management and Communication Solution
- Anesthesia Information Management System
- Operating Room Supply Management Solution
- Operating Room Scheduling Solution
- Performance Management Solution
- Others
Operating Room Management Market by End Use, 2020-2030, (USD Billion)
- Hospitals
- Ambulatory Surgical Centers
- Others
Operating Room Management Market by Region, 2020-2030, (USD Billion)
- North America
- Europe
- Asia Pacific
- South America
- Middle East and Africa
Important Countries in All Regions Are Covered
Exactitude Consultancy Services Key Objectives:
- Increasing sales and market share
- Developing new technology
- Improving profitability
- Entering new markets
- Enhancing brand reputation
Key Question Answered
- What is the expected growth rate of the operating room management market over the next 7 years?
- Who are the major players in the operating room management market and what is their market share?
- What are the end-user industries driving demand for market and what is their outlook?
- What are the opportunities for growth in emerging markets such as Asia-Pacific, Middle East, and Africa?
- How is the economic environment affecting the operating room management market, including factors such as interest rates, inflation, and exchange rates?
- What is the expected impact of government policies and regulations on operating room management market?
- What is the current and forecasted size and growth rate of the global operating room management market?
- What are the key drivers of growth in the operating room management market?
- Who are the major players in the market and what is their market share?
- What are the distribution channels and supply chain dynamics in the operating room management market?
- What are the technological advancements and innovations in the operating room management market and their impact on product development and growth?
- What are the regulatory considerations and their impact on the market?
- What are the challenges faced by players in the operating room management market and how are they addressing these challenges?
- What are the opportunities for growth and expansion in the operating room management market?
- What are the service offerings and specifications of leading players in the market?
Table of Content
- INTRODUCTION
- MARKET DEFINITION
- MARKET SEGMENTATION
- RESEARCH TIMELINES
- ASSUMPTIONS AND LIMITATIONS
- RESEARCH METHODOLOGY
- DATA MINING
- SECONDARY RESEARCH
- PRIMARY RESEARCH
- SUBJECT-MATTER EXPERTS’ ADVICE
- QUALITY CHECKS
- FINAL REVIEW
- DATA TRIANGULATION
- BOTTOM-UP APPROACH
- TOP-DOWN APPROACH
- RESEARCH FLOW
- DATA SOURCES
- DATA MINING
- EXECUTIVE SUMMARY
- MARKET OVERVIEW
- OPERATING ROOM MANAGEMENT MARKET OUTLOOK
- MARKET DRIVERS
- MARKET RESTRAINTS
- MARKET OPPORTUNITIES
- IMPACT OF COVID-19 ON OPERATING ROOM MANAGEMENT MARKET
- PORTER’S FIVE FORCES MODEL
- THREAT FROM NEW ENTRANTS
- THREAT FROM SUBSTITUTES
- BARGAINING POWER OF SUPPLIERS
- BARGAINING POWER OF CUSTOMERS
- DEGREE OF COMPETITION
- INDUSTRY VALUE CHAIN ANALYSIS
- OPERATING ROOM MANAGEMENT MARKET OUTLOOK
- GLOBAL OPERATING ROOM MANAGEMENT MARKET BY COMPONENT, 2020-2030, (USD BILLION)
- SOFTWARE
- SERVICES
- GLOBAL OPERATING ROOM MANAGEMENT MARKET BY DELIVERY MODE, 2020-2030, (USD BILLION)
- ON-PREMISES
- CLOUD-BASED
- GLOBAL OPERATING ROOM MANAGEMENT MARKET BY SOLUTION, 2020-2030, (USD BILLION)
- DATA MANAGEMENT AND COMMUNICATION SOLUTION
- ANESTHESIA INFORMATION MANAGEMENT SYSTEM
- OPERATING ROOM SUPPLY MANAGEMENT SOLUTION
- OPERATING ROOM SCHEDULING SOLUTION
- PERFORMANCE MANAGEMENT SOLUTION
- OTHERS
- GLOBAL OPERATING ROOM MANAGEMENT MARKET BY END USE, 2020-2030, (USD BILLION)
- HOSPITALS
- AMBULATORY SURGICAL CENTERS
- OTHERS
- GLOBAL OPERATING ROOM MANAGEMENT MARKET BY REGION, 2020-2030, (USD BILLION)
- NORTH AMERICA
- US
- CANADA
- MEXICO
- SOUTH AMERICA
- BRAZIL
- ARGENTINA
- COLOMBIA
- REST OF SOUTH AMERICA
- EUROPE
- GERMANY
- UK
- FRANCE
- ITALY
- SPAIN
- RUSSIA
- REST OF EUROPE
- ASIA PACIFIC
- INDIA
- CHINA
- JAPAN
- SOUTH KOREA
- AUSTRALIA
- SOUTH-EAST ASIA
- REST OF ASIA PACIFIC
- MIDDLE EAST AND AFRICA
- UAE
- SAUDI ARABIA
- SOUTH AFRICA
- REST OF MIDDLE EAST AND AFRICA
- NORTH AMERICA
- COMPANY PROFILES*
(BUSINESS OVERVIEW, COMPANY SNAPSHOT, PRODUCTS OFFERED, RECENT DEVELOPMENTS)
- GE HEALTHCARE
- DICKINSON AND COMPANY
- SURGICAL INFORMATION SYSTEMS
- OPTUM
- MEDITECH
- PICIS CLINICAL SOLUTIONS
- GETINGE AB
- STERIS PLC
- ALLSCRIPTS HEALTHCARE SOLUTIONS
- NEXUS AG
- MEDICAL INFORMATION TECHNOLOGY INC.
- ALTERA DIGITAL HEALTH INC.
- OMNICELL
*THE COMPANY LIST IS INDICATIVE
LIST OF TABLES
TABLE 1 GLOBAL OPERATING ROOM MANAGEMENT MARKET BY COMPONENT (USD BILLION) 2020-2030
TABLE 2 GLOBAL OPERATING ROOM MANAGEMENT MARKET BY DELIVERY MODE (USD BILLION) 2020-2030
TABLE 3 GLOBAL OPERATING ROOM MANAGEMENT MARKET BY SOLUTION (USD BILLION) 2020-2030
TABLE 4 GLOBAL OPERATING ROOM MANAGEMENT MARKET BY END USE (USD BILLION) 2020-2030
TABLE 5 GLOBAL OPERATING ROOM MANAGEMENT MARKET BY REGION (USD BILLION) 2020-2030
TABLE 6 NORTH AMERICA OPERATING ROOM MANAGEMENT MARKET BY COUNTRY (USD BILLION) 2020-2030
TABLE 7 NORTH AMERICA OPERATING ROOM MANAGEMENT MARKET BY COMPONENT (USD BILLION) 2020-2030
TABLE 8 NORTH AMERICA OPERATING ROOM MANAGEMENT MARKET BY DELIVERY MODE (USD BILLION) 2020-2030
TABLE 9 NORTH AMERICA OPERATING ROOM MANAGEMENT MARKET BY SOLUTION (USD BILLION) 2020-2030
TABLE 10 NORTH AMERICA OPERATING ROOM MANAGEMENT MARKET BY END USE (USD BILLION) 2020-2030
TABLE 11 US OPERATING ROOM MANAGEMENT MARKET BY COMPONENT (USD BILLION) 2020-2030
TABLE 12 US OPERATING ROOM MANAGEMENT MARKET BY DELIVERY MODE (USD BILLION) 2020-2030
TABLE 13 US OPERATING ROOM MANAGEMENT MARKET BY SOLUTION (USD BILLION) 2020-2030
TABLE 14 US OPERATING ROOM MANAGEMENT MARKET BY END USE (USD BILLION) 2020-2030
TABLE 15 CANADA OPERATING ROOM MANAGEMENT MARKET BY COMPONENT (USD BILLION) 2020-2030
TABLE 16 CANADA OPERATING ROOM MANAGEMENT MARKET BY DELIVERY MODE (USD BILLION) 2020-2030
TABLE 17 CANADA OPERATING ROOM MANAGEMENT MARKET BY SOLUTION (USD BILLION) 2020-2030
TABLE 18 CANADA OPERATING ROOM MANAGEMENT MARKET BY END USE (USD BILLION) 2020-2030
TABLE 19 MEXICO OPERATING ROOM MANAGEMENT MARKET BY COMPONENT (USD BILLION) 2020-2030
TABLE 20 MEXICO OPERATING ROOM MANAGEMENT MARKET BY DELIVERY MODE (USD BILLION) 2020-2030
TABLE 21 MEXICO OPERATING ROOM MANAGEMENT MARKET BY SOLUTION (USD BILLION) 2020-2030
TABLE 22 MEXICO OPERATING ROOM MANAGEMENT MARKET BY END USE (USD BILLION) 2020-2030
TABLE 23 SOUTH AMERICA OPERATING ROOM MANAGEMENT MARKET BY COUNTRY (USD BILLION) 2020-2030
TABLE 24 SOUTH AMERICA OPERATING ROOM MANAGEMENT MARKET BY COMPONENT (USD BILLION) 2020-2030
TABLE 25 SOUTH AMERICA OPERATING ROOM MANAGEMENT MARKET BY DELIVERY MODE (USD BILLION) 2020-2030
TABLE 26 SOUTH AMERICA OPERATING ROOM MANAGEMENT MARKET BY SOLUTION (USD BILLION) 2020-2030
TABLE 27 SOUTH AMERICA OPERATING ROOM MANAGEMENT MARKET BY END USE (USD BILLION) 2020-2030
TABLE 28 BRAZIL OPERATING ROOM MANAGEMENT MARKET BY COMPONENT (USD BILLION) 2020-2030
TABLE 29 BRAZIL OPERATING ROOM MANAGEMENT MARKET BY DELIVERY MODE (USD BILLION) 2020-2030
TABLE 30 BRAZIL OPERATING ROOM MANAGEMENT MARKET BY SOLUTION (USD BILLION) 2020-2030
TABLE 31 BRAZIL OPERATING ROOM MANAGEMENT MARKET BY END USE (USD BILLION) 2020-2030
TABLE 32 ARGENTINA OPERATING ROOM MANAGEMENT MARKET BY COMPONENT (USD BILLION) 2020-2030
TABLE 33 ARGENTINA OPERATING ROOM MANAGEMENT MARKET BY DELIVERY MODE (USD BILLION) 2020-2030
TABLE 34 ARGENTINA OPERATING ROOM MANAGEMENT MARKET BY SOLUTION (USD BILLION) 2020-2030
TABLE 35 ARGENTINA OPERATING ROOM MANAGEMENT MARKET BY END USE (USD BILLION) 2020-2030
TABLE 36 COLOMBIA OPERATING ROOM MANAGEMENT MARKET BY COMPONENT (USD BILLION) 2020-2030
TABLE 37 COLOMBIA OPERATING ROOM MANAGEMENT MARKET BY DELIVERY MODE (USD BILLION) 2020-2030
TABLE 38 COLOMBIA OPERATING ROOM MANAGEMENT MARKET BY SOLUTION (USD BILLION) 2020-2030
TABLE 39 COLOMBIA OPERATING ROOM MANAGEMENT MARKET BY END USE (USD BILLION) 2020-2030
TABLE 40 REST OF SOUTH AMERICA OPERATING ROOM MANAGEMENT MARKET BY COMPONENT (USD BILLION) 2020-2030
TABLE 41 REST OF SOUTH AMERICA OPERATING ROOM MANAGEMENT MARKET BY DELIVERY MODE (USD BILLION) 2020-2030
TABLE 42 REST OF SOUTH AMERICA OPERATING ROOM MANAGEMENT MARKET BY SOLUTION (USD BILLION) 2020-2030
TABLE 43 REST OF SOUTH AMERICA OPERATING ROOM MANAGEMENT MARKET BY END USE (USD BILLION) 2020-2030
TABLE 44 ASIA-PACIFIC OPERATING ROOM MANAGEMENT MARKET BY COUNTRY (USD BILLION) 2020-2030
TABLE 45 ASIA-PACIFIC OPERATING ROOM MANAGEMENT MARKET BY COMPONENT (USD BILLION) 2020-2030
TABLE 46 ASIA-PACIFIC OPERATING ROOM MANAGEMENT MARKET BY DELIVERY MODE (USD BILLION) 2020-2030
TABLE 47 ASIA-PACIFIC OPERATING ROOM MANAGEMENT MARKET BY SOLUTION (USD BILLION) 2020-2030
TABLE 48 ASIA-PACIFIC OPERATING ROOM MANAGEMENT MARKET BY END USE (USD BILLION) 2020-2030
TABLE 49 INDIA OPERATING ROOM MANAGEMENT MARKET BY COMPONENT (USD BILLION) 2020-2030
TABLE 50 INDIA OPERATING ROOM MANAGEMENT MARKET BY DELIVERY MODE (USD BILLION) 2020-2030
TABLE 51 INDIA OPERATING ROOM MANAGEMENT MARKET BY SOLUTION (USD BILLION) 2020-2030
TABLE 52 INDIA OPERATING ROOM MANAGEMENT MARKET BY END USE (USD BILLION) 2020-2030
TABLE 53 CHINA OPERATING ROOM MANAGEMENT MARKET BY COMPONENT (USD BILLION) 2020-2030
TABLE 54 CHINA OPERATING ROOM MANAGEMENT MARKET BY DELIVERY MODE (USD BILLION) 2020-2030
TABLE 55 CHINA OPERATING ROOM MANAGEMENT MARKET BY SOLUTION (USD BILLION) 2020-2030
TABLE 56 CHINA OPERATING ROOM MANAGEMENT MARKET BY END USE (USD BILLION) 2020-2030
TABLE 57 JAPAN OPERATING ROOM MANAGEMENT MARKET BY COMPONENT (USD BILLION) 2020-2030
TABLE 58 JAPAN OPERATING ROOM MANAGEMENT MARKET BY DELIVERY MODE (USD BILLION) 2020-2030
TABLE 59 JAPAN OPERATING ROOM MANAGEMENT MARKET BY SOLUTION (USD BILLION) 2020-2030
TABLE 60 JAPAN OPERATING ROOM MANAGEMENT MARKET BY END USE (USD BILLION) 2020-2030
TABLE 61 SOUTH KOREA OPERATING ROOM MANAGEMENT MARKET BY COMPONENT (USD BILLION) 2020-2030
TABLE 62 SOUTH KOREA OPERATING ROOM MANAGEMENT MARKET BY DELIVERY MODE (USD BILLION) 2020-2030
TABLE 63 SOUTH KOREA OPERATING ROOM MANAGEMENT MARKET BY SOLUTION (USD BILLION) 2020-2030
TABLE 64 SOUTH KOREA OPERATING ROOM MANAGEMENT MARKET BY END USE (USD BILLION) 2020-2030
TABLE 65 AUSTRALIA OPERATING ROOM MANAGEMENT MARKET BY COMPONENT (USD BILLION) 2020-2030
TABLE 66 AUSTRALIA OPERATING ROOM MANAGEMENT MARKET BY DELIVERY MODE (USD BILLION) 2020-2030
TABLE 67 AUSTRALIA OPERATING ROOM MANAGEMENT MARKET BY SOLUTION (USD BILLION) 2020-2030
TABLE 68 AUSTRALIA OPERATING ROOM MANAGEMENT MARKET BY END USE (USD BILLION) 2020-2030
TABLE 69 SOUTH-EAST ASIA OPERATING ROOM MANAGEMENT MARKET BY COMPONENT (USD BILLION) 2020-2030
TABLE 70 SOUTH-EAST ASIA OPERATING ROOM MANAGEMENT MARKET BY DELIVERY MODE (USD BILLION) 2020-2030
TABLE 71 SOUTH-EAST ASIA OPERATING ROOM MANAGEMENT MARKET BY SOLUTION (USD BILLION) 2020-2030
TABLE 72 SOUTH-EAST ASIA OPERATING ROOM MANAGEMENT MARKET BY END USE (USD BILLION) 2020-2030
TABLE 73 REST OF ASIA PACIFIC OPERATING ROOM MANAGEMENT MARKET BY COMPONENT (USD BILLION) 2020-2030
TABLE 74 REST OF ASIA PACIFIC OPERATING ROOM MANAGEMENT MARKET BY DELIVERY MODE (USD BILLION) 2020-2030
TABLE 75 REST OF ASIA PACIFIC OPERATING ROOM MANAGEMENT MARKET BY SOLUTION (USD BILLION) 2020-2030
TABLE 76 REST OF ASIA PACIFIC OPERATING ROOM MANAGEMENT MARKET BY END USE (USD BILLION) 2020-2030
TABLE 77 EUROPE OPERATING ROOM MANAGEMENT MARKET BY COUNTRY (USD BILLION) 2020-2030
TABLE 78 EUROPE OPERATING ROOM MANAGEMENT MARKET BY COMPONENT (USD BILLION) 2020-2030
TABLE 79 EUROPE OPERATING ROOM MANAGEMENT MARKET BY DELIVERY MODE (USD BILLION) 2020-2030
TABLE 80 EUROPE OPERATING ROOM MANAGEMENT MARKET BY SOLUTION (USD BILLION) 2020-2030
TABLE 81 EUROPE OPERATING ROOM MANAGEMENT MARKET BY END USE (USD BILLION) 2020-2030
TABLE 82 GERMANY OPERATING ROOM MANAGEMENT MARKET BY COMPONENT (USD BILLION) 2020-2030
TABLE 83 GERMANY OPERATING ROOM MANAGEMENT MARKET BY DELIVERY MODE (USD BILLION) 2020-2030
TABLE 84 GERMANY OPERATING ROOM MANAGEMENT MARKET BY SOLUTION (USD BILLION) 2020-2030
TABLE 85 GERMANY OPERATING ROOM MANAGEMENT MARKET BY END USE (USD BILLION) 2020-2030
TABLE 86 UK OPERATING ROOM MANAGEMENT MARKET BY COMPONENT (USD BILLION) 2020-2030
TABLE 87 UK OPERATING ROOM MANAGEMENT MARKET BY DELIVERY MODE (USD BILLION) 2020-2030
TABLE 88 UK OPERATING ROOM MANAGEMENT MARKET BY SOLUTION (USD BILLION) 2020-2030
TABLE 89 UK OPERATING ROOM MANAGEMENT MARKET BY END USE (USD BILLION) 2020-2030
TABLE 90 FRANCE OPERATING ROOM MANAGEMENT MARKET BY COMPONENT (USD BILLION) 2020-2030
TABLE 91 FRANCE OPERATING ROOM MANAGEMENT MARKET BY DELIVERY MODE (USD BILLION) 2020-2030
TABLE 92 FRANCE OPERATING ROOM MANAGEMENT MARKET BY SOLUTION (USD BILLION) 2020-2030
TABLE 93 FRANCE OPERATING ROOM MANAGEMENT MARKET BY END USE (USD BILLION) 2020-2030
TABLE 94 ITALY OPERATING ROOM MANAGEMENT MARKET BY COMPONENT (USD BILLION) 2020-2030
TABLE 95 ITALY OPERATING ROOM MANAGEMENT MARKET BY DELIVERY MODE (USD BILLION) 2020-2030
TABLE 96 ITALY OPERATING ROOM MANAGEMENT MARKET BY SOLUTION (USD BILLION) 2020-2030
TABLE 97 ITALY OPERATING ROOM MANAGEMENT MARKET BY END USE (USD BILLION) 2020-2030
TABLE 98 SPAIN OPERATING ROOM MANAGEMENT MARKET BY COMPONENT (USD BILLION) 2020-2030
TABLE 99 SPAIN OPERATING ROOM MANAGEMENT MARKET BY DELIVERY MODE (USD BILLION) 2020-2030
TABLE 100 SPAIN OPERATING ROOM MANAGEMENT MARKET BY SOLUTION (USD BILLION) 2020-2030
TABLE 101 SPAIN OPERATING ROOM MANAGEMENT MARKET BY END USE (USD BILLION) 2020-2030
TABLE 102 RUSSIA OPERATING ROOM MANAGEMENT MARKET BY COMPONENT (USD BILLION) 2020-2030
TABLE 103 RUSSIA OPERATING ROOM MANAGEMENT MARKET BY DELIVERY MODE (USD BILLION) 2020-2030
TABLE 104 RUSSIA OPERATING ROOM MANAGEMENT MARKET BY SOLUTION (USD BILLION) 2020-2030
TABLE 105 RUSSIA OPERATING ROOM MANAGEMENT MARKET BY END USE (USD BILLION) 2020-2030
TABLE 106 REST OF EUROPE OPERATING ROOM MANAGEMENT MARKET BY COMPONENT (USD BILLION) 2020-2030
TABLE 107 REST OF EUROPE OPERATING ROOM MANAGEMENT MARKET BY DELIVERY MODE (USD BILLION) 2020-2030
TABLE 108 REST OF EUROPE OPERATING ROOM MANAGEMENT MARKET BY SOLUTION (USD BILLION) 2020-2030
TABLE 109 REST OF EUROPE OPERATING ROOM MANAGEMENT MARKET BY END USE (USD BILLION) 2020-2030
TABLE 110 MIDDLE EAST AND AFRICA OPERATING ROOM MANAGEMENT MARKET BY COUNTRY (USD BILLION) 2020-2030
TABLE 111 MIDDLE EAST AND AFRICA OPERATING ROOM MANAGEMENT MARKET BY COMPONENT (USD BILLION) 2020-2030
TABLE 112 MIDDLE EAST AND AFRICA OPERATING ROOM MANAGEMENT MARKET BY DELIVERY MODE (USD BILLION) 2020-2030
TABLE 113 MIDDLE EAST AND AFRICA OPERATING ROOM MANAGEMENT MARKET BY SOLUTION (USD BILLION) 2020-2030
TABLE 114 MIDDLE EAST AND AFRICA OPERATING ROOM MANAGEMENT MARKET BY END USE (USD BILLION) 2020-2030
TABLE 115 UAE OPERATING ROOM MANAGEMENT MARKET BY COMPONENT (USD BILLION) 2020-2030
TABLE 116 UAE OPERATING ROOM MANAGEMENT MARKET BY DELIVERY MODE (USD BILLION) 2020-2030
TABLE 117 UAE OPERATING ROOM MANAGEMENT MARKET BY SOLUTION (USD BILLION) 2020-2030
TABLE 118 UAE OPERATING ROOM MANAGEMENT MARKET BY END USE (USD BILLION) 2020-2030
TABLE 119 SAUDI ARABIA OPERATING ROOM MANAGEMENT MARKET BY COMPONENT (USD BILLION) 2020-2030
TABLE 120 SAUDI ARABIA OPERATING ROOM MANAGEMENT MARKET BY DELIVERY MODE (USD BILLION) 2020-2030
TABLE 121 SAUDI ARABIA OPERATING ROOM MANAGEMENT MARKET BY SOLUTION (USD BILLION) 2020-2030
TABLE 122 SAUDI ARABIA OPERATING ROOM MANAGEMENT MARKET BY END USE (USD BILLION) 2020-2030
TABLE 123 SOUTH AFRICA OPERATING ROOM MANAGEMENT MARKET BY COMPONENT (USD BILLION) 2020-2030
TABLE 124 SOUTH AFRICA OPERATING ROOM MANAGEMENT MARKET BY DELIVERY MODE (USD BILLION) 2020-2030
TABLE 125 SOUTH AFRICA OPERATING ROOM MANAGEMENT MARKET BY SOLUTION (USD BILLION) 2020-2030
TABLE 126 SOUTH AFRICA OPERATING ROOM MANAGEMENT MARKET BY END USE (USD BILLION) 2020-2030
TABLE 127 REST OF MIDDLE EAST AND AFRICA OPERATING ROOM MANAGEMENT MARKET BY COMPONENT (USD BILLION) 2020-2030
TABLE 128 REST OF MIDDLE EAST AND AFRICA OPERATING ROOM MANAGEMENT MARKET BY DELIVERY MODE (USD BILLION) 2020-2030
TABLE 129 REST OF MIDDLE EAST AND AFRICA OPERATING ROOM MANAGEMENT MARKET BY SOLUTION (USD BILLION) 2020-2030
TABLE 130 REST OF MIDDLE EAST AND AFRICA OPERATING ROOM MANAGEMENT MARKET BY END USE (USD BILLION) 2020-2030
LIST OF FIGURES
FIGURE 1 MARKET DYNAMICS
FIGURE 2 MARKET SEGMENTATION
FIGURE 3 REPORT TIMELINES: YEARS CONSIDERED
FIGURE 4 DATA TRIANGULATION
FIGURE 5 BOTTOM-UP APPROACH
FIGURE 6 TOP-DOWN APPROACH
FIGURE 7 RESEARCH FLOW
FIGURE 8 GLOBAL OPERATING ROOM MANAGEMENT MARKETBY COMPONENT, USD MILLION, 2020-2030
FIGURE 9 GLOBAL OPERATING ROOM MANAGEMENT MARKETBY DELIVERY MODE, USD MILLION, 2020-2030
FIGURE 10 GLOBAL OPERATING ROOM MANAGEMENT MARKETBY SOLUTION, USD MILLION, 2020-2030
FIGURE 11 GLOBAL OPERATING ROOM MANAGEMENT MARKETBY END USE, USD MILLION, 2020-2030
FIGURE 12 GLOBAL OPERATING ROOM MANAGEMENT MARKETBY REGION, USD MILLION, 2020-2030
FIGURE 13 PORTER’S FIVE FORCES MODEL
FIGURE 14 GLOBAL OPERATING ROOM MANAGEMENT MARKETBY COMPONENT, USD MILLION 2022
FIGURE 15 GLOBAL OPERATING ROOM MANAGEMENT MARKETBY DELIVERY MODE, USD MILLION 2022
FIGURE 16 GLOBAL OPERATING ROOM MANAGEMENT MARKETBY SOLUTION, USD MILLION 2022
FIGURE 17 GLOBAL OPERATING ROOM MANAGEMENT MARKETBY END USE, USD MILLION 2022
FIGURE 18 GLOBAL OPERATING ROOM MANAGEMENT MARKETBY REGION, USD MILLION 2022
FIGURE 24 MARKET SHARE ANALYSIS
FIGURE 25 GE HEALTHCARE: COMPANY SNAPSHOT
FIGURE 26 DICKINSON AND COMPANY: COMPANY SNAPSHOT
FIGURE 27 SURGICAL INFORMATION SYSTEMS: COMPANY SNAPSHOT
FIGURE 28 OPTUM: COMPANY SNAPSHOT
FIGURE 29 MEDITECH: COMPANY SNAPSHOT
FIGURE 30 PICIS CLINICAL SOLUTIONS: COMPANY SNAPSHOT
FIGURE 31 GETINGE AB: COMPANY SNAPSHOT
FIGURE 32 STERIS PLC: COMPANY SNAPSHOT
FIGURE 33 ALLSCRIPTS HEALTHCARE SOLUTIONS: COMPANY SNAPSHOT
FIGURE 34 NEXUS AG: COMPANY SNAPSHOT
FIGURE 35 MEDICAL INFORMATION TECHNOLOGY INC.: COMPANY SNAPSHOT
FIGURE 36 ALTERA DIGITAL HEALTH INC.: COMPANY SNAPSHOT
FIGURE 37 OMNICELL: COMPANY SNAPSHOT
FAQ
The operating room management market is expected to reach USD 3.87 billion by the end of 2023.
IoT devices used to track equipment usage is a key trend gaining popularity.
The global operating room management market size was valued at USD 2.73 billion in 2023, and projected to reach USD 7.79 billion by 2030, with a CAGR of 12.36% from 2023 to 2030.
The North America dominated the global industry in 2022 and accounted for the maximum share of more than 40% of the overall revenue.
In-Depth Database
Our Report’s database covers almost all topics of all regions over the Globe.
Recognised Publishing Sources
Tie ups with top publishers around the globe.
Customer Support
Complete pre and post sales
support.
Safe & Secure
Complete secure payment
process.
